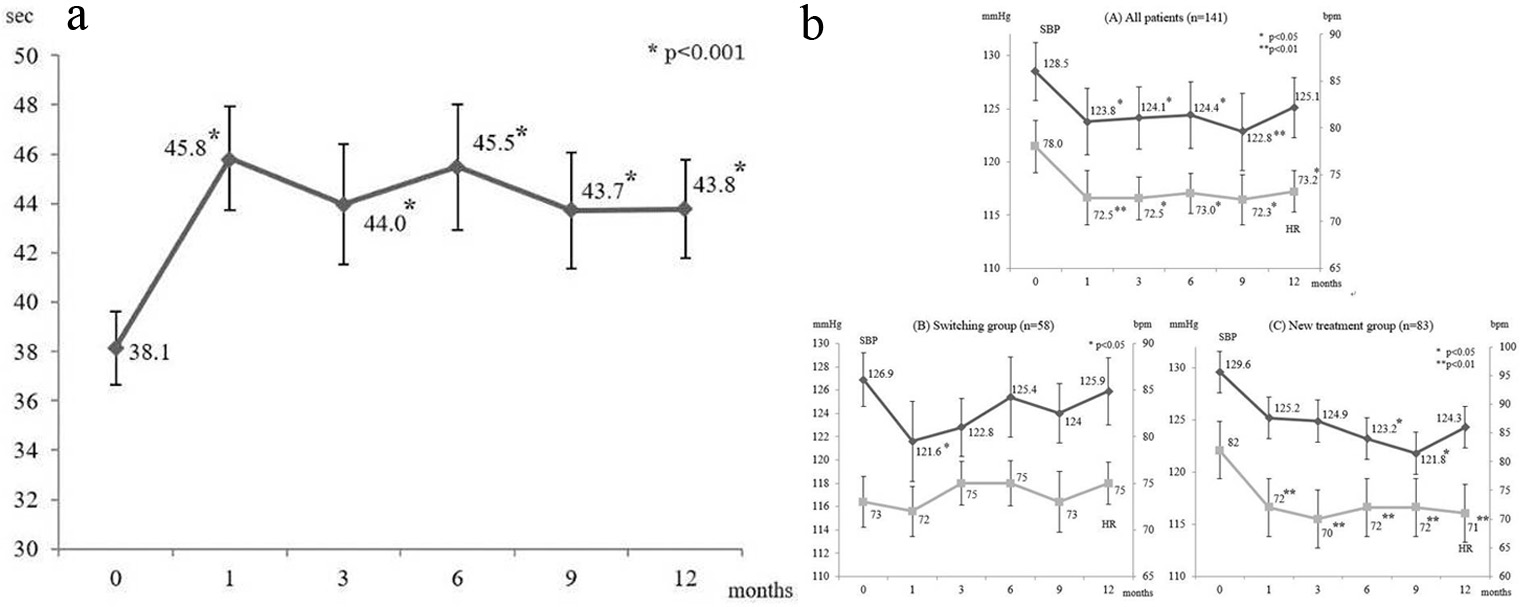
Figure 1. (a) Changes in aPTT; data are shown as the mean ± SD. (b) Changes in SBP and HR; data are shown as the mean ± SD. SBP: systolic blood pressure; HR: heart rate; bpm: beats per minute; SD: standard deviation.
| Cardiology Research, ISSN 1923-2829 print, 1923-2837 online, Open Access |
| Article copyright, the authors; Journal compilation copyright, Cardiol Res and Elmer Press Inc |
| Journal website http://www.cardiologyres.org |
Original Article
Volume 11, Number 1, February 2020, pages 33-39
Preliminary Observations on the Antihypertension Action of Dabigatran Etexilate in Patients With Nonvalvular Atrial Fibrillation: A Prospective Multicenter Single-Arm Interventional Study
Figures
Tables
| Data are shown as the mean ± SD or n (%). BMI: body mass index; HTN: hypertension; DM: diabetes mellitus type 2; CVD: cardiovascular disease; PT-INR: prothrombin time-international normalized ratio; ACE-I/ARB: angiotensin converting enzyme inhibitor/angiotensin receptor blocker; CCB: calcium channel blocker; SD: standard deviation. | |
| Age, years | 73 ± 10 |
| Male, n (%) | 98 (69) |
| BMI, kg/m2 | 24.0 ± 3.1 |
| HTN, n (%) | 119 (83) |
| DM, n (%) | 33 (23) |
| CVD, n (%) | 11 (8) |
| Pre-warfarin, n (%) | 59 (41) |
| PT-INR | 1.47 ± 0.32 |
| Drugs | |
| ACE-I/ARB, n (%) | 63 (44) |
| CCB, n (%) | 26 (18) |
| Diuretics, n (%) | 16 (11) |
| Data are shown as n (%). ACE-I/ARB: angiotensin converting enzyme inhibitor/angiotensin receptor blocker; CCB: calcium channel blocker. | |
| No change, n (%) | 85 (59) |
| ACE-I/ARB added, n (%) | 6 (4) |
| CCB added, n (%) | 10 (7) |
| Diuretics added, n (%) | 6 (4) |
| ACE-I to ARB, n (%) | 4 (3) |
| CCB to ARB, n (%) | 2 (1) |
| ACE-I/ARB reduced, n (%) | 2 (1) |
| CCB reduced, n (%) | 2 (1) |
| Unknown, n (%) | 26 (17) |
| 0 month | 12 months | P value | |
|---|---|---|---|
| Data are shown as the mean ± SD. Hb: hemoglobin; AST: aspartate transaminase; ALT: alanine aminotransferase; BUN: blood urea nitrogen; Cr: creatinine; T-Chol: total cholesterol; LDL: low density lipoprotein-cholesterol; HDL: high density lipoprotein-cholesterol; TG: triglyceride; UA: uric acid; Na: sodium; K: potassium; Cl: chloride ion; BG: blood glucose; HbA1c: hemoglobin A1c; BNP: brain natriuretic peptide; SD: standard deviation. | |||
| Hb, g/dL | 13.9 ± 1.7 | 13.8 ± 1.9 | 0.30 |
| AST, IU/L | 27.2 ± 10.9 | 25.3 ± 9.2 | 0.18 |
| ALT, IU/L | 24.6 ± 19.0 | 20.0 ± 10.1 | 0.05 |
| BUN, mg/dL | 16.6 ± 4.3 | 16.7 ± 4.3 | 0.44 |
| Cr, mg/dL | 0.89 ± 0.21 | 0.92 ± 0.22 | 0.12 |
| T-Chol, mg/dL | 185.0 ± 33.3 | 174.8 ± 31.9 | 0.05 |
| LDL, mg/dL | 106.1 ± 29.9 | 95.4 ± 26.9 | 0.02 |
| HDL, mg/dL | 56.8 ± 13.7 | 60.9 ± 14.2 | 0.04 |
| TG, mg/dL | 133.8 ± 79.3 | 116.0 ± 67.2 | 0.08 |
| UA, mg/dL | 5.8 ± 1.3 | 5.6 ± 1.4 | 0.22 |
| Na, mEq/L | 141.3 ± 2.4 | 141.2 ± 2.1 | 0.38 |
| K, mEq/L | 4.2 ± 0.4 | 4.3 ± 0.5 | 0.08 |
| Cl, mEq/L | 104.6 ± 2.9 | 104.8 ± 2.5 | 0.29 |
| BG, mg/dL | 121.7 ± 40.2 | 115.8 ± 108.3 | 0.28 |
| HbA1c, % | 6.3 ± 1.0 | 6.2 ± 0.6 | 0.46 |
| BNP, pg/dL | 177.8 ± 114.5 | 88.4 ± 90.5 | 0.03 |