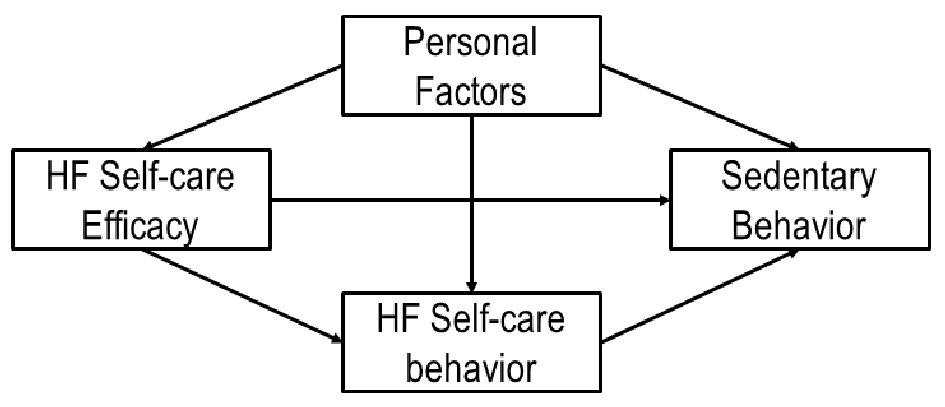
Figure 1. Proposed conceptual framework of factors related to sedentary behavior in HF patients. HF: heart failure.
| Cardiology Research, ISSN 1923-2829 print, 1923-2837 online, Open Access |
| Article copyright, the authors; Journal compilation copyright, Cardiol Res and Elmer Press Inc |
| Journal website http://www.cardiologyres.org |
Original Article
Volume 11, Number 2, April 2020, pages 97-105
Characterization of Sedentary Behavior in Heart Failure Patients With Arthritis
Figures
Tables
| Variable names | Overall | Sex | BMI | ||
|---|---|---|---|---|---|
| Male | Female | BMI ≥ 30 | BMI < 30 | ||
| Mean ± SD or n (%) | Mean ± SD or n (%) | Mean ± SD or n (%) | Mean ± SD or n (%) | Mean ± SD or n (%) | |
| aDietary sodium intake was measured by 24-h urinary sodium excretion. Values are mean ± SD for continuous variables and n (%) for categorical variables. SD: standard deviation; BMI: body mass index; HGB: hemoglobin; NYHC: New York Heart Classification; DM: diabetes mellitus. | |||||
| Age | 70 ± 12.16 | 70 ± 12.03 | 70 ± 12.33 | 65 ± 10.50 | 75 ± 12.15 |
| Years of school | 12.92 ± 2.28 | 13.22 ± 2.79 | 12.75 ± 1.92 | 13.24 ± 2.63 | 12.54 ± 1.71 |
| Marital | |||||
| Partnered | 51 (50.50) | 26 (70.27) | 25 (39.06) | 30 (54.55) | 21 (45.65) |
| Single | 50 (49.50) | 11 (29.73) | 39 (60.94) | 25 (45.45) | 25 (54.35) |
| Annual household income | |||||
| Under $10,000 | 16 (17.02) | 1 (2.86) | 15 (25.42) | 6 (11.76) | 10 (23.26) |
| $10,000 - $74,999 | 60 (63.83) | 26 (74.29) | 34 (57.63) | 34 (66.67) | 26 (60.47) |
| Over $75,000 | 8 (8.51) | 3 (8.57) | 5 (8.47) | 8 (15.69) | 7 (16.28) |
| Refused | 10 (10.64) | 5 (14.29) | 5 (8.47) | 3 (5.88) | 43 (100.00) |
| Employment status (0) | 72 (71.29) | 26 (70.27) | 46 (71.88) | 38 (69.09) | 34 (73.91) |
| Exercise (self-report) (+) | 66 (65.35) | 24 (64.86) | 42 (65.63) | 33 (60.00) | 33 (71.74) |
| Low-sodium diet (self-report) (+) | 25 (24.75) | 10 (27.03) | 15 (23.44) | 12 (21.82) | 13 (28.26) |
| Family help (self-report) (+) | 15 (14.85) | 9 (24.32) | 6 (9.38) | 11 (20.00) | 8 (18.60) |
| Physical examination | |||||
| BMI | 32.05 ± 7.18 | 31.50 ± 6.58 | 32.36 ± 7.53 | 37.34 ± 4.88 | 25.72 ± 3.25 |
| Laboratory | |||||
| HGB | 12.61 ± 1.89 | 13.18 ± 2.13 | 12.29 ± 1.67 | 12.75 ± 1.86 | 12.46 ± 1.94 |
| Fasting glucose | 162.08 ± 147.24 | 145.41 ± 76.36 | 171.60 ± 175.27 | 171.28 ± 164.28 | 151.04 ± 124.68 |
| Dietary sodium intakea | 4,108.94 ± 1,822.01 | 3,833.48 ± 1,508.25 | 4,263.89 ± 1,971.08 | 4,271.78 ± 1,926.99 | 3,909.93 ± 1,684.78 |
| Functional measures | |||||
| Ejection fraction | 55.81 (11.12) | 52.68 (11.92) | 57.75 (10.24) | 56.37 (9.64) | 55.21 (12.60) |
| NYHC class II (mild) | 58 (57.43) | 20 (54.05) | 38 (59.38) | 34 (61.82) | 24 (52.17) |
| NYHC class III (moderate) | 43 (42.57) | 17 (45.95) | 26 (40.63) | 21 (38.18) | 22 (47.83) |
| Medical history | |||||
| Hypertension (+) | 99 (98.02) | 36 (97.30) | 63 (98.44) | 54 (98.18) | 45 (97.83) |
| DM type 2 (+) | 41 (57.75) | 15 (55.56) | 26 (59.09) | 26 (65.00) | 15 (48.39) |
| DM with complications (+) | 33 (45.83) | 12 (44.44) | 21 (46.67) | 23 (56.10) | 10 (32.26) |
| Sex | Baseline | 3 month | 6 month | ||||||
|---|---|---|---|---|---|---|---|---|---|
| Daily minutes sedentary | Hours worn | Kilocalories expended | Daily minutes sedentary | Hours worn | Kilocalories expended | Daily minutes sedentary | Hours worn | Kilocalories expended | |
| SED-time: sedentary time; SD: standard deviation; BMI: body mass index. | |||||||||
| Male | |||||||||
| BMI ≥ 30 | 1,280.64 ± 113.44 | 16.18 ± 3.83 | 208.07 ± 230.13 | 1,255.40 ± 86.39 | 16.08 ± 2.77 | 219.76 ± 166.69 | 1,242.06 ± 86.47 | 15.32 ± 3.47 | 289.55 ± 270.31 |
| BMI < 30 | 1,255.42 ± 120.13 | 15.14 ± 3.98 | 151.67 ± 199.57 | 1,248.91 ± 94.57 | 15.75 ± 3.42 | 179.31 ± 168.99 | 1,250.67 ± 96.53 | 14.97 ± 3.57 | 165.95 ± 186.71 |
| Female | |||||||||
| BMI ≥ 30 | 1,249.72 ± 110.98 | 14.99 ± 3.81 | 142.07 ± 105.67 | 1,224.04 ± 119.27 | 16.06 ± 3.60 | 204.65 ± 159.80 | 1,248.02 ± 104.64 | 15.02 ± 2.83 | 226.88 ± 247.51 |
| BMI < 30 | 1,268.23 ± 91.81 | 15.81 ± 2.66 | 91.43 ± 69.99 | 1,232.89 ± 75.96 | 16.45 ± 2.90 | 111.46 ± 61.59 | 1,238.98 ± 144.81 | 16.45 ± 2.55 | 107.53 ± 61.72 |
| Variable | Pearson’s coefficient | P value |
|---|---|---|
| **P < 0.01, *P < 0.05. BMI: body mass index; SP: systolic pressure; DP: diastolic blood pressure; BNP: B-type natriuretic peptides; NYHC: New York Heart Classification; RSCB: 29-item Revised Heart Failure Self-Care Behavior Scale; Self-Eff, Self-Efficacy for HF Self-management Measure by Self-Care of Heart Failure Index; AHFKT: Atlanta heart failure knowledge test (AHFKT-V2). | ||
| Age | 0.397** | 0.00 |
| Sex | -0.06 | 0.58 |
| Race/ethnicity (choice = Caucasian) | 0.269* | 0.01 |
| Years of school | -0.06 | 0.56 |
| Health care benefits (choice = Medicare) | 0.344** | 0.00 |
| Annual household income | -0.15 | 0.20 |
| Distance traveled for doctor appointments | -0.253* | 0.02 |
| Currently working outside the home? | -0.322** | 0.00 |
| Work category (choice = full-time) | -0.244* | 0.02 |
| Work category (choice = part-time) | -0.227* | 0.03 |
| Work category (choice = retired) | 0.261* | 0.01 |
| Work category (choice = homemaker) | -0.02 | 0.85 |
| Discharge weight (kg) | -0.09 | 0.38 |
| BMI | -0.06 | 0.57 |
| SP admission | 0.00 | 1.00 |
| DP admission | -0.18 | 0.09 |
| BNP (log) | 0.286** | 0.01 |
| Ejection fraction | -0.03 | 0.82 |
| Hemoglobin (HGB) | -0.342** | 0.00 |
| Hematocrit (HCT) | -0.332** | 0.00 |
| White blood cell (WBC) | -0.16 | 0.13 |
| Hypertension | 0.10 | 0.36 |
| Stool softener/laxative | 0.232* | 0.03 |
| NYHC | 0.12 | 0.25 |
| RSCB behavior scale | -0.14 | 0.16 |
| Self-Eff | -0.14 | 0.16 |
| AHFKT-V2 | -0.13 | 0.21 |
| Variable | β | P |
|---|---|---|
| Multiple regression analysis with stepwise backward selection of variables; Determinants: average daily minutes of sedentary. Final model (n = 64). β: beta coefficient; BNP: B-type natriuretic peptide; SP: systolic pressure. | ||
| Medical knowledge | -0.629 | 0 |
| Hemoglobin (HGB) | -0.446 | 0 |
| BNP | 0.559 | 0 |
| SP admission | -0.326 | 0.005 |
| White blood cell (WBC) | 0.339 | 0.003 |
| Discharge weight (kg) | 0.233 | 0.035 |