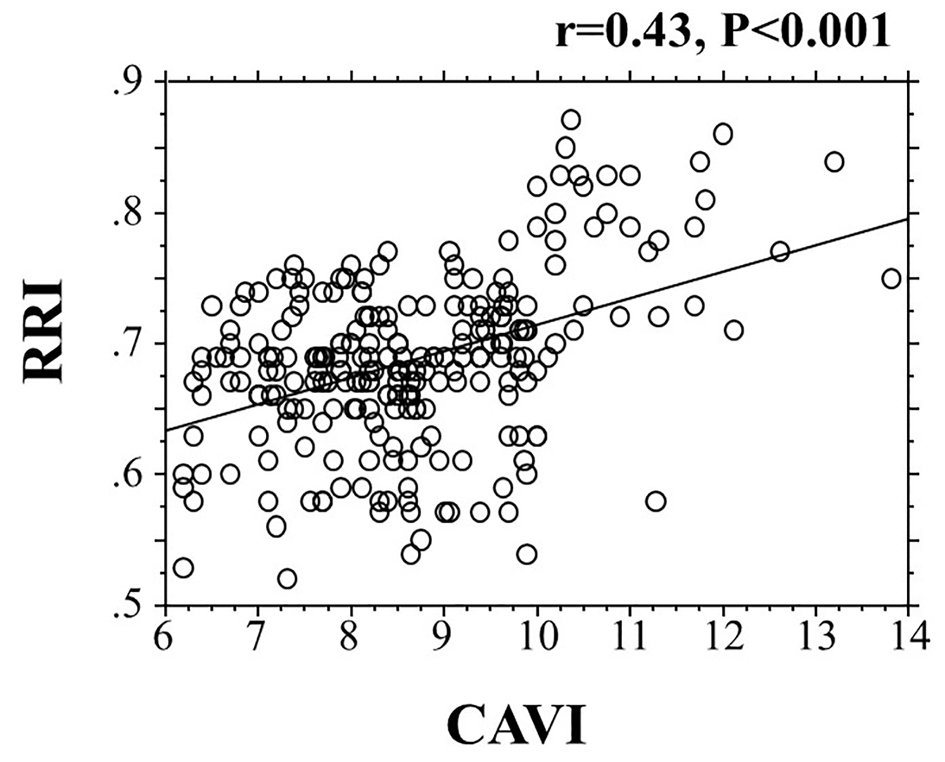
Figure 1. The correlation between the CAVI and the RRI. CAVI: cardio-ankle vascular index; RRI: renal resistive index.
| Cardiology Research, ISSN 1923-2829 print, 1923-2837 online, Open Access |
| Article copyright, the authors; Journal compilation copyright, Cardiol Res and Elmer Press Inc |
| Journal website http://www.cardiologyres.org |
Original Article
Volume 11, Number 2, April 2020, pages 106-112
Correlation Between the Cardio-Ankle Vascular Index and Renal Resistive Index in Patients With Essential Hypertension
Figures
Tables
| Continuous values are mean ± SD. LDL: low-density lipoprotein; HDL: high-density lipoprotein; eGFR: estimated glomerular filtration rate; d-ROMs: derivatives of reactive oxygen metabolites; RRI: renal resistive index; CAVI: cardio-ankle vascular index; CCB: calcium channel blocker; RAS: renin-angiotensin system. | |
| n (male/female) | 245 (95/150) |
| Age (years) | 65 ± 13 |
| Body mass index (kg/m2) | 22.6 ± 3.7 |
| Current smoker, n (%) | 63 (26) |
| Systolic blood pressure (mm Hg) | 138 ± 10 |
| Diastolic blood pressure (mm Hg) | 87 ± 10 |
| Pulse rate (/min) | 66 ± 11 |
| Diabetes mellitus, n (%) | 99 (40) |
| Fasting blood glucose (mg/dL) | 114 ± 25 |
| Hemoglobin A1c (%) | 6.5 ± 1.3 |
| Dyslipidemia, n (%) | 155 (63) |
| Total cholesterol (mg/dL) | 210 ± 39 |
| LDL-cholesterol (mg/dL) | 133 ± 36 |
| Triglyceride (mg/dL) | 130 ± 67 |
| HDL-cholesterol (mg/dL) | 50 ± 13 |
| eGFR (mL/min/1.73 m2) | 65 ± 21 |
| d-ROMs test (U. CARR) | 296 ± 96 |
| RRI | 0.69 ± 0.07 |
| CAVI | 8.7 ± 1.4 |
| Medication | |
| CCB, n (%) | 185 (76) |
| RAS inhibitor, n (%) | 136 (56) |
| β-blocker, n (%) | 51 (21) |
| Statin, n (%) | 102 (42) |
| CCB | RAS inhibitor | P value | |
|---|---|---|---|
| Data were evaluated in patients with single-agent. Continuous values are mean ± SD. CCB: calcium channel blocker; RAS: renin-angiotensin system; LDL: low-density lipoprotein; HDL: high-density lipoprotein; eGFR: estimated glomerular filtration rate; d-ROMs: derivatives of reactive oxygen metabolites; RRI: renal resistive index; CAVI: cardio-ankle vascular index. | |||
| n (male/female) | 101 (41/60) | 52 (19/33) | 0.629 |
| Age (years) | 66 ± 14 | 64 ± 13 | 0.342 |
| Body mass index (kg/m2) | 23.2 ± 3.6 | 23.2 ± 3.5 | 0.970 |
| Current smoker, n (%) | 28 (28) | 13 (25) | 0.721 |
| Systolic blood pressure (mm Hg) | 139 ± 11 | 139 ± 10 | 0.942 |
| Diastolic blood pressure (mm Hg) | 85 ± 10 | 88 ± 9 | 0.082 |
| Pulse rate (/min) | 67 ± 10 | 68 ± 11 | 0.394 |
| Diabetes mellitus, n (%) | 41 (41) | 24 (46) | 0.513 |
| Fasting blood glucose (mg/dL) | 115 ± 25 | 117 ± 26 | 0.717 |
| Hemoglobin A1c (%) | 6.7 ± 1.4 | 6.4 ± 1.2 | 0.096 |
| Dyslipidemia, n (%) | 66 (65) | 32 (62) | 0.645 |
| Total cholesterol (mg/dL) | 211 ± 40 | 212 ± 41 | 0.853 |
| LDL-cholesterol (mg/dL) | 135 ± 37 | 136 ± 35 | 0.999 |
| Triglyceride (mg/dL) | 134 ± 75 | 127 ± 65 | 0.561 |
| HDL-cholesterol (mg/dL) | 49 ± 13 | 52 ± 13 | 0.227 |
| eGFR (mL/min/1.73 m2) | 63 ± 22 | 68 ± 25 | 0.146 |
| d-ROMs test (U. CARR) | 311 ± 94 | 283 ± 97 | 0.098 |
| RRI | 0.71 ± 0.07 | 0.68 ± 0.04 | 0.006 |
| CAVI | 9.2 ± 1.5 | 8.4 ± 0.9 | < 0.001 |
| r | ||
|---|---|---|
| RRI | CAVI | |
| r expressed correlation coefficient. *P < 0.05, **P < 0.01, ***P < 0.001. RRI: renal resistive index; CAVI: cardio-ankle vascular index; LDL: low-density lipoprotein; HDL: high-density lipoprotein; eGFR: estimated glomerular filtration rate; d-ROMs: derivatives of reactive oxygen metabolites; CCB: calcium channel blocker; RAS: renin-angiotensin system. | ||
| Sex (female = 0, male = 1) | 0.06 | 0.10 |
| Age | 0.19** | 0.39*** |
| Body mass index | -0.12 | -0.09 |
| Current smoker (no = 0, yes = 1) | 0.05 | 0.17** |
| Systolic blood pressure | 0.13* | 0.04 |
| Diastolic blood pressure | -0.19** | -0.10 |
| Pulse rate | -0.03 | 0.05 |
| Diabetes mellitus (no = 0, yes = 1) | -0.01 | 0.18** |
| Fasting blood glucose | 0.06 | 0.19** |
| Hemoglobin A1c | 0.03 | 0.22*** |
| Dyslipidemia (no = 0, yes = 1) | 0.04 | -0.04 |
| Total cholesterol | 0.03 | 0.09 |
| LDL-cholesterol | 0.03 | 0.09 |
| Triglyceride | 0.02 | 0.07 |
| HDL-cholesterol | 0.04 | -0.05 |
| eGFR | -0.29*** | -0.34*** |
| d-ROMs test | 0.30*** | 0.31*** |
| CCB (no = 0, yes = 1) | 0.06 | 0.12 |
| RAS inhibitor (no = 0, yes = 1) | -0.24*** | -0.31*** |
| β-blocker (no = 0, yes = 1) | 0.12 | -0.06 |
| Statin (no = 0, yes = 1) | -0.03 | -0.15* |
| Variables | β | P value |
|---|---|---|
| R2 = 0.30, P < 0.001. RRI: renal resistive index; CAVI: cardio-ankle vascular index; d-ROMs: derivatives of reactive oxygen metabolites; RAS: renin-angiotensin system; eGFR: estimated glomerular filtration rate; β: standardized regression coefficient; R2: coefficient of determination. | ||
| CAVI | 0.28 | < 0.001 |
| d-ROMs test | 0.15 | 0.009 |
| RAS inhibitor | -0.14 | 0.019 |
| eGFR | -0.13 | 0.043 |
| Systolic blood pressure | -0.11 | 0.108 |
| Diastolic blood pressure | 0.10 | 0.235 |
| Age | 0.03 | 0.693 |