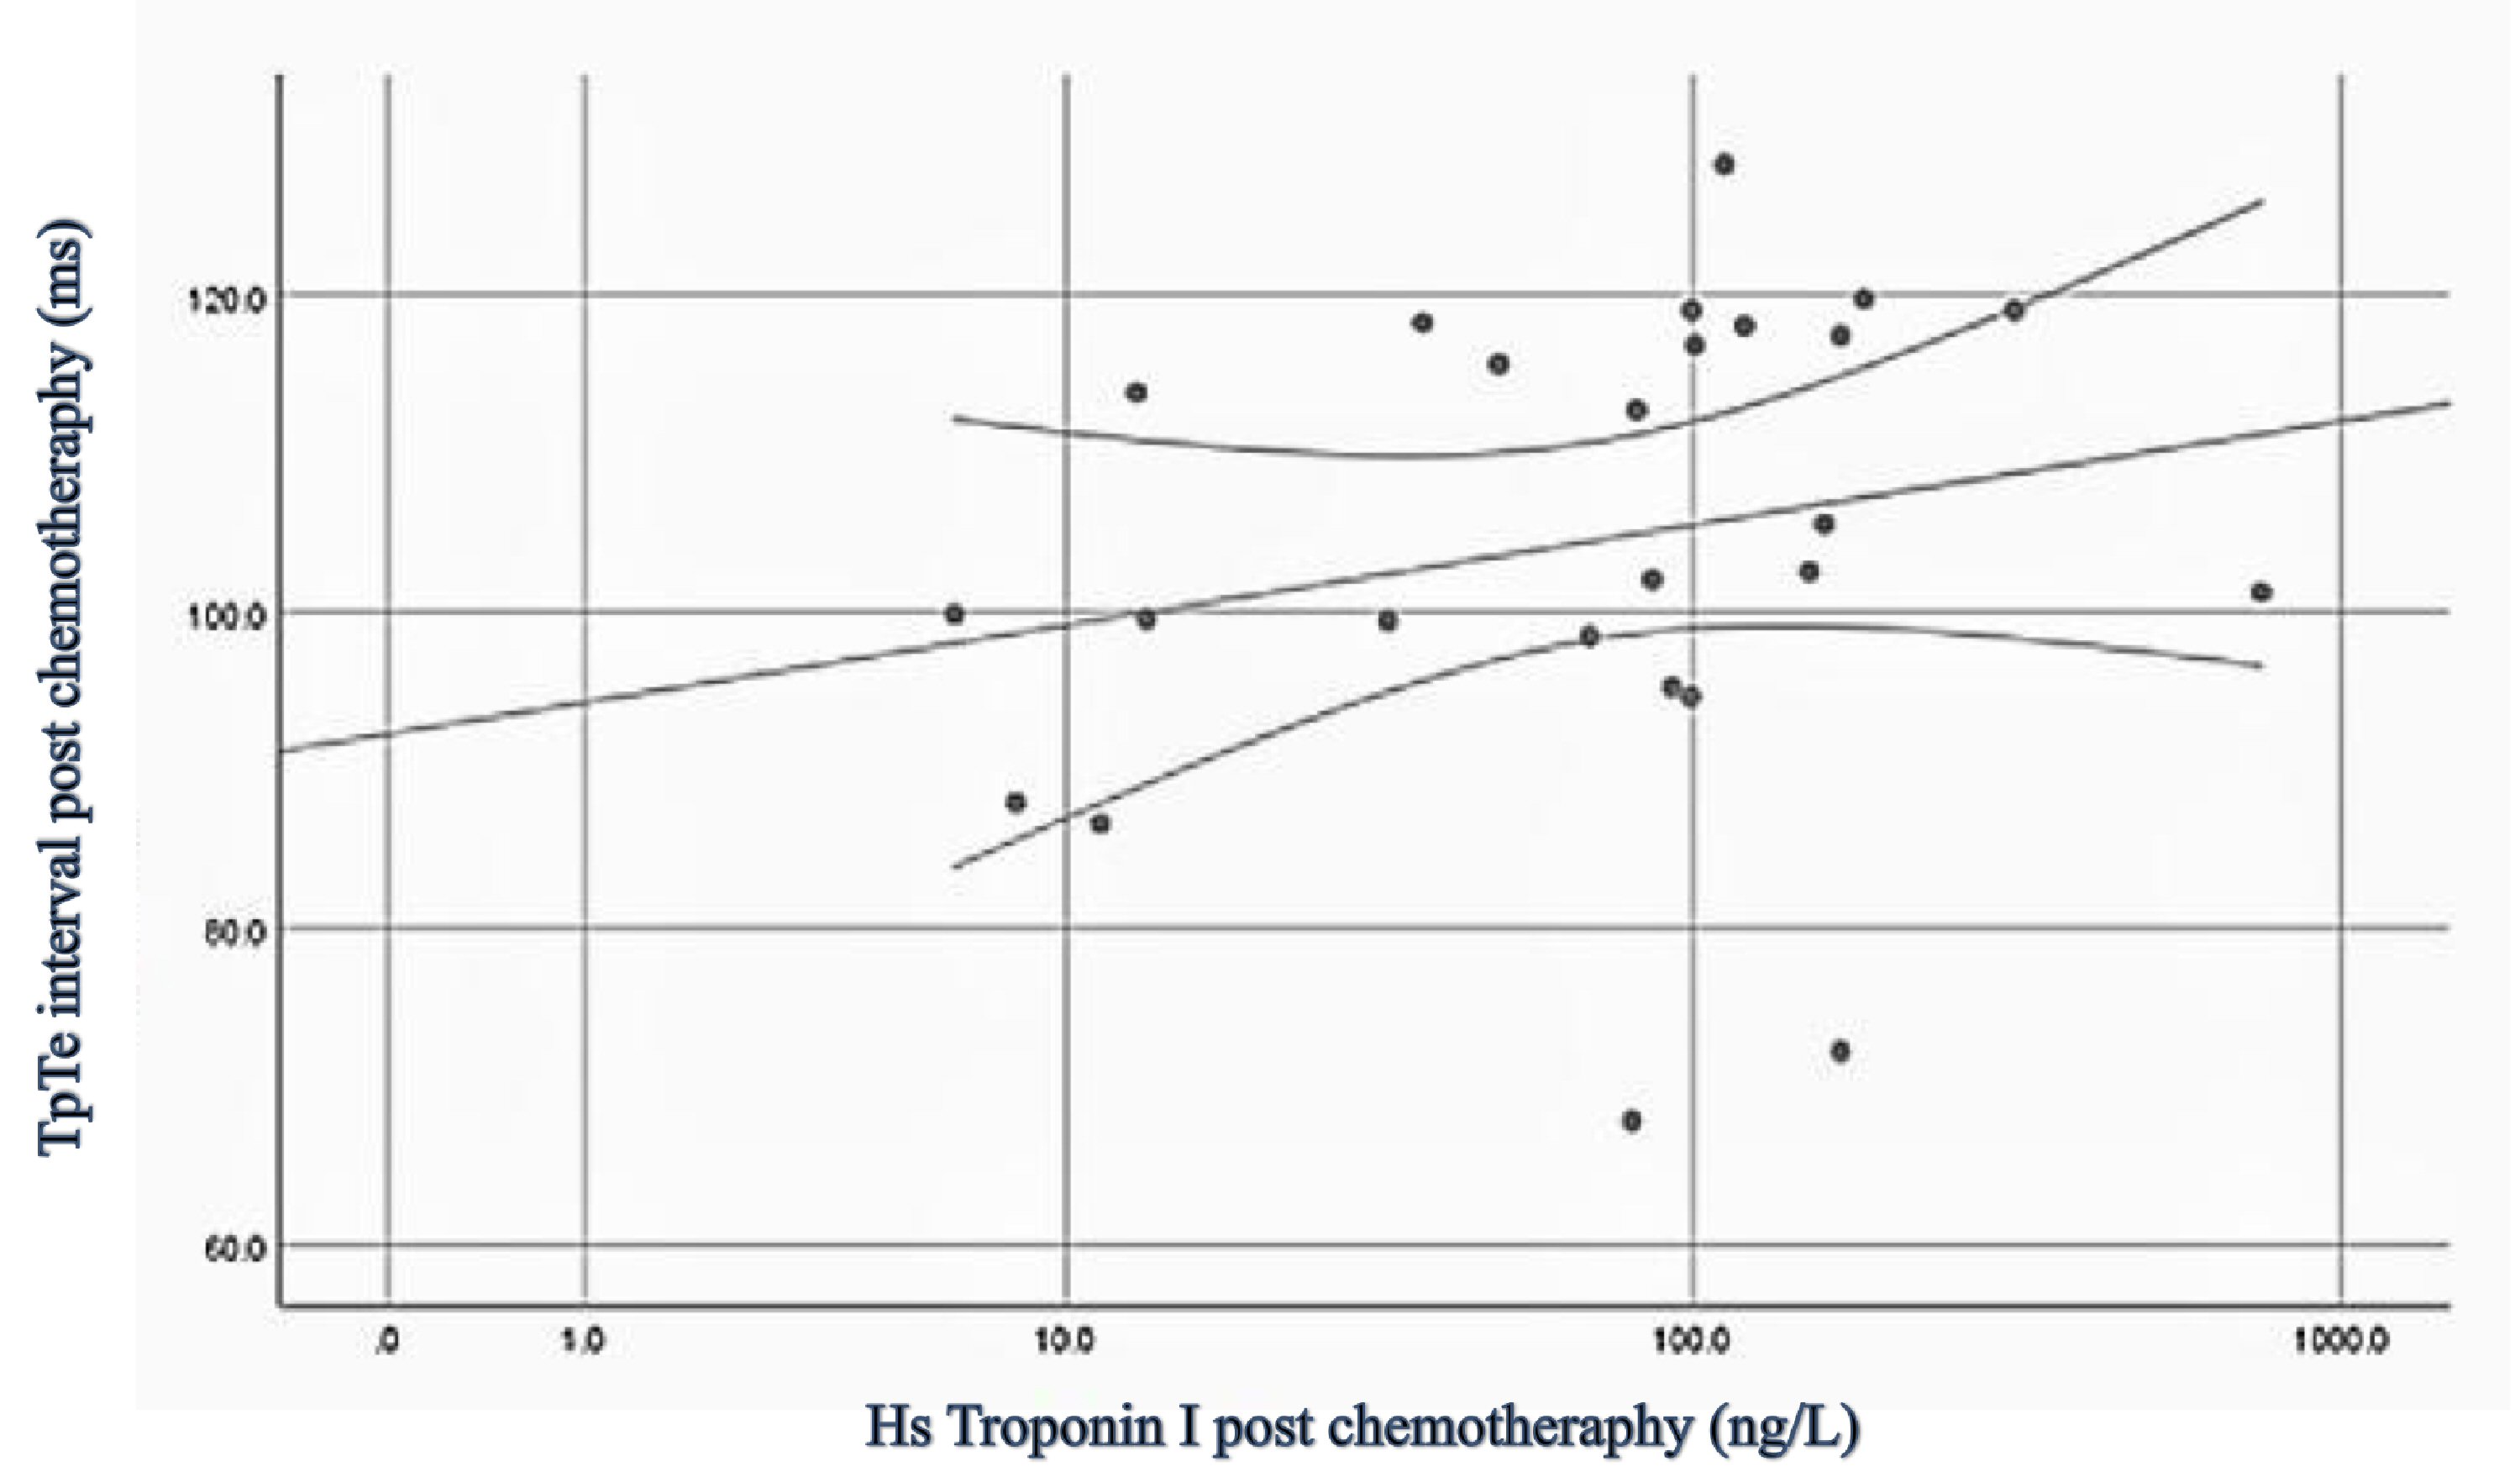
Figure 1. Scatter plot of hs-troponin I to TpTe interval. Hs: high sensitive; TpTe: T peak to T end.
| Cardiology Research, ISSN 1923-2829 print, 1923-2837 online, Open Access |
| Article copyright, the authors; Journal compilation copyright, Cardiol Res and Elmer Press Inc |
| Journal website http://www.cardiologyres.org |
Original Article
Volume 11, Number 5, October 2020, pages 305-310
Cardiotoxicity by Anthracycline Regimen Chemotherapy Prolonged T Peak to T End Interval
Figure
Tables
| Characteristics | N = 25 |
|---|---|
| BMI: body mass index; SD: standard deviation; ACEI: angiotensin-converting enzyme inhibitor; ARB: angiotensin II receptor blocker; LVEF: left ventricular ejection fraction. | |
| Age (years), mean ± SD | 46 ± 7 |
| BMI (kg/m2), mean ± SD | 24.9 ± 3.8 |
| Anthracycline cumulative dose (mg/m2), mean ± SD | 591 ± 52 |
| Comorbid, frequency, % | |
| Hypertension | 7 (28%) |
| Diabetes mellitus | 4 (16%) |
| Dyslipidemia | 2 (8%) |
| Medication, frequency % | |
| ACEI/ARB | 5 (20%) |
| Calcium channel blocker | 2 (8%) |
| QTc interval (ms), mean ± SD | 462.5 ± 21.9 |
| LVEF (%), mean ± SD | 67.4 ± 4.7 |
| Variable | Baseline | After chemotherapy | Correlation coefficient | P value |
|---|---|---|---|---|
| Hs-troponin I: high sensitive troponin I; TpTe: T peak to T end. | ||||
| Hs-troponin I (ng/L) | 4.5 (1.5 - 15) | 90.5 ± 44.7 | 0.421 | 0.018 |
| TpTe interval (ms) | 73.9 ± 59.8 | 108.2 ± 10 | ||
| Variable | T peak to T end | |
|---|---|---|
| Correlation coefficient | P value | |
| BMI: body mass index. | ||
| Age (years) | -0.169 | 0.420 |
| BMI (kg/m2) | -0.180 | 0.389 |
| Cumulative anthracycline dose | 0.407 | 0.044 |
| Hypertension | -0.191 | 0.361 |
| Diabetes mellitus | -0.367 | 0.071 |
| Variable | Unstandardized coefficients | Standardized coefficients | P value | R2 | |
|---|---|---|---|---|---|
| B | SE | Beta | |||
| Hs-troponin I: high sensitive troponin I; SE: standard error. | |||||
| Constants | 57.528 | 20.121 | 0.009 | 0.318 | |
| Hs-troponin I | 0.088 | 0.040 | 0.392 | 0.037 | |
| Cumulative anthracycline dose | 0.072 | 0.034 | 0.377 | 0.044 | |
| Constants | 99.642 | 4.274 | < 0.001 | 0.177 | |
| Hs-troponin I | 0.094 | 0.042 | 0.421 | 0.036 | |