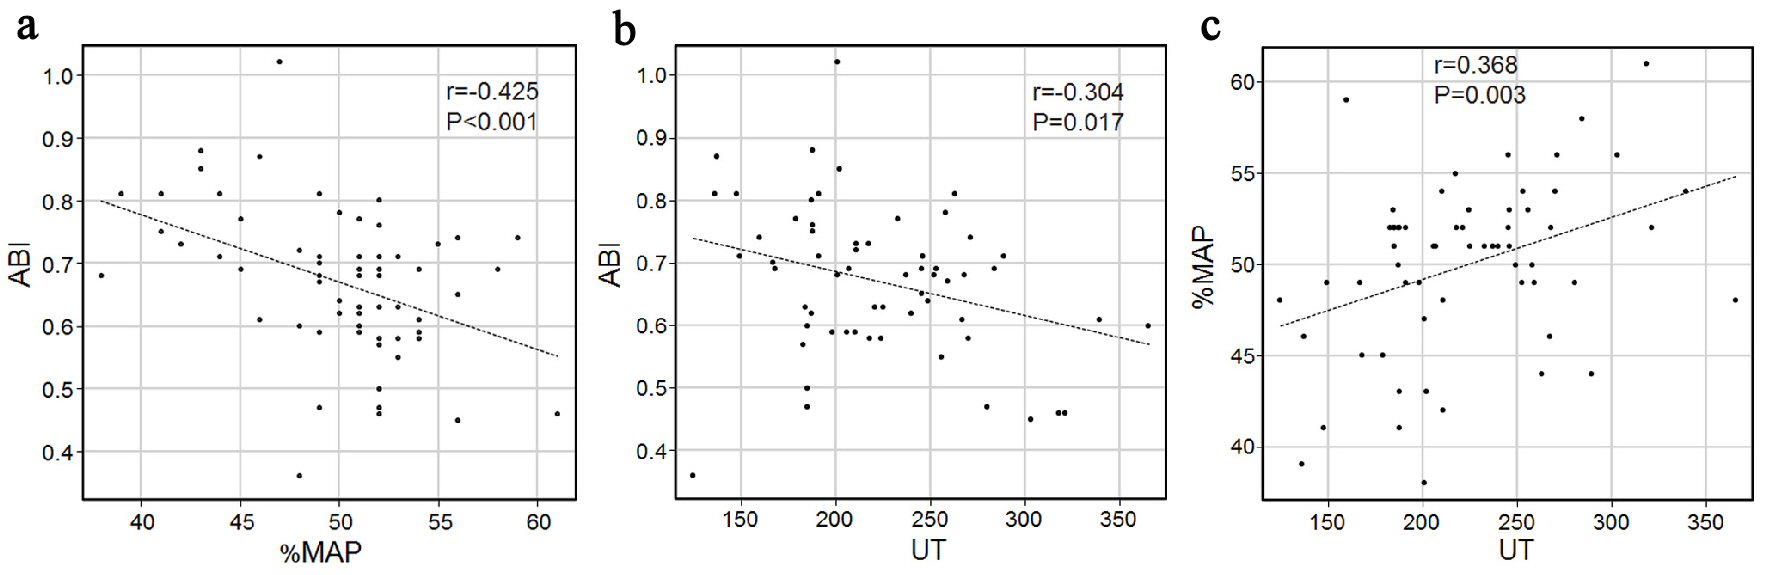
Figure 1. Pre-EVT scatter plots. (a) The ABI and %MAP; (b) The ABI and UT; and (c) The %MAP and UT. EVT: endovascular treatment; ABI: ankle-brachial index; %MAP: percentage of mean arterial pressure; UT: upstroke time
| Cardiology Research, ISSN 1923-2829 print, 1923-2837 online, Open Access |
| Article copyright, the authors; Journal compilation copyright, Cardiol Res and Elmer Press Inc |
| Journal website https://www.cardiologyres.org |
Original Article
Volume 11, Number 6, December 2020, pages 392-397
Correlations Between the Ankle-Brachial Index, Percentage of Mean Arterial Pressure, and Upstroke Time for Endovascular Treatment
Figures
Tables
| Demographic | |
|---|---|
| Data are expressed as the mean ± SD or number (%). BMI: body mass index; HT: hypertension; DM: diabetes mellitus; DL: dyslipidemia; IHD: ischemic heart disease; HD: hemodialysis; AF: atrial fibrillation; TC: total cholesterol; HDL-C: high-density lipoprotein cholesterol; LDL-C: low-density lipoprotein cholesterol; TG: triglyceride; HbA1c: glycated hemoglobin; BG: blood glucose; CRP: C-reactive protein; ABI: ankle-brachial index; %MAP: percentage of mean arterial pressure; UT: upstroke time. | |
| Age, years | 73.3 ± 7.6 |
| Male/female | 48 (76%)/15 (24%) |
| Height, m | 1.61 ± 0.09 |
| Weight, kg | 61.3 ± 13.2 |
| BMI, kg/m2 | 23.6 ± 4.4 |
| Medical history | |
| HT | 52 (83%) |
| DM (type 2) | 39 (62%) |
| DL | 41 (65%) |
| IHD | 32 (51%) |
| HD | 17 (27%) |
| AF | 7 (11%) |
| Current/past smoking | 40 (63%)/6 (10%) |
| Laboratory characteristics | |
| TC, mg/dL | 180 ± 38 |
| HDL-C, mg/dL | 52 ± 15 |
| LDL-C, mg/dL | 103 ± 31 |
| TG, mg/dL | 150 ± 68 |
| HbA1c, % | 6.5 ± 0.9 |
| BG, mg/dL | 135 ± 42 |
| CRP, mg/dL | 0.57 ± 1.37 |
| Clinical presentation | |
| Fontaine stage: 2/3/4 | 45 (71%)/3 (5%)/15 (24%) |
| Rutherford category: 2/3/4/5/6 | 35 (56%)/10 (16%)/3 (5%)/11 (17%)/4 (6%) |
| ABI | 0.66 ± 0.12 |
| %MAP, % | 49.9 ± 4.7 |
| UT, ms | 224 ± 51 |
| Lesions | |
|---|---|
| CIA: common iliac artery; EIA: external iliac artery; CFA: common femoral artery; SFA: superficial femoral artery; POP: popliteal artery; TASCII: Trans-Atlantic Inter-Society Consensus II; PACSS: peripheral arterial calcium scoring system; POBA: plain old balloon angioplasty; DCB: drug-coated balloon. | |
| CIA | 12 (19%) |
| EIA | 5 (8%) |
| TASCII A/B/C/D | 7/7/2/1 |
| CFA | 2 (3%) |
| SFA | 43 (68%) |
| POP | 1 (2%) |
| TASCII A/B/C/D | 4/20/15/7 |
| Lesion length | |
| Focal, ≤ 1 cm | 6 (10%) |
| Short, > 1 and < 5 cm | 29 (46%) |
| Intermediate, ≥ 5 and < 15 cm | 19 (30%) |
| Long, ≥ 15 cm | 9 (14%) |
| PACSS grade | |
| 0 | 6 (10%) |
| 1 | 21 (33%) |
| 2 | 14 (22%) |
| 3 | 16 (25%) |
| 4 | 6 (10%) |
| Stenosis | |
| 75% | 4 (6%) |
| 90% | 30 (48%) |
| 99% | 8 (13%) |
| 100% | 21 (33%) |
| Procedure | |
| POBA | 28 (44%) |
| DCB | 5 (8%) |
| Stent | 27 (43%) |
| Viabahn® stent graft | 3 (5%) |