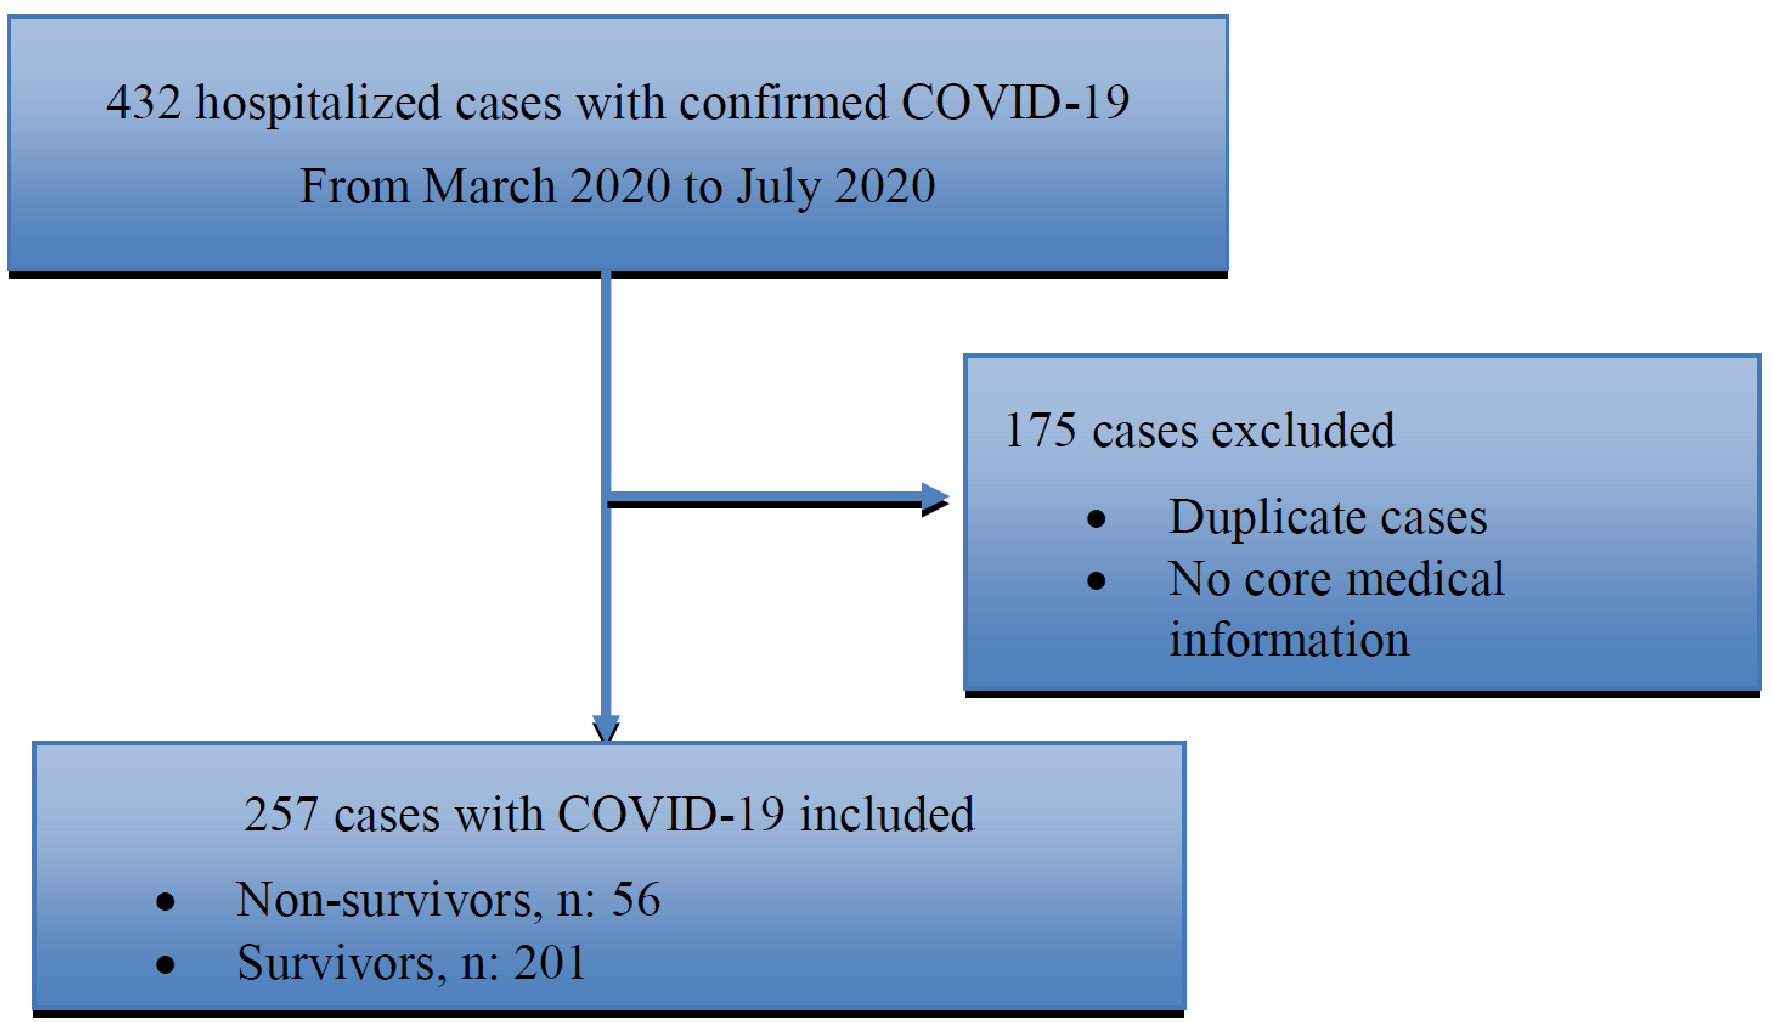
Figure 1. Flowchart for participants’ selection. COVID-19: coronavirus disease 2019.
| Cardiology Research, ISSN 1923-2829 print, 1923-2837 online, Open Access |
| Article copyright, the authors; Journal compilation copyright, Cardiol Res and Elmer Press Inc |
| Journal website https://www.cardiologyres.org |
Original Article
Volume 11, Number 6, December 2020, pages 398-404
Cardiac Troponin-I and COVID-19: A Prognostic Tool for In-Hospital Mortality
Figure
Tables
| Elevated troponinb (n = 71) | Normal troponinc (n = 186) | P value | |
|---|---|---|---|
| *Statistically significant. a± SD. bElevated troponin: ≥ 0.012 ng/mL which falls above the 99th percentile in the blood test based on our facility’s laboratory data. cNormal troponin: < 0.012 ng/mL which falls below the 99th percentile in the blood test based on our facility’s laboratory data. COVID-19: coronavirus disease 2019; SD: standard deviation. | |||
| Baseline characteristics | |||
| Age, mean (SDa), years | 77(13) | 58(16) | < 0.0001* |
| Sex, female (%) | 35(49) | 87(46) | 0.7174 |
| Body mass index, mean (SDa), kg/m2 | 26(6.6) | 30(7.9) | 0.0002* |
| Race, Black (%) | 13(18) | 30(16) | 0.2786 |
| Ethnicity, Hispanic (%) | 13(18) | 45(24) | 0.3034 |
| Asthma (%) | 4(5) | 17(9) | 0.3509 |
| Chronic obstructive lung disease (%) | 2(2) | 5(2) | 0.9621 |
| Chronic kidney disease (%) | 7(10) | 3(1) | 0.0024* |
| Atrial fibrillation/flutter (%) | 14(20) | 11(6) | 0.0009* |
| Diabetes mellitus (%) | 30(42) | 42(22) | 0.0019* |
| Hypertension (%) | 56(79) | 85(45) | < 0.0001* |
| Stroke/transient ischemic attack (%) | 4(5) | 6(3) | 0.3786 |
| Coronary artery disease (%) | 21(30) | 10(5) | < 0.0001* |
| Chronic heart failure (%) | 11(15) | 7(3) | 0.0011* |
| Severe valvular disease (%) | 2(2) | 1(0.5) | 0.1303 |
| Coronary artery bypass graft surgery (%) | 6(8) | 1(0.5) | 0.0020* |
| Peripheral vascular disease (%) | 3(4) | 5(2) | 0.5327 |
| Laboratory data at the time of admission | |||
| Blood urea nitrogen, mean (SDa), mg/dL | 40(31) | 17(12) | < 0.0001* |
| Creatinine, mean (SDa), mg/dL | 1.7(1.3) | 0.9(0.7) | < 0.0001* |
| Sodium, mean (SDa), mEq/L | 139(10) | 136(3) | 0.0235* |
| Random blood glucose level, mean (SDa), mg/dL | 181(131) | 138(68) | 0.0091* |
| Absolute lymphocyte count, mean (SDa) | 2(5) | 1.8(4) | 0.7991 |
| Lactic acid, mean (SDa), mmol/L | 3(4) | 1.2(0.5) | 0.0046* |
| Total bilirubin, mean (SDa), mg/dL | 0.7(0.5) | 0.5(0.3) | 0.0055* |
| Albumin, mean (SDa), mg/dL | 3.5(0.5) | 3.9(0.4) | < 0.0001* |
| In-hospital mortality or discharge to hospice, (%) | 37(52) | 19(10) | < 0.0001* |
| Non-survivorsb (n = 56) | Survivorsc (n = 201) | P value | |
|---|---|---|---|
| *Statistically significant. a± SD. bNon-survivors: patients died during the index hospitalization or discharged to hospice. cSurvivors: Patients were discharged home alive. dElevated troponin: ≥ 0.012 ng/ml which falls above the 99th percentile in the blood test based on our facility’s laboratory data. SD: standard deviation; TIA: transient ischemic attack. | |||
| Characteristics | |||
| Age, mean (SDa), years | 75(14) | 60(17) | < 0.0001* |
| Sex, female (%) | 29(51) | 93(46) | 0.4839 |
| Body mass index, mean (SDa), kg/m2 | 28(7) | 29(7) | 0.2907 |
| Race, Black (%) | 6(10) | 37(18) | 0.3101 |
| Ethnicity, Hispanic (%) | 13(23) | 45(22) | 0.9144 |
| Asthma (%) | 3(5) | 18(9) | 0.3774 |
| Chronic obstructive lung disease (%) | 2(3) | 5(2) | 0.6658 |
| Chronic kidney disease (%) | 3(5) | 7(3) | 0.5281 |
| Atrial fibrillation/flutter (%) | 12(21) | 13(6) | 0.0009* |
| Diabetes mellitus (%) | 21(37) | 51(25) | 0.0780 |
| Hypertension (%) | 40(71) | 101(50) | 0.0057 |
| Stroke/TIA (%) | 4(7) | 6(3) | 0.1581 |
| Coronary artery disease (%) | 9(16) | 22(11) | 0.3060 |
| Chronic heart failure (%) | 7(12) | 11(5) | 0.0707 |
| Severe valvular disease (%) | 2(3) | 1(0.5) | 0.0594 |
| Coronary artery bypass graft surgery (%) | 3(5) | 4(2) | 0.3477 |
| Peripheral vascular disease (%) | 1(1) | 7(3) | 0.5131 |
| Laboratory data at the time of admission | |||
| Blood urea nitrogen, mean (SDa), mg/dL | 37(30) | 19(17) | < 0.0001* |
| Creatinine, mean (SDa), mg/dL | 1.5(1.2) | 1(0.9) | 0.0097* |
| Random blood glucose level, mean (SDa), mg/dL | 194(128) | 138(75) | 0.0026* |
| Absolute lymphocyte count, mean (SDa), × 103 cells/µL | 1.2(1.2) | 2(5.5) | 0.0499* |
| Sodium, mean (SDa), mEq/L | 138(9) | 136(4) | 0.0903 |
| Lactic acid, mean (SDa), mmol/L | 3(4) | 1(0.5) | 0.0035* |
| Total bilirubin, mean (SDa), mg/dL | 0.7(0.5) | 0.5(0.2) | 0.0045* |
| Elevated troponind (%) | 37 (66) | 34(17) | < 0.0001* |
| Albumin, mean (SDa), mg/dL | 3.5(0.4) | 3.8(0.4) | 0.0004* |
| Statistic | Value | 95% confidence interval |
|---|---|---|
| *The prevalence of all-cause in-hospital mortality for the study population. Sensitivity, specificity, disease (mortality) prevalence, positive and negative predictive value as well as accuracy are expressed as percentages. Confidence intervals for sensitivity, specificity and accuracy are “exact” Clopper-Pearson confidence intervals. Confidence intervals for the likelihood ratios are calculated using the “Log method” as given on page 109 of Altman et al 2000 [7]. Confidence intervals for the predictive values are the standard logit confidence intervals given by Mercaldo et al 2007 [8]. COVID-19: coronavirus disease 2019. | ||
| Sensitivity | 66% | 52.1% - 78.1% |
| Specificity | 83% | 77.0% - 87.9% |
| Positive likelihood ratio | 3.89 | 2.71 - 5.57 |
| Negative likelihood ratio | 0.41 | 0.28 - 0.59 |
| Disease (mortality) prevalence | 21.7% (mortality)* | |
| Positive predictive value | 51.9% | 43% - 60.7% |
| Negative predictive value | 89.7% | 85.8% - 92.7% |
| Accuracy | 79.3% | 73.8% - 84.1% |