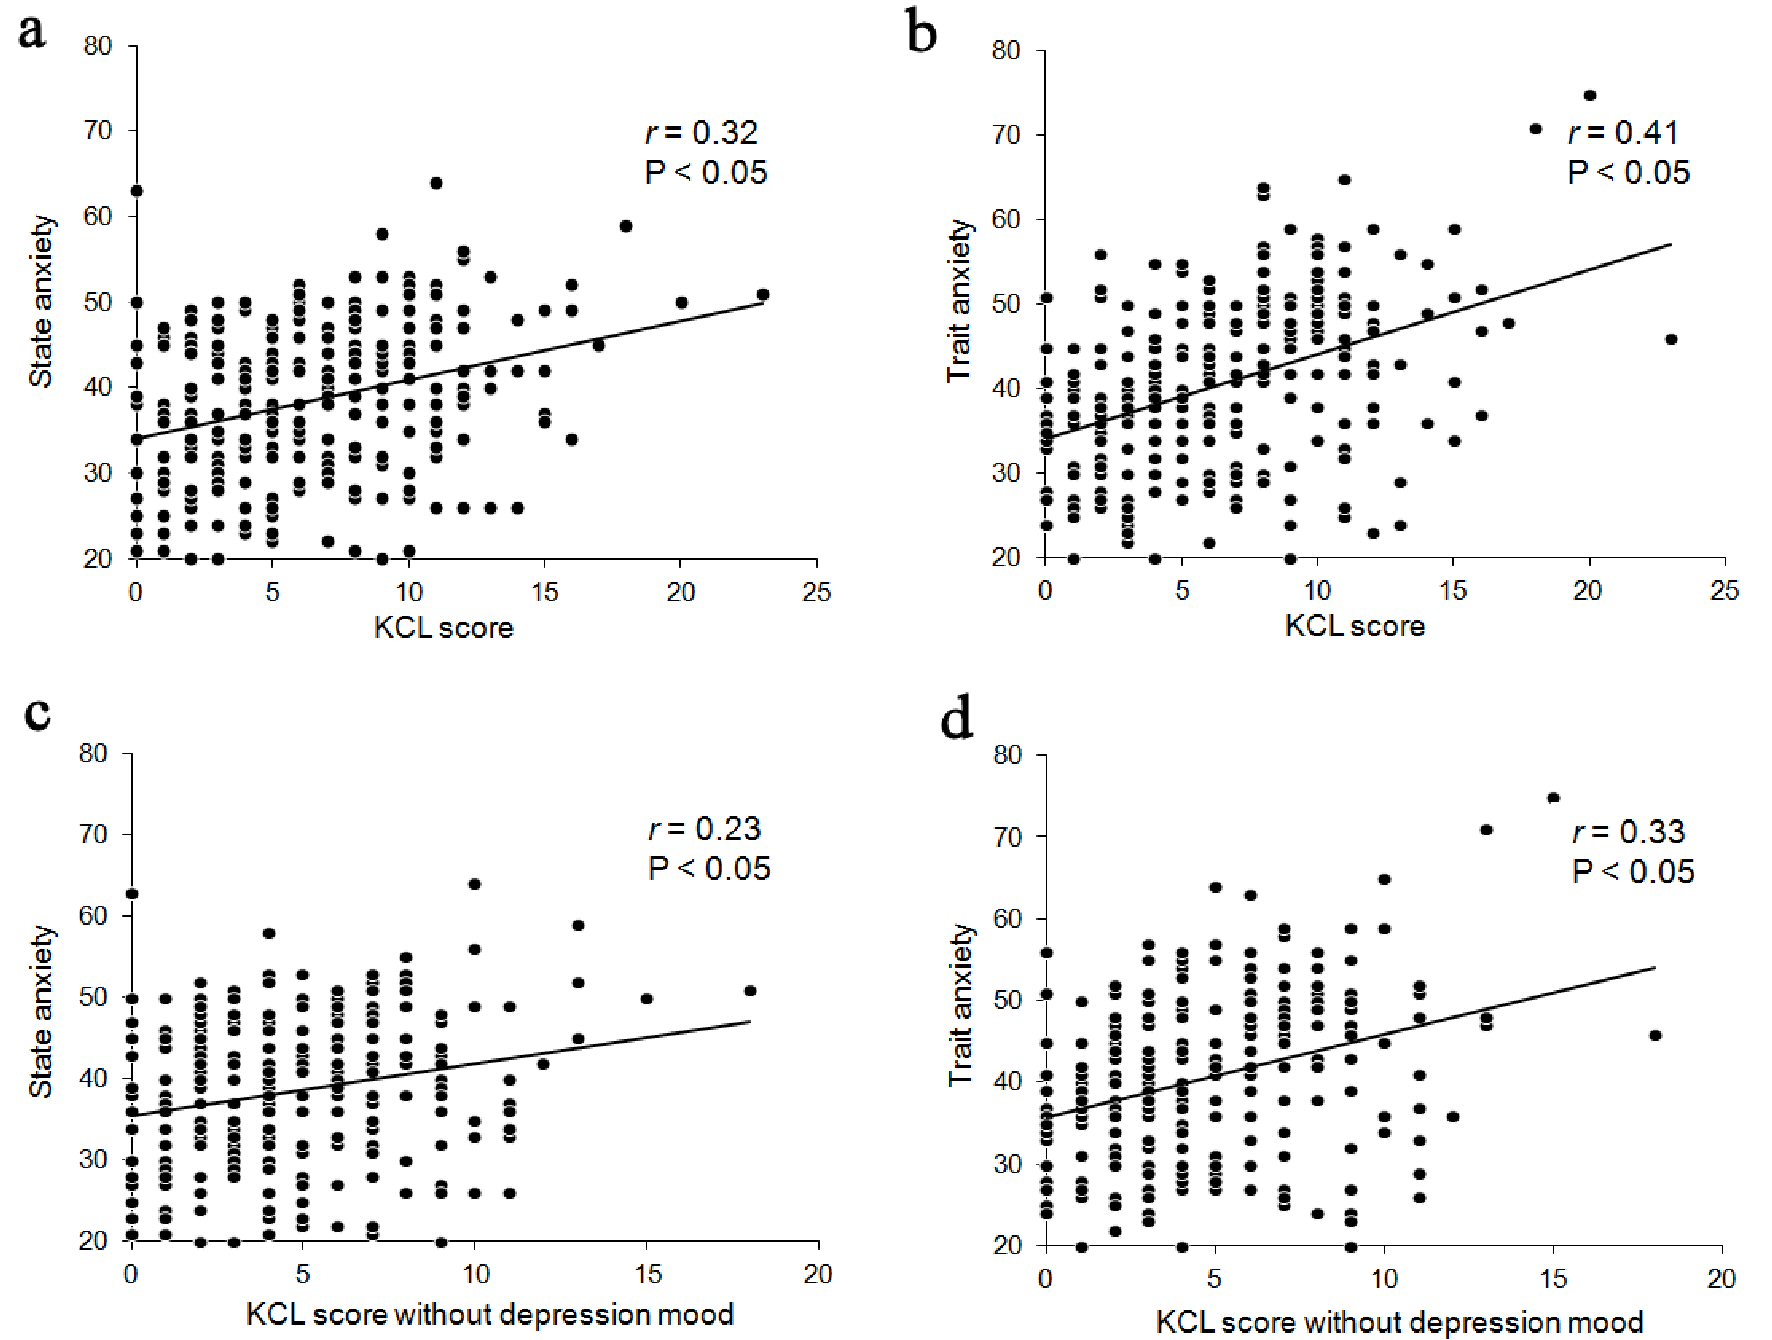
| Cardiology Research, ISSN 1923-2829 print, 1923-2837 online, Open Access |
| Article copyright, the authors; Journal compilation copyright, Cardiol Res and Elmer Press Inc |
| Journal website https://www.cardiologyres.org |
Original Article
Volume 11, Number 6, December 2020, pages 405-411
Relationship Between Kihon Checklist Score and Anxiety Levels in Elderly Patients Undergoing Early Phase II Cardiac Rehabilitation
Figure

Tables
| Non-frailty (n = 75) | Pre-frailty (n = 81) | Frailty (n = 99) | P value | |
|---|---|---|---|---|
| Data are presented as the mean value ± SD. aP < 0.05 vs. non-frailty by Tukey’s honest significant difference test. BMI: body mass index; CVD: cardiovascular disease; CR: cardiac rehabilitation; eGFR: estimated glomerular filtration rate; TG: triglyceride; HDL-C: high-density lipoprotein cholesterol; LDL-C: low-density lipoprotein cholesterol; HbA1c: hemoglobin A1c; BNP: brain natriuretic peptide; GNRI, geriatric nutritional risk index; LV: left ventricular. | ||||
| Age (years) | 73.8 ± 5.7 | 75.0 ± 5.8 | 75.5 ± 5.8 | 0.14 |
| Male (%) | 60 (80) | 48 (60)a | 62 (62)a | 0.01 |
| BMI (kg/m2) | 23.5 ± 2.7 | 22.5 ± 3.9 | 21.5 ± 4.6a | < 0.01 |
| Hypertension (%) | 55 (73) | 53 (66) | 70 (70) | 0.35 |
| Dyslipidemia (%) | 37 (49) | 37 (46) | 46 (46) | 0.89 |
| Diabetes mellitus (%) | 20 (27) | 24 (30) | 36 (36) | 0.26 |
| Current smoker (%) | 14 (19) | 9 (10) | 13 (13) | 0.24 |
| CVD at the beginning of CR | ||||
| Ischemic heart disease (%) | 40 (53) | 43 (53) | 52 (52) | 0.99 |
| Open heart surgery (%) | 41 (55) | 49 (61) | 64 (64) | 0.41 |
| Chronic heart failure (%) | 13 (17) | 19 (24) | 24 (24) | 0.51 |
| Anthropometric parameters and physical function | ||||
| Body fat percentage (%) | 22.8 ± 8.0 | 24.2 ± 11.2 | 21.7 ± 9.8 | 0.28 |
| Lean body weight (kg) | 47.5 ± 7.6 | 42.7 ± 8.6a | 41.9 ± 9.2a | < 0.01 |
| Grip strength (kg) | 28.1 ± 6.8 | 27.1 ± 7.4 | 25.4 ± 7.9 | 0.27 |
| 6-min walking test (m) | 387 ± 72 | 339 ± 92a | 310 ± 95a | < 0.01 |
| Laboratory data | ||||
| Hemoglobin (g/dL) | 13.2 ± 1.9 | 12.5 ± 1.8a | 12.2 ± 1.7a | < 0.01 |
| Albumin (g/dL) | 3.9 ± 0.4 | 3.8 ± 0.6 | 3.7 ± 0.5 | 0.08 |
| Creatinine (mg/dL) | 1.03 ± 1.13 | 1.19 ± 1.28 | 1.31 ± 1.60 | 0.39 |
| eGFR (mL/min/1.73m2) | 67.0 ± 21.3 | 63.2 ± 26.6 | 57.5 ± 24.6a | 0.03 |
| TG (mg/dL) | 112 ± 59 | 114 ± 96 | 104 ± 48 | 0.58 |
| HDL-C (mg/dL) | 49 ± 15 | 50 ± 15 | 49 ± 15 | 0.93 |
| LDL-C (mg/dL) | 101 ± 27 | 103 ± 30 | 94 ± 28 | 0.08 |
| HbA1c (%) | 6.0 ± 0.7 | 6.1 ± 0.9 | 6.2 ± 0.9 | 0.31 |
| BNP (pg/mL) | 205 ± 407 | 265 ± 374 | 303 ± 709 | 0.49 |
| GNRI | 102.3 ± 8.5 | 98.1 ± 14.3 | 96.0 ± 12.1a | < 0.01 |
| LV ejection fraction (%) | 59.7 ± 15.3 | 56.3 ± 14.6 | 57.1 ± 16.4 | 0.34 |
| Non-frailty (n = 75) | Pre-frailty (n = 81) | Frailty (n = 99) | P value | |
|---|---|---|---|---|
| Data are presented as the mean value ± SD. aP < 0.05 vs. non-frailty. bP < 0.05 vs. pre-frailty by Tukey’s honest significant difference test. STAI: state-trait anxiety inventory. | ||||
| Kihon Checklist | ||||
| Instrumental activities of daily living | 0.2 ± 0.4 | 0.4 ± 0.8 | 1.5 ± 1.7a, b | < 0.01 |
| Physical function | 0.4 ± 0.7 | 1.3 ± 1.1a | 2.4 ± 1.4a, b | < 0.01 |
| Nutritional status | 0.3 ± 0.5 | 0.6 ± 0.6a | 0.8 ± 0.7a, b | < 0.01 |
| Oral function | 0.2 ± 0.5 | 1.0 ± 0.8a | 1.5 ± 0.9a, b | < 0.01 |
| Social activities | 0.1 ± 0.4 | 0.3 ± 0.5a | 0.8 ± 0.7a, b | < 0.01 |
| Cognitive function | 0.1 ± 0.3 | 0.5 ± 0.6a | 0.8 ± 0.9a, b | < 0.01 |
| Depressive mood | 0.4 ± 0.6 | 1.4 ± 1.2a | 3.0 ± 1.5a, b | < 0.01 |
| STAI | ||||
| State anxiety | 34.9 ± 1.0 | 37.7 ± 0.9 | 41.6 ± 0.9a | < 0.01 |
| Trait anxiety | 35.1 ± 1.1 | 39.2 ± 1.0a | 45.5 ± 0.9a, b | < 0.01 |