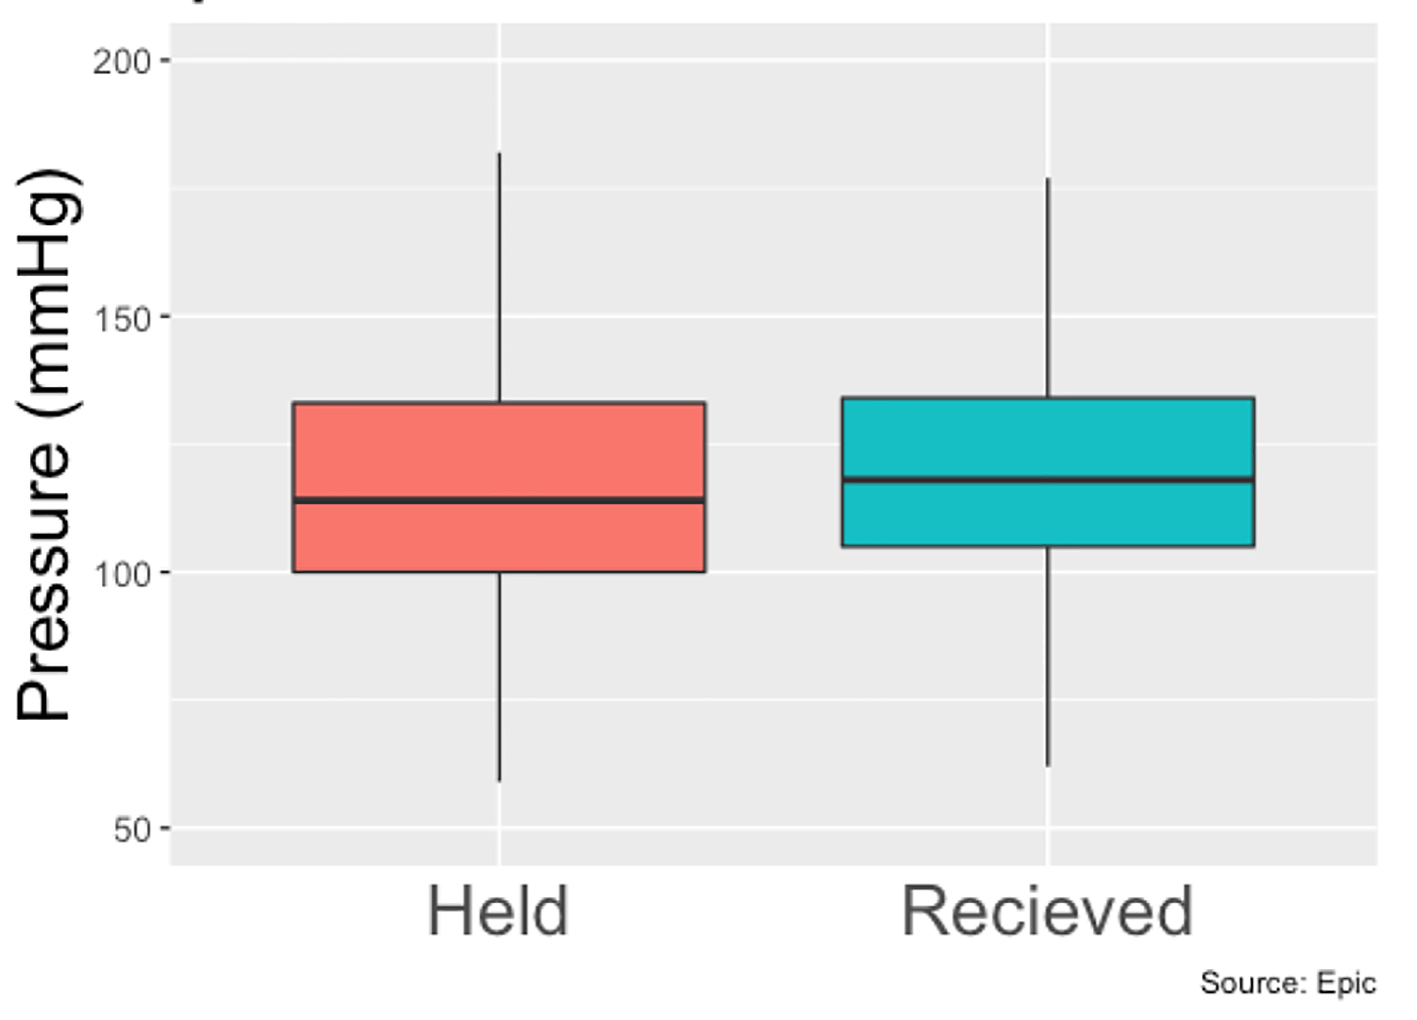
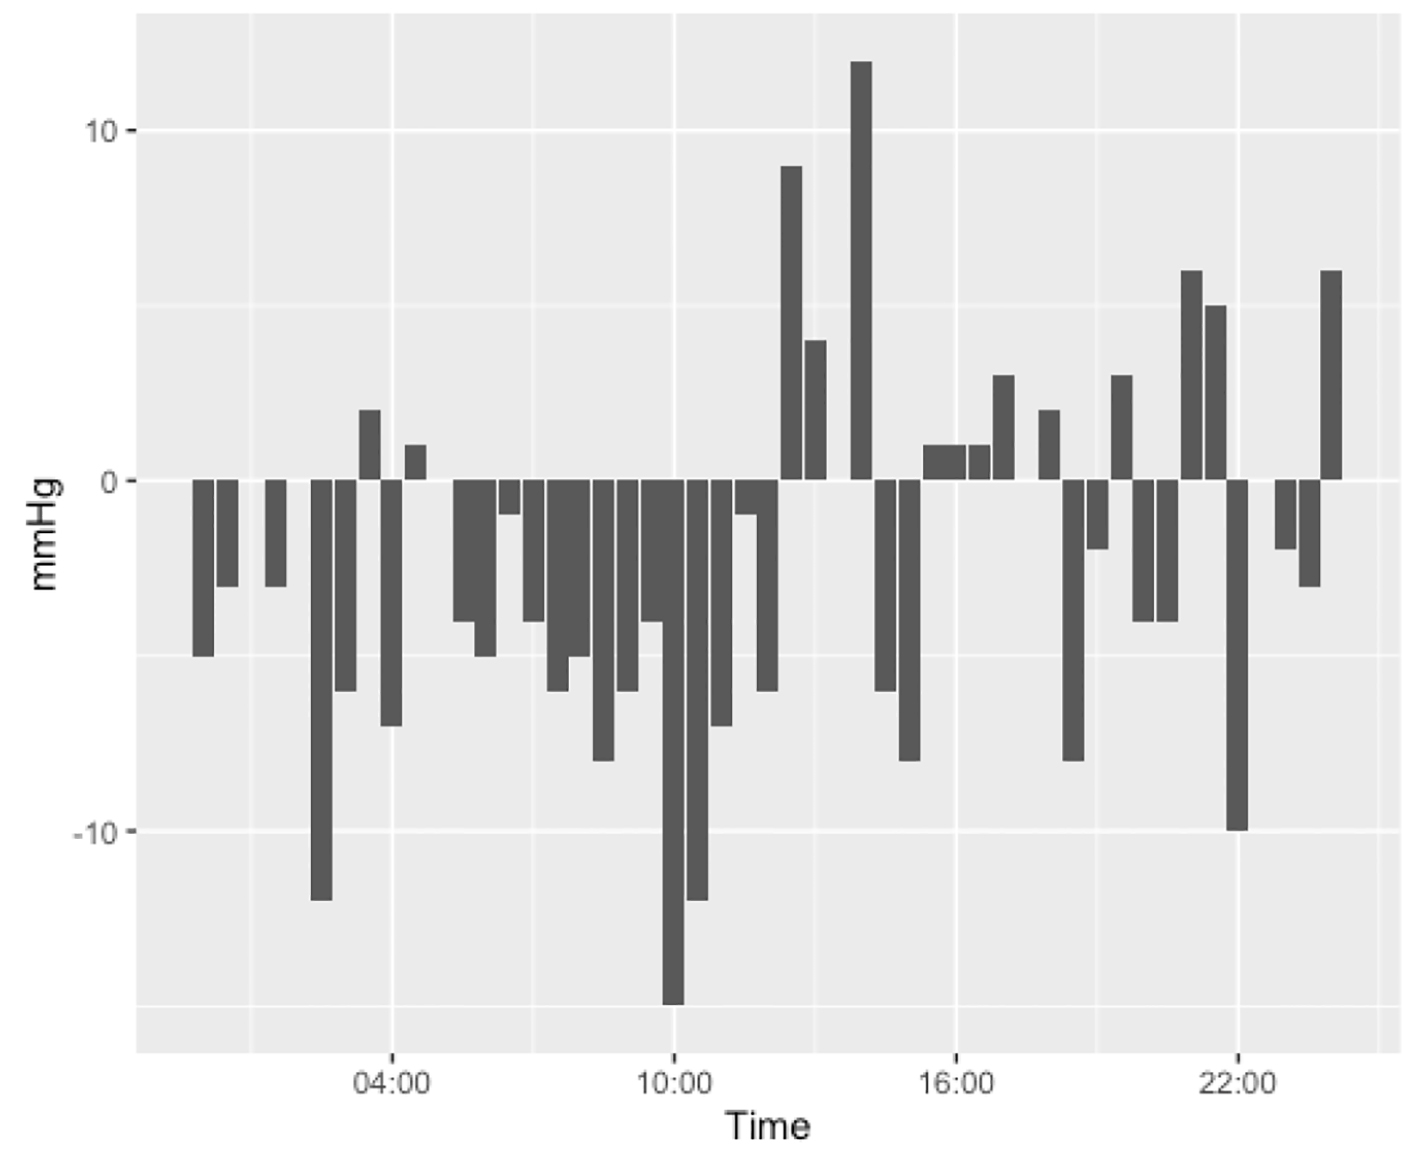
Figure 1. Systolic pressures of patients with held beta-blockers vs. received beta-blockers.
| Cardiology Research, ISSN 1923-2829 print, 1923-2837 online, Open Access |
| Article copyright, the authors; Journal compilation copyright, Cardiol Res and Elmer Press Inc |
| Journal website https://www.cardiologyres.org |
Original Article
Volume 12, Number 1, February 2021, pages 2-9
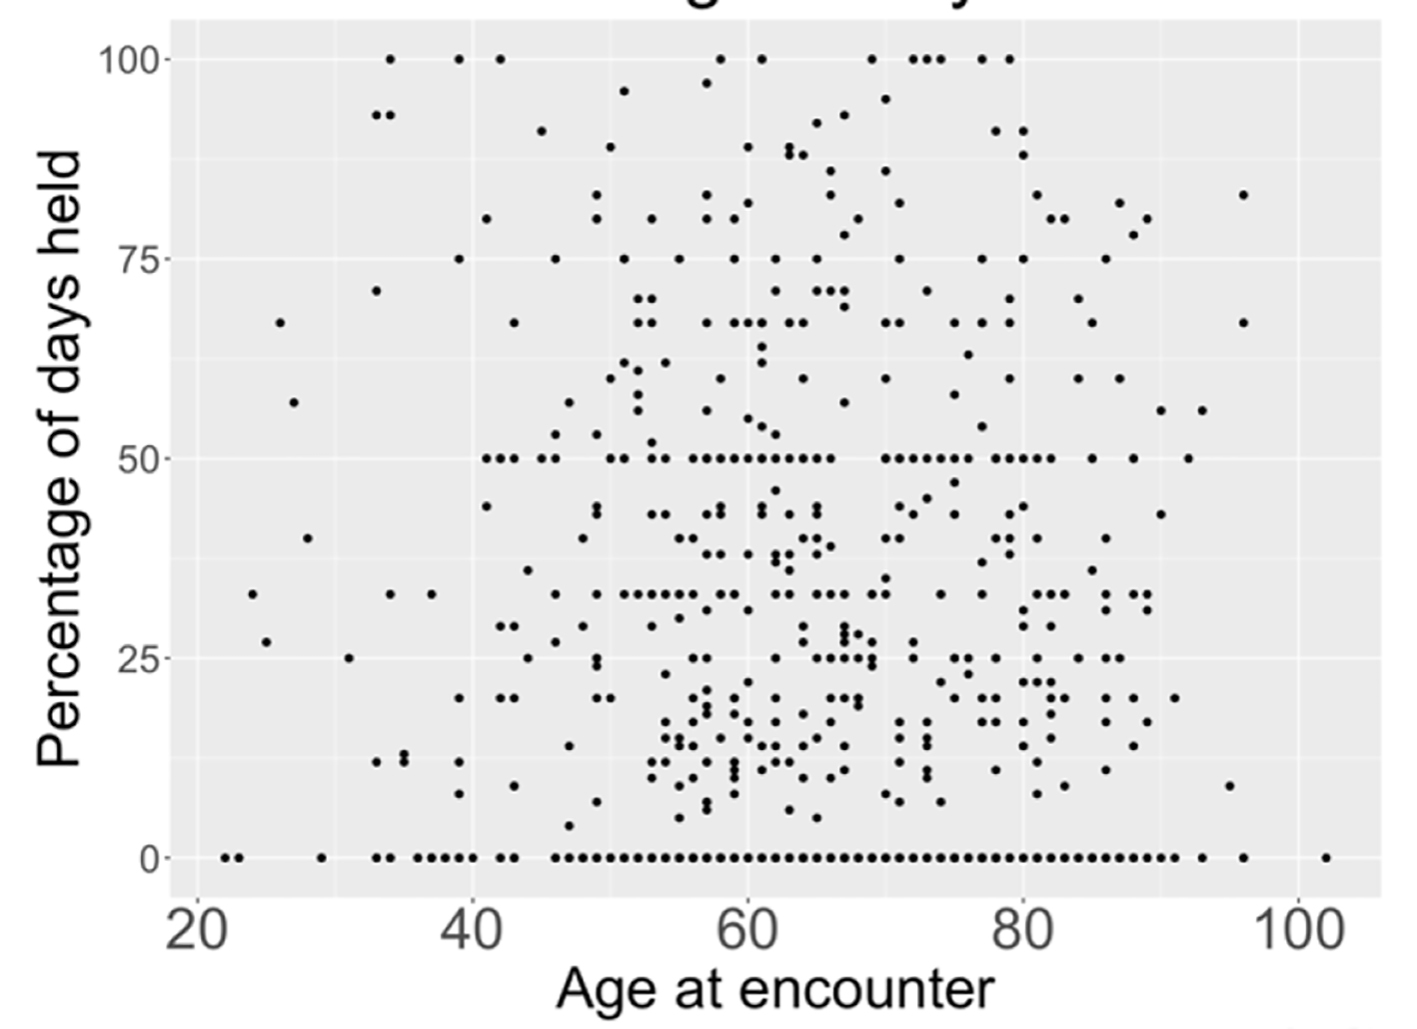
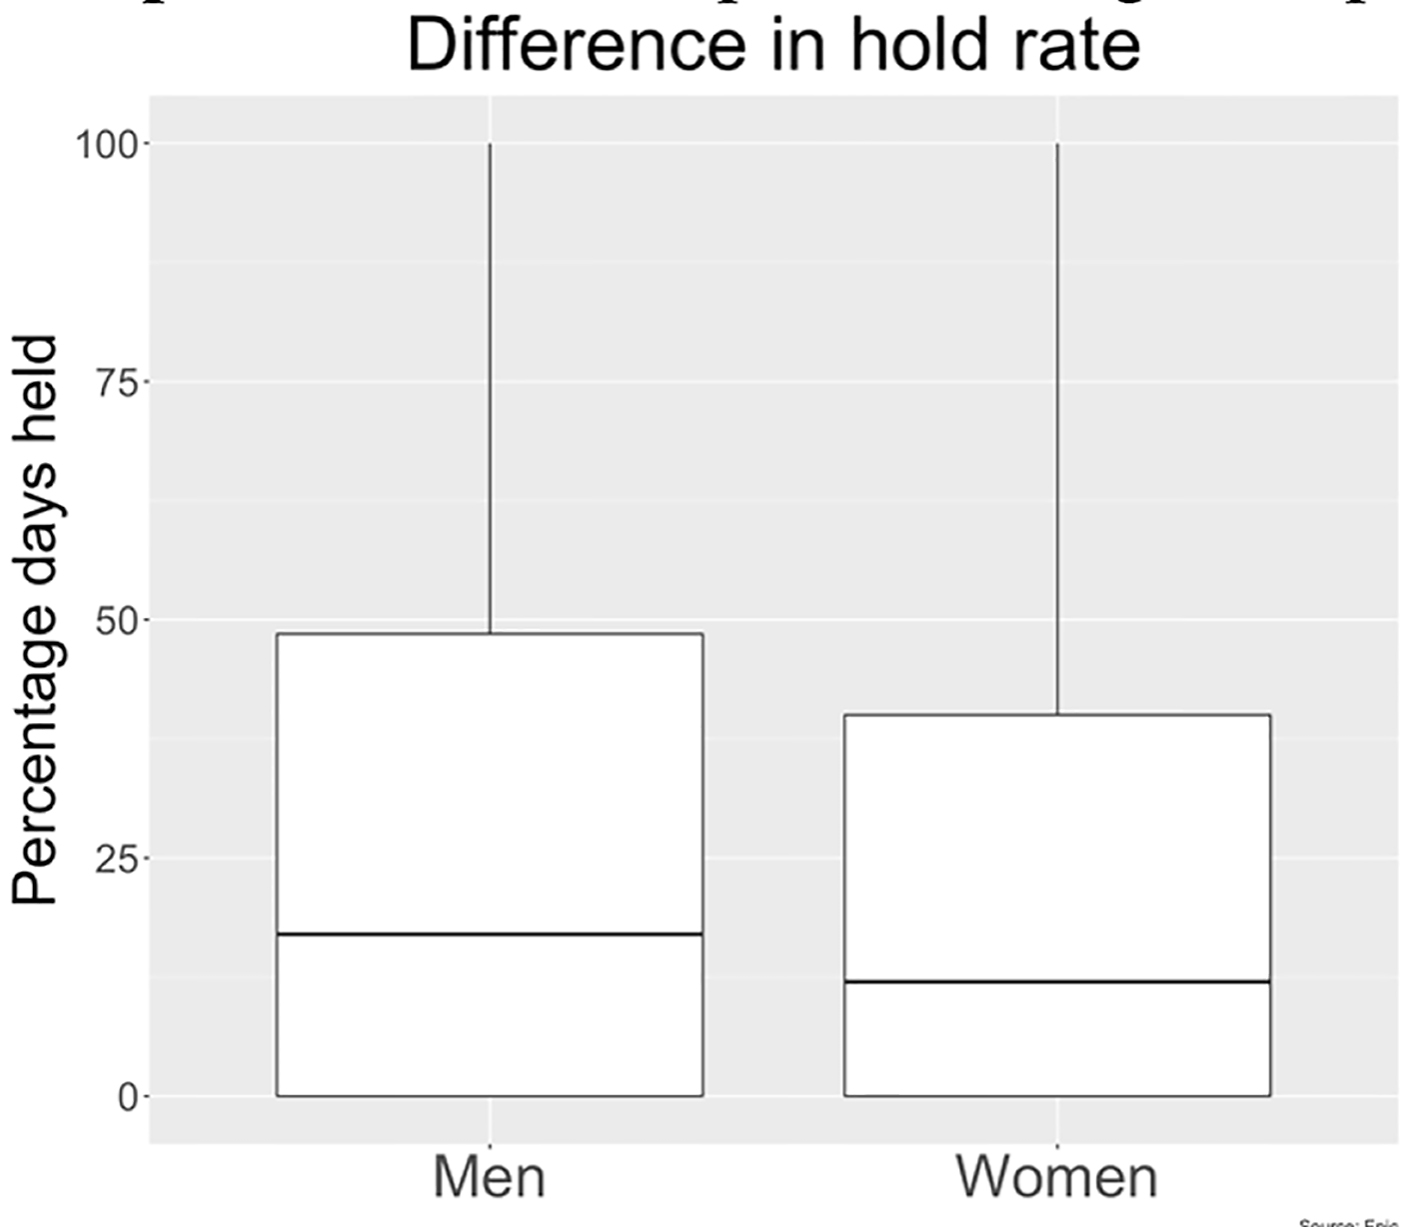
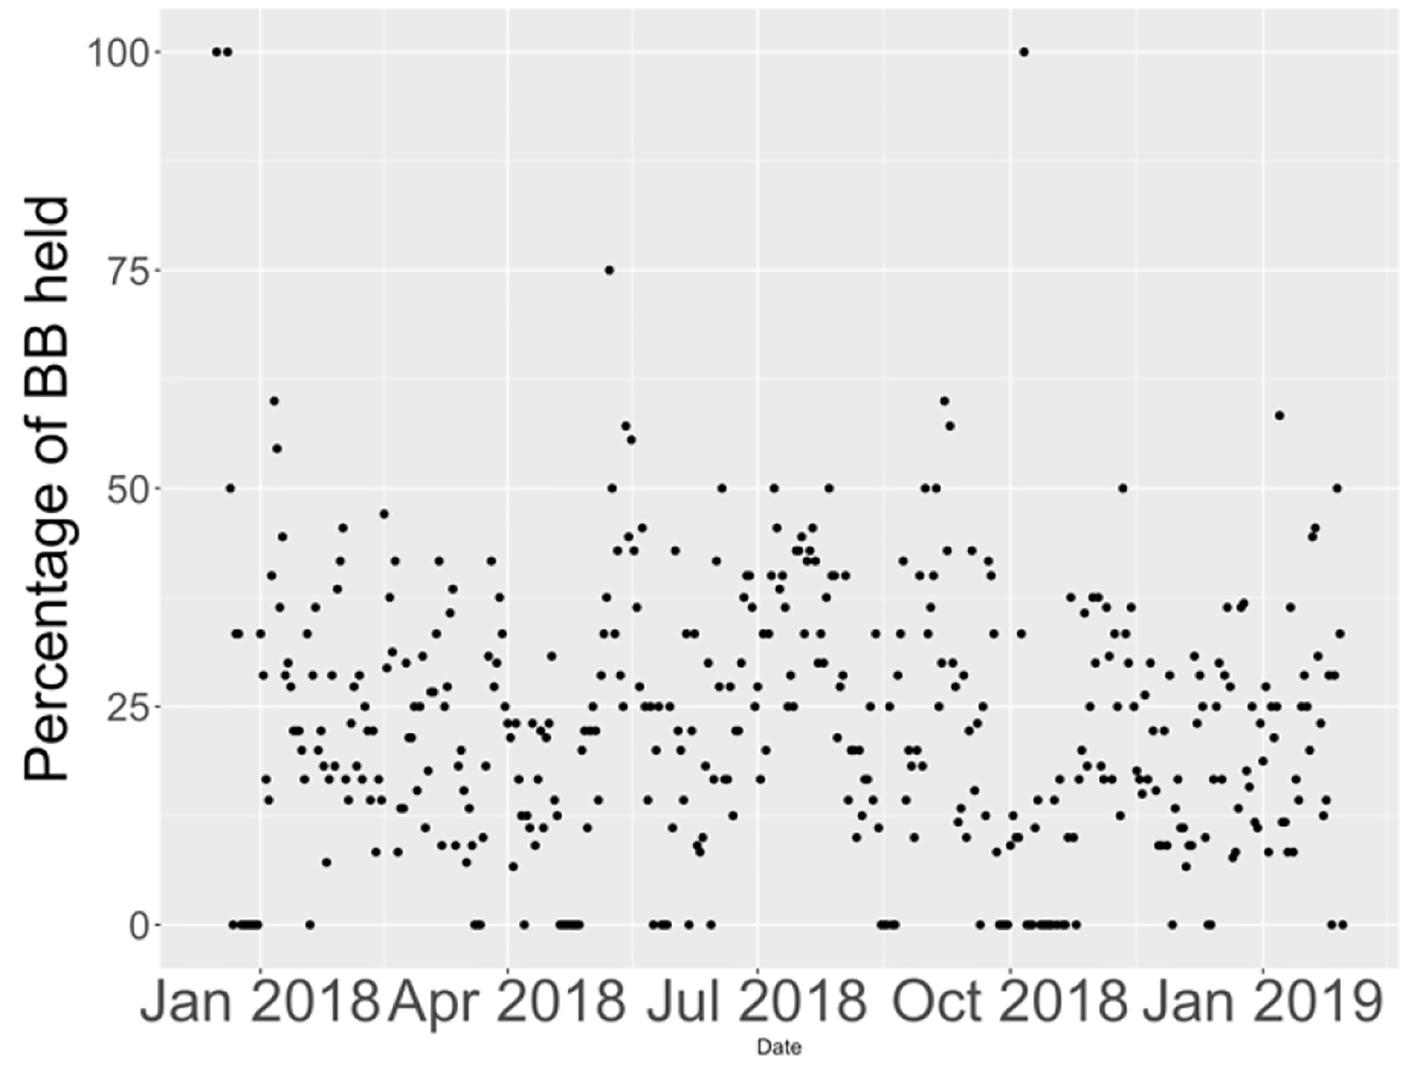
Effects of Holding Beta-Blockers on the Vital Signs of Heart Failure Patients
Figures
Table
| Received | Held | Difference | P value | |
|---|---|---|---|---|
| BP: blood pressure. | ||||
| Systolic BP | 120.8 | 117.7 | -3.1 | < 0.001 |
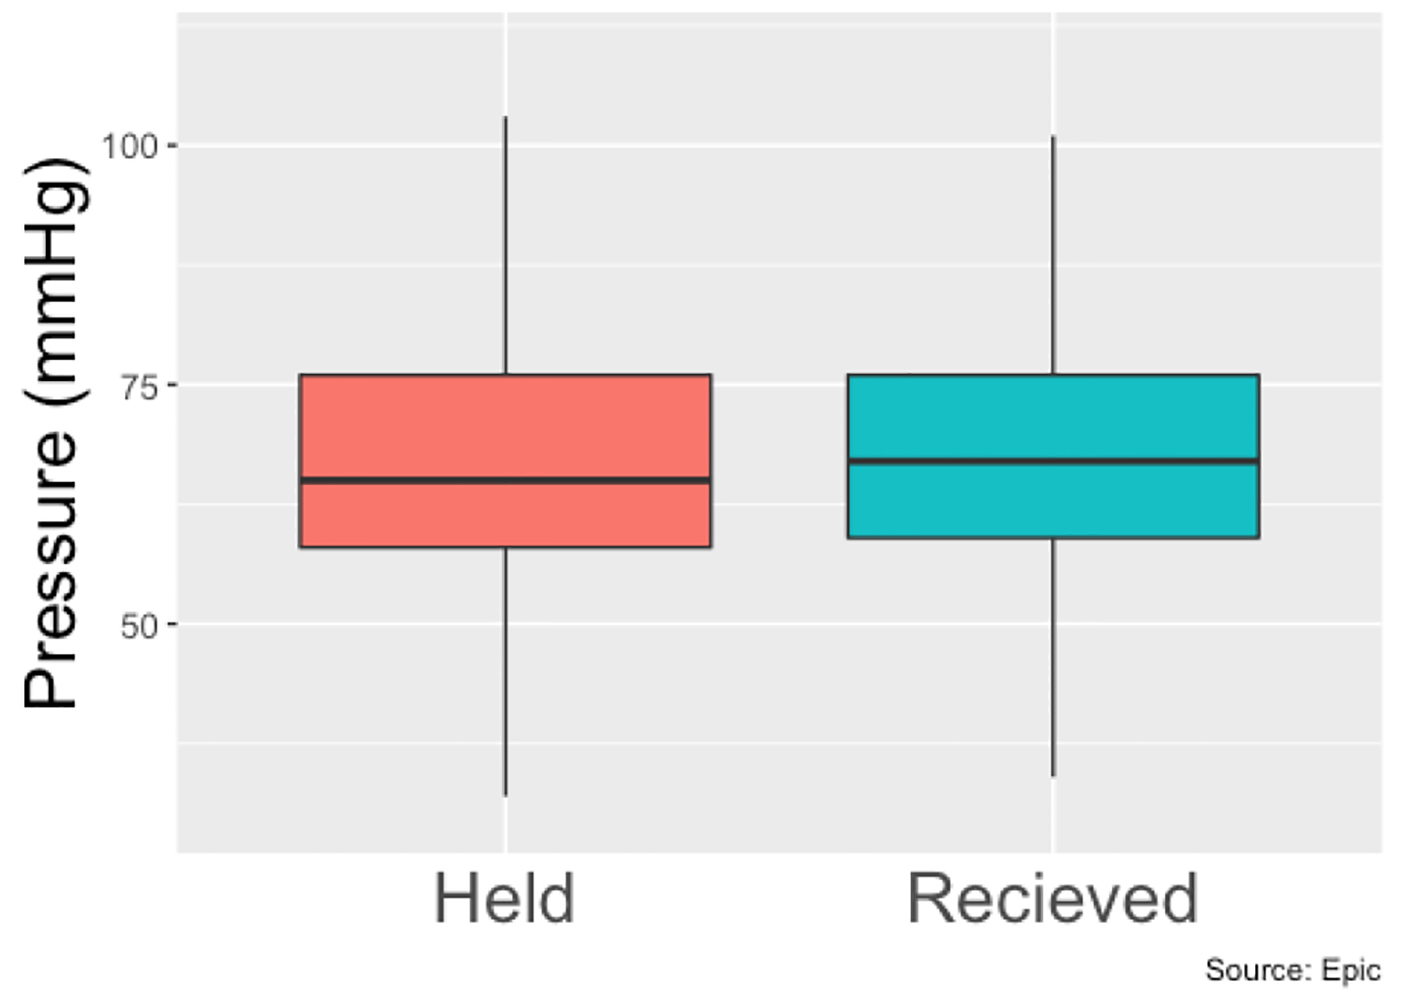
| Diastolic BP | 68.7 | 67.6 | -1.1 | < 0.001 |
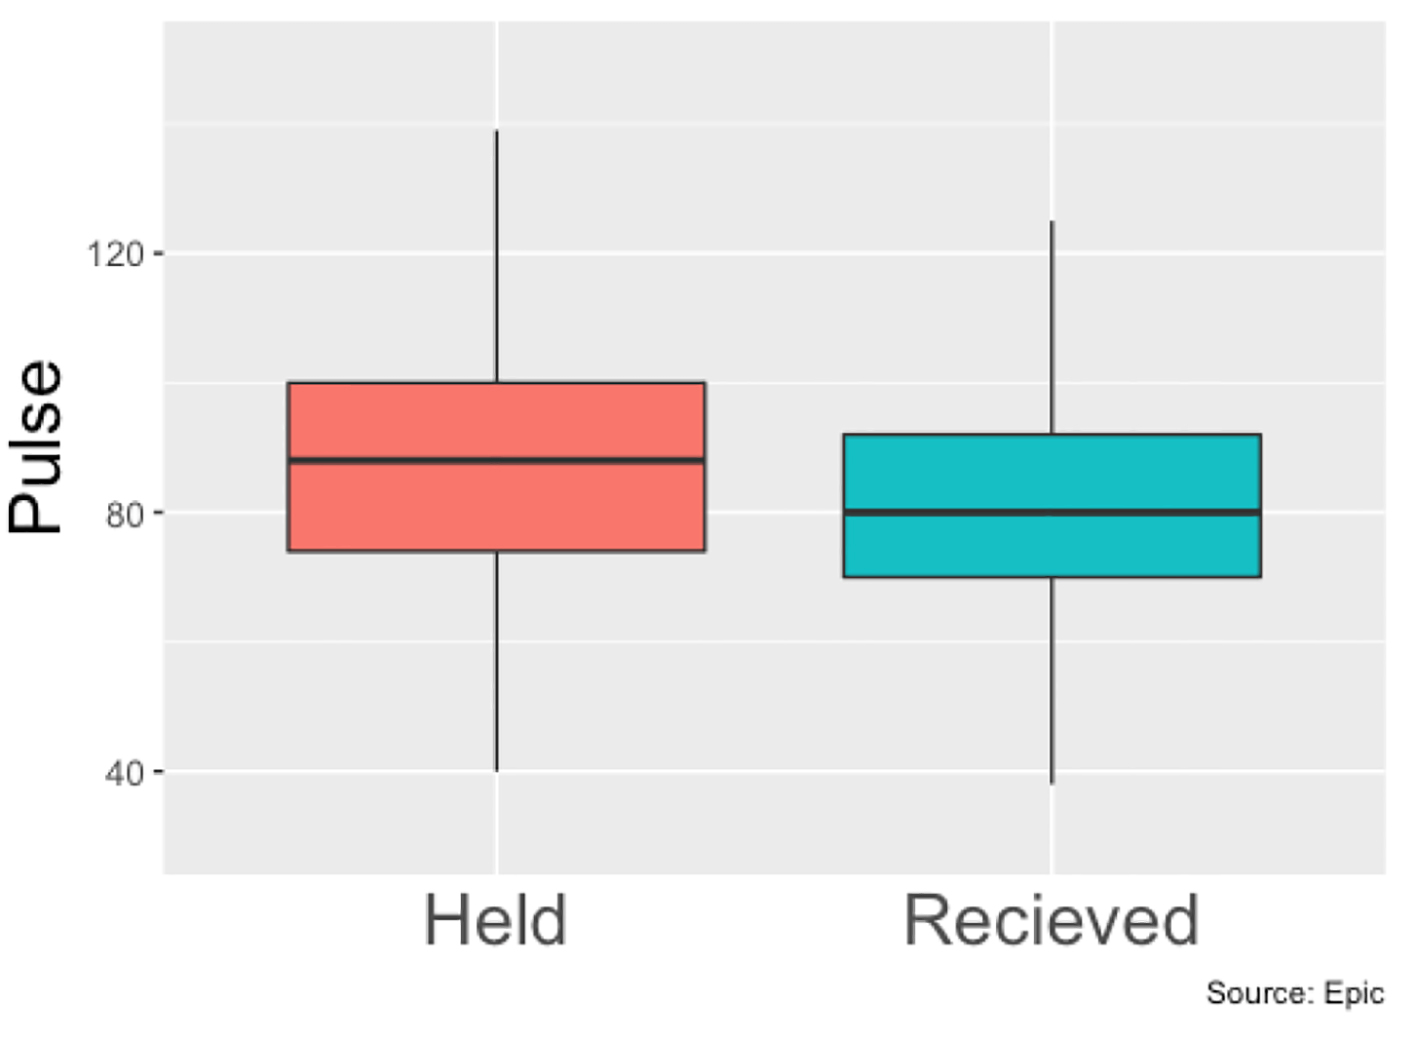
| Heart rate | 82.4 | 88.6 | 6.2 | < 0.001 |