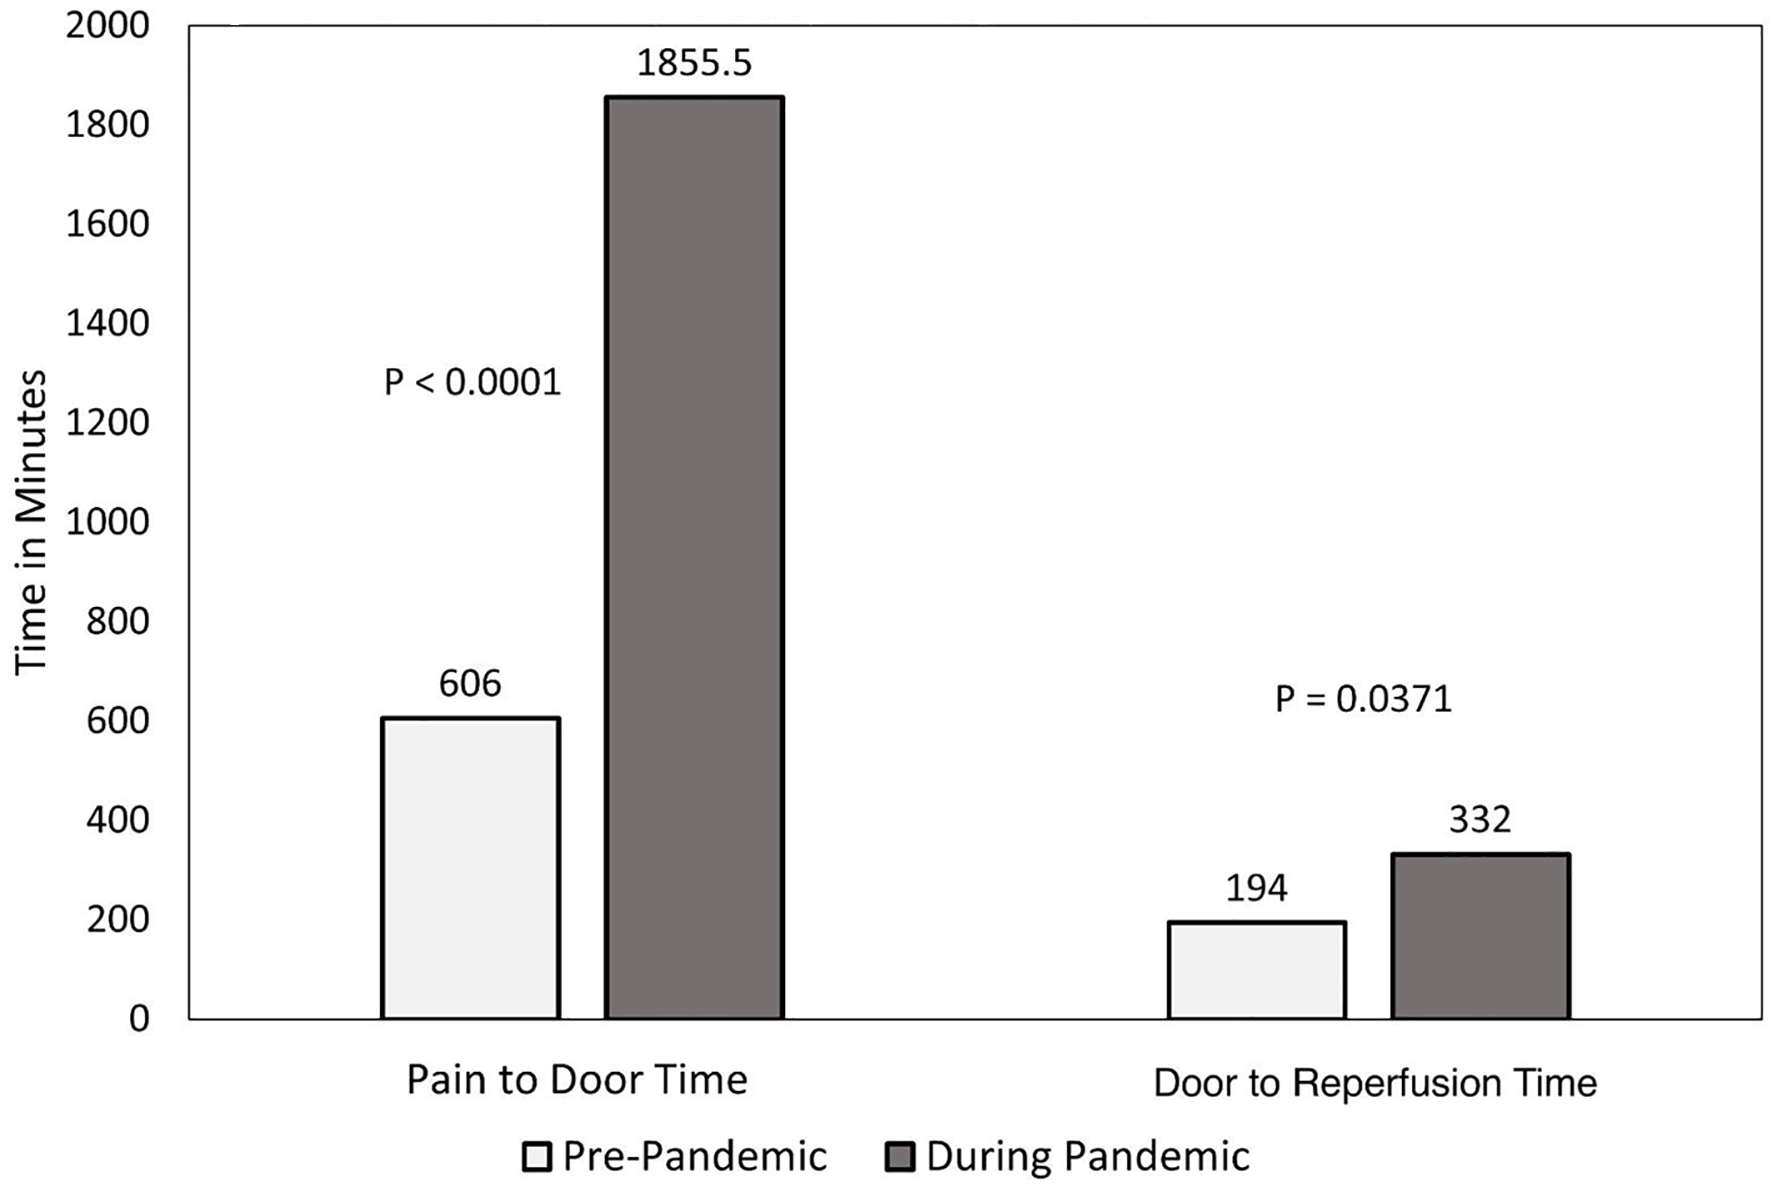
Figure 1. Time delays in patients presenting with NSTEMI. NSTEMI: non-ST-segment elevation myocardial infarction.
| Cardiology Research, ISSN 1923-2829 print, 1923-2837 online, Open Access |
| Article copyright, the authors; Journal compilation copyright, Cardiol Res and Elmer Press Inc |
| Journal website https://www.cardiologyres.org |
Original Article
Volume 11, Number 6, December 2020, pages 386-391
Delays in Presentation in Patients With Acute Myocardial Infarction During the COVID-19 Pandemic
Figures
Tables
| Variable | NSTEMI | STEMI | ||||
|---|---|---|---|---|---|---|
| 2020 (n = 30) | 2019 (n = 62) | P value | 2020 (n = 47) | 2019 (n = 60) | P value | |
| Superscripts indicate missing data in each of the four groups. Hypertension: patients receiving antihypertensive therapy prior to admission or had to be initiated on antihypertensive therapy during hospitalization due to consistently elevated blood pressure of ≥ 140/90 mm Hg. Obesity: body mass index ≥ 30 kg/m2. NSTEMI: non-ST-segment elevation myocardial infarction; STEMI: ST-segment elevation myocardial infarction; PCI: percutaneous coronary intervention. | ||||||
| Male | 22 (73%) | 37 (60%) | 0.2005 | 34 (72%) | 39 (65%) | 0.4183 |
| Age (years) | 70 (64, 80) | 69.5 (60, 79) | 0.5401 | 67 (59, 76) | 68.5 (59, 83) | 0.3179 |
| Obesity | 16 (53%) | 25 (40%) | 0.2392 | 19 (40%) | 20 (33%) | 0.4493 |
| Hypertension (0, 1, 1, 0) | 29 (97%) | 56 (92%) | 0.6594 | 40 (87%) | 54 (90%) | 0.6240 |
| Smoking (1, 1, 1, 0) | 5 (17%) | 11 (18%) | 0.9269 | 10 (22%) | 15 (25%) | 0.6951 |
| Diabetes mellitus (0, 1, 1, 0) | 10 (33%) | 16 (26%) | 0.4807 | 11 (24%) | 11 (18%) | 0.4826 |
| Coronary artery disease | 15 (50%) | 25 (40%) | 0.3801 | 18 (38%) | 17 (28%) | 0.2756 |
| Prior coronary artery bypass grafting (1, 1, 1, 0) | 7 (24%) | 2 (3.3%) | 0.0044 | 3 (6.5%) | 1 (1.7%) | 0.3144 |
| Chronic obstructive pulmonary disease (0, 1, 1, 0) | 0 (0%) | 1 (1.6%) | 1.0000 | 1 (2.2%) | 2 (3.3%) | 1.0000 |
| Peripheral arterial disease (1, 1, 1, 0) | 3 (10%) | 1 (1.6%) | 0.0965 | 0 (0%) | 2 (3.3%) | 0.5040 |
| Cerebrovascular disease (1, 1, 1, 0) | 3 (10%) | 5 (8.2%) | 0.7092 | 4 (8.7%) | 5 (8.3%) | 1.0000 |
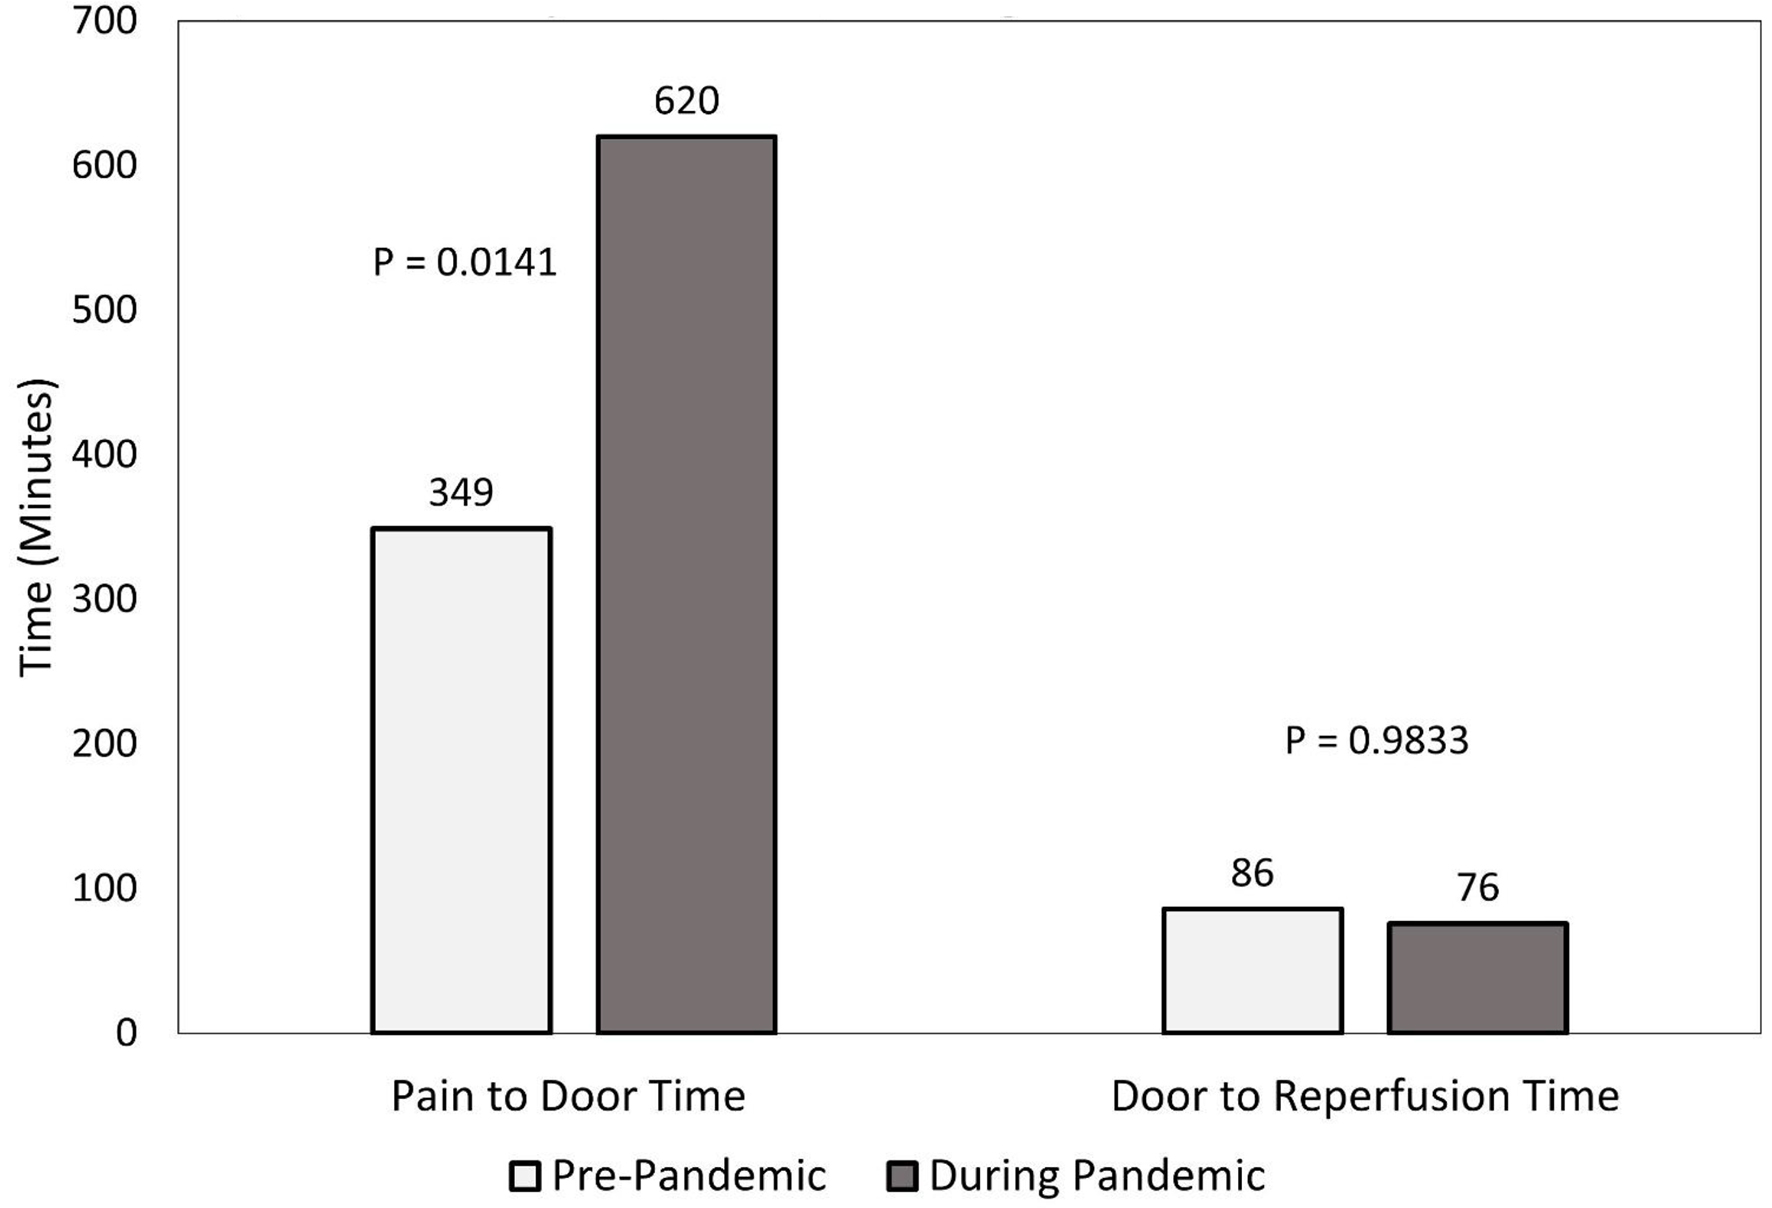
| Pain-to-door time (min) (0, 2, 0, 1) | 1,855 (880, 5,732) | 606 (388, 944) | < 0.0001 | 620 (255, 1,500) | 349 (146, 659) | 0.0141 |
| Door-to-reperfusion time (min) (5, 23, 4, 3) | 332 (182, 581) | 194 (92, 329) | 0.0371 | 76 (64, 113) | 86 (56, 126) | 0.9833 |
| Number of diseased vessels (0, 1, 0, 0) | 2 (2, 3) | 2 (1, 3) | 0.1857 | 2 (1, 3) | 2 (1, 3) | 0.6462 |
| Ejection fraction after PCI (2, 3, 2, 2) | 42.5 (38, 49) | 48 (40, 50) | 0.1235 | 43 (35, 50) | 40 (35, 45) | 0.4401 |
| Reperfusion strategy | 0.1073 | 1.0000 | ||||
| Coronary artery bypass grafting surgery | 2 (7%) | 13 (21%) | 2 (4%) | 2 (3%) | ||
| PCI | 25 (83%) | 38 (61%) | 44 (94%) | 57 (95%) | ||
| Non-obstructive CAD | 3 (10%) | 11 (18%) | 1 (2%) | 1 (2%) | ||
| Angiography access | 0.0001 | 0.8034 | ||||
| Femoral | 10 (33%) | 7 (11%) | 7 (15%) | 10 (17%) | ||
| Right radial | 16 (53%) | 55 (89%) | 40 (85%) | 50 (83%) | ||
| Left proximal radial | 4 (13%) | 0 (0%) | 0 (0%) | 0 (0%) | ||
| Culprit vessel (5, 23, 3, 3) | 0.3404 | 0.0319 | ||||
| Right coronary artery | 4 (16%) | 4 (10%) | 12 (27%) | 14 (25%) | ||
| Left main | 2 (8%) | 10 (26%) | 1 (2.3%) | 12 (21%) | ||
| Left anterior descending | 10 (40%) | 13 (33%) | 26 (59%) | 23 (40%) | ||
| Left circumflex | 9 (36%) | 12 (31%) | 5 (11%) | 8 (14%) | ||
| Right coronary dominance | 26 (87%) | 56 (90%) | 0.7231 | 37 (79%) | 56 (93%) | 0.0261 |
| Outcome | NSTEMI | STEMI | ||||
|---|---|---|---|---|---|---|
| 2020 (n = 30) | 2019 (n = 62) | P value | 2020 (n = 47) | 2019 (n = 60) | P value | |
| Superscripts indicate missing data in each of the four groups. STEMI: ST-segment elevation myocardial infarction; NSTEMI: non-ST-segment elevation myocardial infarction. | ||||||
| In-hospital hemorrhagic stroke (1, 0, 0, 1) | 0 (0%) | 0 (0%) | - | 0 (0%) | 0 (0%) | - |
| In-hospital ischemic stroke (0, 0, 0, 1) | 0 (0%) | 0 (0%) | - | 1 (2.1%) | 0 (0%) | 0.4434 |
| In-hospital cardiopulmonary resuscitation | 2 (6.7%) | 3 (4.8%) | 0.6597 | 2 (4.3%) | 4 (6.7%) | 0.6930 |
| Hypotension requiring vasopressors | 4 (13%) | 5 (8.1%) | 0.4665 | 5 (10.6%) | 6 (10%) | 1.0000 |
| Length of stay (days) | 6 (5, 9) | 5 (4, 7) | 0.3138 | 6 (5, 8) | 7 (5, 8.5) | 0.3222 |
| Inpatient death (0, 0, 1, 0) | 2 (6.7%) | 3 (4.8%) | 0.6597 | 2 (4.3%) | 4 (6.7%) | 0.6955 |