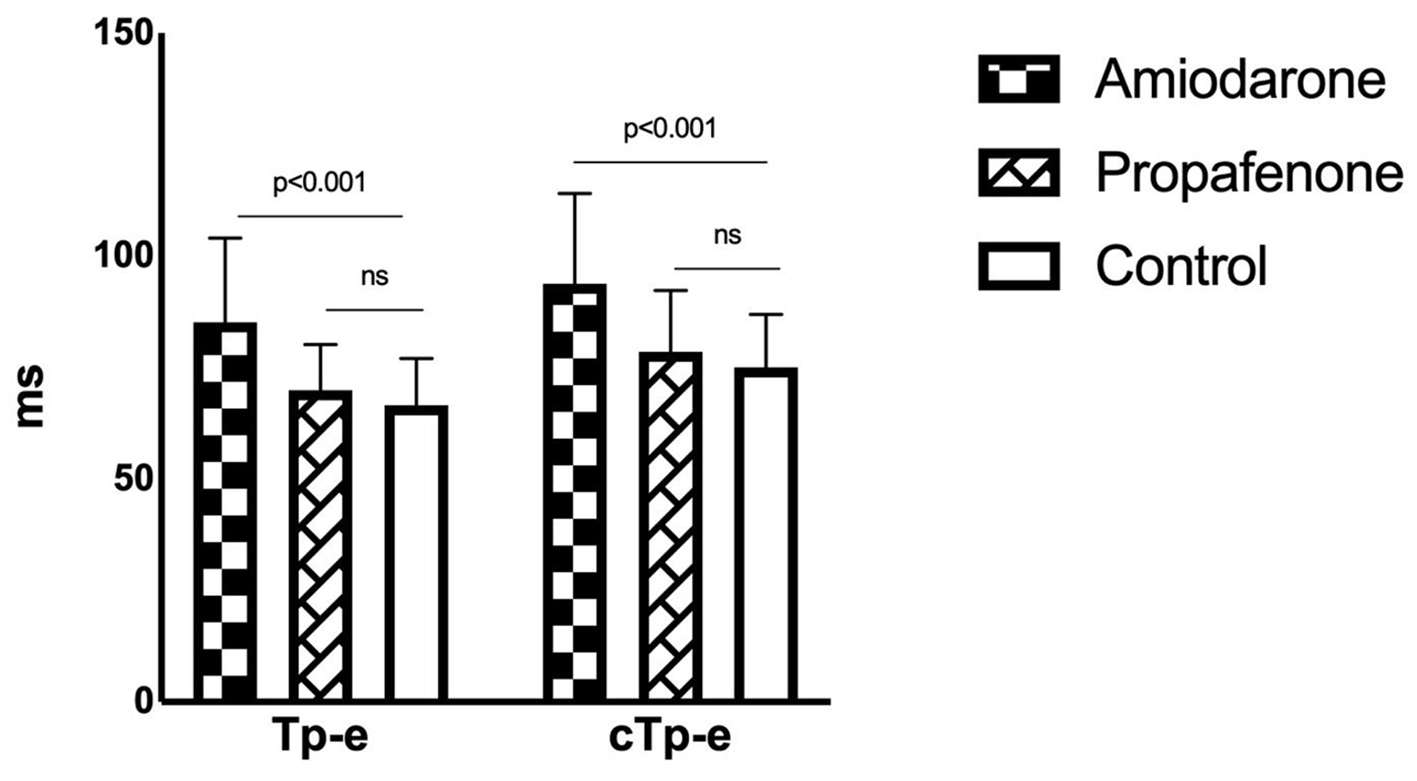
Figure 1. Tp-e and cTp-e intervals in drug and control groups. Tp-e: T wave peak-to-end; cTp-e: corrected Tp-e.
| Cardiology Research, ISSN 1923-2829 print, 1923-2837 online, Open Access |
| Article copyright, the authors; Journal compilation copyright, Cardiol Res and Elmer Press Inc |
| Journal website https://www.cardiologyres.org |
Original Article
Volume 12, Number 1, February 2021, pages 37-46
Evaluation of Index of Cardio-Electrophysiological Balance in Patients With Atrial Fibrillation on Antiarrhythmic-Drug Therapy
Figures
Tables
| Amiodarone (n = 68) | Propafenone (n = 40) | Control (n = 50) | P value | |
|---|---|---|---|---|
| aDepending on the expected count, Pearson Chi-square, Fisher exact or Fisher-Freeman-Halton test was used. Descriptive statistics were presented as number (%). bOne-way ANOVA was used. Descriptive statistics were presented as mean ± standard deviation. cMann-Whitney U test was used. Descriptive statistics were presented as median (IQR). ACE: angiotensin-converting enzyme; ARB: angiotensin receptor blocker; NOAC: new oral anticoagulants; TSH: thyroid-stimulating hormone; IQR: interquartile range. | ||||
| Sex (%) | ||||
| Female, n (%) | 30 (44.1) | 21 (52.5) | 26 (52.0) | 0.600a |
| Male, n (%) | 38 (55.9) | 19 (47.5) | 24 (48.0) | |
| Age (years) | 65.3 ± 7.3 | 62.9 ± 5.5 | 62.7 ± 4.4 | 0.051b |
| Smoking (%) | 16 (23.5) | 6 (15.0) | 8 (16.0) | 0.445a |
| Duration of drug use (median (IQR)) | 20.5 (16.0 - 29.0) | 19.0 (13.8 - 23.0) | - | 0.034c |
| Type of atrial fibrillation | ||||
| Paroxysmal | 57 (83.8) | 34 (85) | - | 0.087a |
| Persistent | 11 (16.2) | 6 (15) | - | 0.088a |
| Comorbidities | ||||
| Heart failure (%) | ||||
| Ischemic heart failure | 25 (36.8) | 0 (0.0) | - | < 0.001a |
| Non-ischemic heart failure | 10 (14.7) | 1 (2.5) | - | 0.043a |
| Hypertension (%) | 48 (70.6) | 20 (50.0) | - | 0.053a |
| Coronary artery disease (%) | 38 (55.9) | 8 (20.0) | - | 0.001a |
| Stroke (%) | 12 (17.6) | 1 (2.5) | - | 0.029a |
| Diabetes mellitus (%) | 23 (33.8) | 15 (37.5) | - | 0.859a |
| Concurrent medication use | ||||
| Beta-blocker (%) | 55 (80.9) | 37 (92.5) | - | 0.174a |
| Calcium channel blocker (%) | 7 (10.3) | 3 (7.5) | - | 0.742a |
| ACE inhibitor/ARB (%) | 59 (86.8) | 22 (55.0) | - | 0.001a |
| Spironolactone (%) | 13 (19.1) | 0 (0.0) | - | 0.002a |
| NOAC (%) | 30 (44.1) | 16 (40) | - | 0.676a |
| Warfarin (%) | 14 (20) | 5 (12) | - | 0.286a |
| Aspirin (%) | 20 (29) | 9 (22.0) | - | 0.434a |
| Clopidogrel (%) | 6 (8.8) | 2 (5) | - | 0.707a |
| Laboratory parameters | ||||
| Serum calcium (mg/dL) | 9.5 ± 0.6 | 9.8 ± 0.5 | 9.7 ± 0.5 | 0.158b |
| Serum potassium (mEq/L) | 4.2 ± 0.3 | 4.2 ± 0.3 | 4.2 ± 0.3 | 0.783b |
| Aspartate aminotransferase (U/L) | 22.2 ± 5.3 | 24.7 ± 5.8 | 23.9 ± 6.6 | 0.068b |
| Alanine aminotransferase (U/L) | 23.3 ± 6.2 | 25.0 ± 5.9 | 24.0 ± 7.2 | 0.374b |
| TSH (µU/mL) (median (IQR)) | 2.4 (1.6 - 3.5) | 2.5 (1.9 - 3.5) | 2.3 (1.7 - 3.1) | 0.493 |
| Risk score | ||||
| CHA2DS2-VASc score (median (IQR)) | 3.0 (2.8 - 4.0) | 2.0 (1.0 - 3.0) | - | < 0.001c |
| Amiodarone (n = 68) | Propafenone (n = 40) | Control (n = 50) | P value | |
|---|---|---|---|---|
| *Depending on the expected count, Pearson Chi-square, Fisher exact or Fisher-Freeman-Halton test was used. Descriptive statistics were presented as number (%). Multiple comparisons were marked with superscript letters in the table. As same letters notify no significant difference between the groups, different letters mean a significant difference between the groups. Tp-e: T wave peak-to-end; iCEB: index of cardio-electrophysiological balance; iCEBc: corrected iCEB; LVEF: left ventricular ejection fraction; LA: left atrial; IVS: interventricular septum; PW: posterior wall; VT: ventricular tachycardia; TdP: torsades de pointes; Tp-e: transmural dispersion of repolarisation; cTp-e: corrected Tp-e. | ||||
| Echocardiographic parameters | ||||
| Heart rate (beat per minute) | 72.1 ± 10.8 | 73.0 ± 11.4 | 75.8 ± 13.3 | 0.278 |
| QRS (ms) | 94.8 ± 13.0a | 100.5 ± 13.2b | 90.7 ± 6.7a | < 0.001 |
| QT interval (ms) | 412.1 ± 37.0a | 384.1 ± 30.7b | 377.5 ± 26.8b | < 0.001 |
| QTc interval (ms) | 450.1 ± 27.5a | 421.8 ± 25.3b | 412.1 ± 23.6b | < 0.001 |
| Tp-e interval (ms) | 85.2 ± 18.9a | 69.9 ± 10.3b | 66.5 ± 10.6b | < 0.001 |
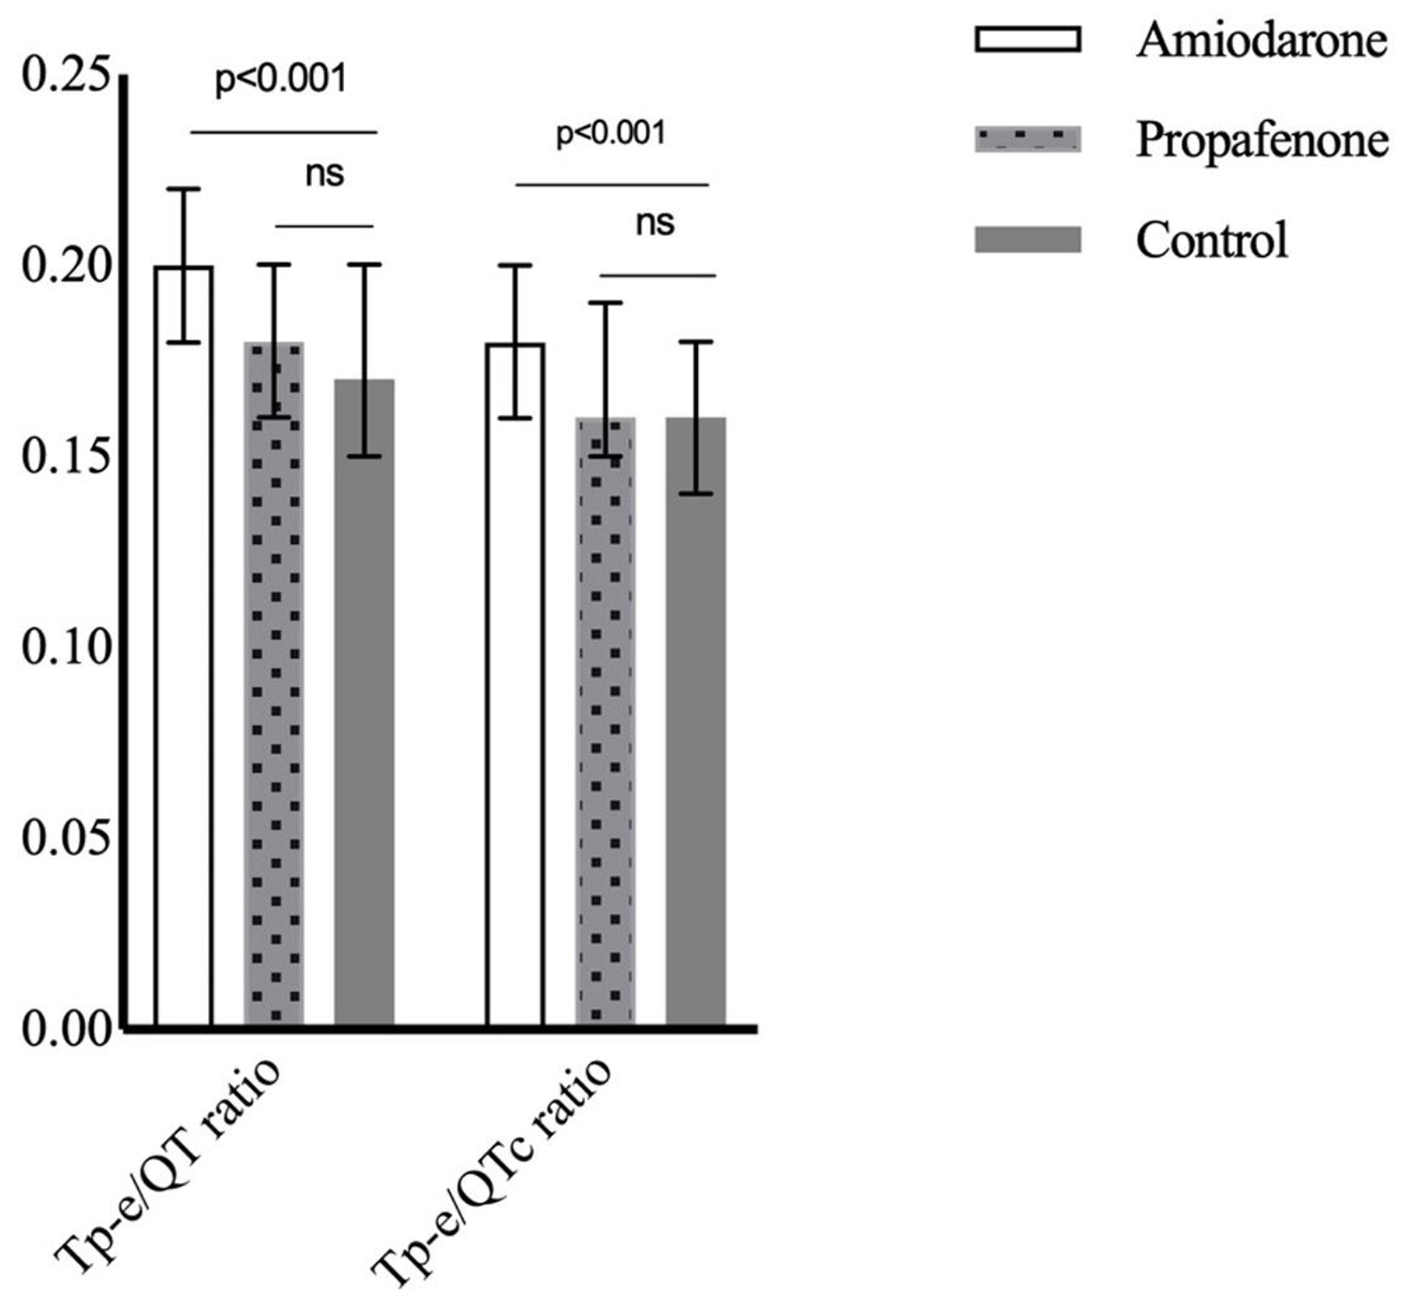
| Tp-e/QT ratio | 0.20 (0.18 - 0.22)a | 0.18 (0.16 - 0.20)b | 0.17 (0.15 - 0.20)b | < 0.001 |
| cTp-e interval (ms) | 93.8 ± 20.3a | 78.6 ± 13.7b | 75.1 ± 11.8b | < 0.001 |
| Tp-e/QTc ratio | 0.18 (0.16 - 0.20)a | 0.16 (0.15 - 0.19)b | 0.16 (0.14 - 0.18)b | < 0.001 |
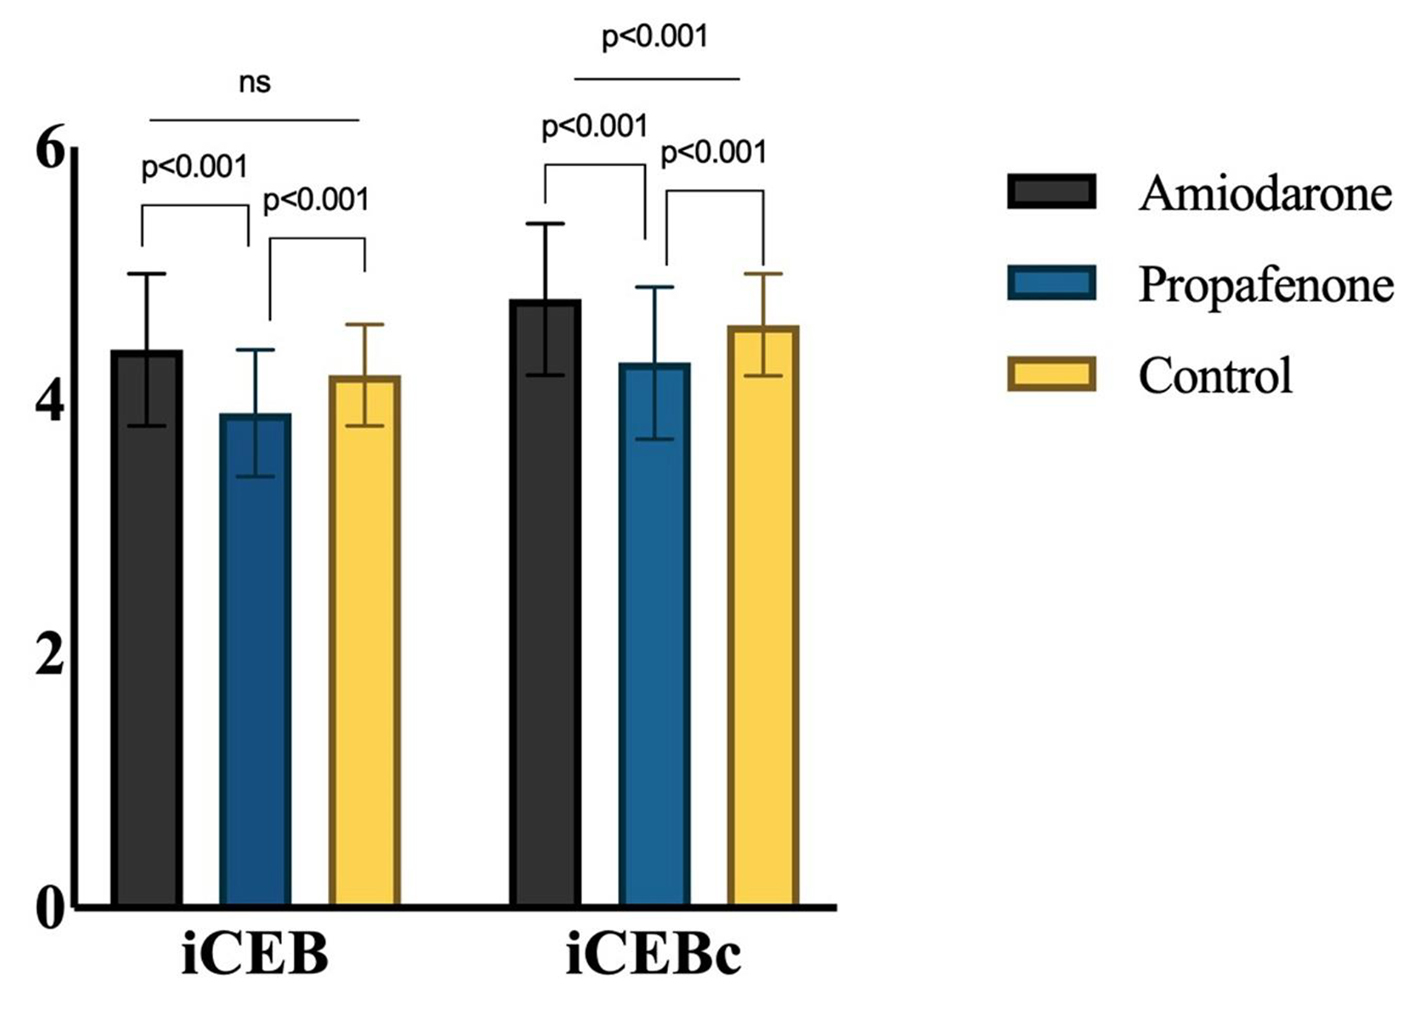
| iCEB | 4.4 ± 0.6a | 3.9 ± 0.5b | 4.2 ± 0.4a | < 0.001 |
| iCEBc | 4.8 ± 0.6a | 4.3 ± 0.6b | 4.6 ± 0.4c | < 0.001 |
| Echocardiography parameters | ||||
| LVEF (median (IQR)) (%) | 50.0 (35.0 - 55.0)a | 55.0 (53.0 - 55.0)b | 56.0 (55.0 - 60.0)b | < 0.001 |
| LA diameter (cm) | 4.6 ± 0.6a | 4.0 ± 0.3b | 3.7 ± 0.3c | < 0.001 |
| IVS thickness (mm) | 11.7 ± 1.1a | 11.0 ± 0.8a | 10.1 ± 1.0b | < 0.001 |
| PW thickness (mm) | 10.6 ± 1.1a | 10.1 ± 1.0a | 9.0 ± 1.0b | < 0.001 |
| Advers events | ||||
| TdP (%) | 1 (1.5) | 0 (0.0) | - | 0.999* |
| Non-sustained VT (%) | 0 (0.0) | 1 (2.5) | - | 0.370* |
| Atrial fibrillation (n = 108) | Control (n = 50) | P value | |
|---|---|---|---|
| iCEB: index of cardio-electrophysiological balance; iCEBc: corrected iCEB; LVEF: left ventricular ejection fraction; LA: left atrial; Tp-e: T wave peak-to-end; cTp-e: corrected Tp-e. | |||
| Sex (%) | 0.698 | ||
| Female, n (%) | 51 (47.2) | 26 (52.0) | |
| Male, n (%) | 57 (52.8) | 24 (48.0) | |
| Age (years) | 64.4 ± 6.7 | 62.7 ± 4.4 | 0.112 |
| Smoking (%) | 22 (20.4) | 8 (16.0) | 0.515 |
| Electrocardiographic parameters | |||
| Heart rate (beats per minute) | 72.4 ± 10.9 | 75.8 ± 13.3 | 0.121 |
| QRS (ms) | 96.9 ± 13.3 | 90.7 ± 6.7 | < 0.001 |
| QT interval (ms) | 401.7 ± 37.2 | 377.5 ± 26.8 | < 0.001 |
| QTc interval (ms) | 439.6 ± 29.9 | 412.1 ± 23.6 | < 0.001 |
| Tp-e interval (ms) | 79.5 ± 17.8 | 66.5 ± 10.6 | < 0.001 |
| cTp-e interval (ms) | 88.2 ± 19.5 | 75.1 ± 11.8 | < 0.001 |
| Tp-e/QT ratio | 0.20 (0.17 - 0.22) | 0.17 (0.15 - 0.20) | 0.001 |
| Tp-e/QTc ratio | 0.18 (0.15 - 0.19) | 0.16 (0.14 - 0.18) | 0.001 |
| iCEB | 4.2 ± 0.6 | 4.2 ± 0.4 | 0.740 |
| iCEBc | 4.6 ± 0.7 | 4.6 ± 0.4 | 0.602 |
| Echocardiography parameters | |||
| LVEF (median (IQR)) (%) | 54.0 (44.5 - 55.0) | 56.0 (55.0 - 60.0) | < 0.001 |
| LA diameter (cm) | 4.4 ± 0.6 | 3.7 ± 0.3 | < 0.001 |