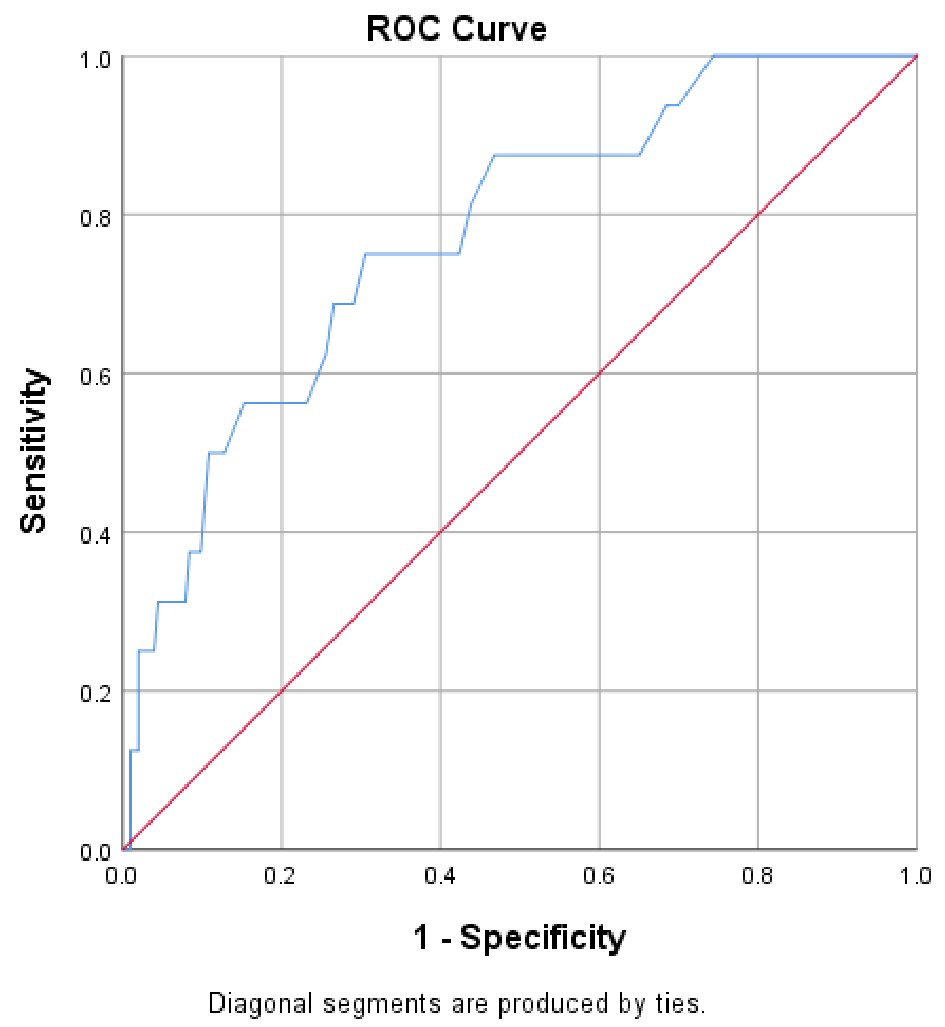
Figure 1. Receiver operating characteristic curve of AASI for the prediction of major adverse cardiac events (MACEs).
| Cardiology Research, ISSN 1923-2829 print, 1923-2837 online, Open Access |
| Article copyright, the authors; Journal compilation copyright, Cardiol Res and Elmer Press Inc |
| Journal website https://www.cardiologyres.org |
Original Article
Volume 12, Number 3, June 2021, pages 161-168
The Relationship Between Ambulatory Arterial Stiffness Index and Cardiovascular Outcomes in Women
Figures
Tables
| Characteristic | Full cohort | No MACE | MACE | P value |
|---|---|---|---|---|
| MACE: major adverse cardiovascular event; TIA: transient ischemic attack; ACE-I: angiotensin-converting enzyme inhibitor; ARB: angiotensin II receptor blocker; HDL: high-density lipoprotein; HbA1c: glycated hemoglobin. P values refer to the results of comparison between the MACE and non-MACE groups only. | ||||
| Number | 219 | 203 | 16 | |
| Age | 57.4 ± 13.3 | 57.0 ± 13.50 | 63.50 ± 10.4 | 0.047 |
| Body mass, kg | 76.6 ± 17.9 | 81.80 ± 22.23 | 81.0 ± 22.8 | 0.32 |
| Body mass index, kg/m2 | 29.2 ± 6.7 | 29.1 ± 6.6 | 31.1 ± 7.6 | 0.26 |
| Caucasian | 213 (97.3%) | 197(97.0%) | 15 (100%) | 0.99 |
| Ischemic heart disease | 24 (4.4%) | 21 (10.3%) | 3 (18.8%) | 0.39 |
| Diabetes mellitus | 27 (12.3%) | 20 (9.8%) | 8 (50.0%) | 0.0002 |
| Previous stroke or TIA | 11 (5.0%) | 9 (4.4%) | 2 (12.5%) | 0.19 |
| Heart failure | 7 (3.2%) | 5 (2.5%) | 2 (12.5%) | 0.09 |
| Peripheral vascular disease | 4 (1.8%) | 1 (0.5%) | 3 (20%) | 0.001 |
| Hypertension | 146 (66.7%) | 132 (65.0%) | 14 (87.5%) | 0.10 |
| Smoking status | ||||
| Current/ex | 85 (40.7%) | 85(41.9%) | 4 (25%) | 0.49 |
| Never | 130 (59.3%) | 118 (58.1% | 12 (75%) | |
| Medication | ||||
| ACE-I/ARB | 102 (46.6%) | 92 (45.3%) | 10 (62.5%) | 0.20 |
| Calcium channel blocker | 80 (36.5%) | 72 (35.5%) | 8 (50.0%) | 0.28 |
| Beta blockers | 51 (23.3%) | 45 (22.2%) | 6 (37.5%) | 0.22 |
| Diuretics | 36 (16.4%) | 32 (15.8%) | 4 (25.0%) | 0.31 |
| Alpha blockers | 20 (9.1%) | 16 (7.9%) | 4 (25.0%) | 0.045 |
| Statins | 63 (28.8%) | 54 (26.6%) | 9 (56.3%) | 0.02 |
| Aldosterone antagonists | 8 (3.7%) | 8 (3.9%) | 0 (0%) | 0.99 |
| Ejection fraction, % | 60.4 ± 9.32 | 60.4 ± 9.5 | 60.8 ± 7.3 | 0.88 |
| Hemoglobin g/L | 136.1 ± 12.8 | 136.3 ± 12.9 | 132.5 ± 11.7 | 0.26 |
| Estimated glomerular filtration rate, mL/min/1.73m2 | 70.8 ± 15.5 | 71.4 ± 14.9 | 63.0 ± 20.4 | 0.037 |
| Total cholesterol, mmol/L | 5.1 ± 1.1 | 5.1 ± 1.1 | 4.8 ± 1.4 | 0.34 |
| HDL cholesterol, mmol/L | 1.7 ± 0.5 | 1.7 ± 0.5 | 1.3 ± 0.3 | 0.001 |
| Triglycerides, mmol/L | 1.5 ± 0.9 | 1.5 ± 0.9 | 1.7 ± 0.9 | 0.25 |
| HbA1c | 42.0 ± 14.0 | 41.3 ± 12.4 | 49.9 ± 26.1 | 0.44 |
| Characteristic | Full cohort | No MACE | MACE | P value |
|---|---|---|---|---|
| ABPM: ambulatory blood pressure monitoring; MACE: major adverse cardiovascular event; TIA: transient ischemic attack; ACE-I: angiotensin converting enzyme inhibitor; ARB: angiotensin II receptor blocker; HDL: high-density lipoprotein. P value refers to difference between MACE and non-MACE groups only. | ||||
| Number of readings | 29.5 ± 3.7 | 27.1 ± 5.3 | 26.8 ± 5.3 | 0.15 |
| 24-h ABPM averages | ||||
| Systolic blood pressure dip, mm Hg | 9.6 (4.2 - 14.1) | 9.6 (4.8 - 14.1) | 7.5 (0.44 - 15.1) | 0.16 |
| Diastolic blood pressure dip, mm Hg | 14.1 (8.7 - 19.4) | 14.1 (8.9 - 20.1) | 9.2 (4.9 - 17.8) | 0.09 |
| Mean arterial blood pressure dip, mm Hg | 11.1 (5.8 - 16.4) | 11.3 (6.1 - 16.6) | 8.5 (1.8 - 14.2) | 0.10 |
| Systolic blood pressure, mm Hg | 132.6 ± 16.9 | 132.3 ± 16.9 | 137.3 ± 17.4 | 0.12 |
| Diastolic blood pressure, mm Hg | 76.6 ± 10.8 | 76.9 ± 10.9 | 73.4 ± 8.8 | 0.15 |
| Mean arterial pressure, mm Hg | 96.3 ± 11.2 | 96.3 ± 11.4 | 96.4 ± 9.2 | 0.86 |
| Pulse pressure, mm Hg | 56.2 ± 14.0 | 55.5 ± 13.5 | 64.2 ± 17.7 | 0.02 |
| Day-time averages | ||||
| Systolic blood pressure, mm Hg | 135.8 ± 16.7 | 135.5 ± 16.7 | 139.8 ± 16.8 | 0.16 |
| Diastolic blood pressure, mm Hg | 79.2 ± 10.9 | 79.6 ± 11.1 | 75.2 ± 8.0 | 0.13 |
| Mean arterial pressure, mm Hg | 99.0 ± 11.2 | 99.1 ± 11.4 | 998.3 ± 8.3 | 0.80 |
| Pulse pressure, mm Hg | 56.6 ± 14.1 | 56.0 ± 13.6 | 64.8 ± 18.2 | 0.02 |
| Night-time averages | ||||
| Systolic blood pressure, mm Hg | 123.0 ± 18.2 | 122.2 ± 17.8 | 130.8 ± 21.4 | 0.07 |
| Diastolic blood pressure, mm Hg | 68.1 ± 10.4 | 68.2 ± 10.3 | 67.4 ± 11.8 | 0.79 |
| Mean arterial pressure, mm Hg | 87.7 ± 11.8 | 87.5 ± 11.7 | 90.7 ± 12.9 | 0.30 |
| Pulse pressure, mm Hg | 54.9 ± 10.0 | 54.2 ± 13.5 | 63.2 ± 18.5 | 0.02 |
| Ambulatory arterial stiffness index | 0.45 ± 0.16 | 0.44 ± 0.16 | 0.60 ± 0.15 | < 0.0001 |
| Morning surge index | 0 (0 - 9.7) | 0 (0 - 10.2) | 0 (0 - 7.8) | 0.86 |
| Variable | Hazard ratio (95% CI) | P value |
|---|---|---|
| MACE: major adverse cardiovascular event; CI: confidence interval; AASI: ambulatory arterial stiffness index; eGFR: estimated glomerular filtration rate; HDL: high-density lipoprotein. | ||
| Age | 1.05 (0.98 - 1.12) | 0.18 |
| Diabetes mellitus | 5.4 (1.3 - 23.4) | 0.02 |
| Peripheral vascular disease | 4.0 (0.26 - 60.8) | 0.32 |
| AASI ≥ 0.56 | 4.2 (1.1 - 15.2) | 0.03 |
| eGFR | 1.02 (0.98 - 1.06) | 0.28 |
| HDL cholesterol | 0.09 (0.01 - 0.74) | 0.03 |
| Heart failure | 1.58 (0.24 - 10.61) | 0.64 |
| Statin use | 1.76 (0.54 - 5.7) | 0.35 |
| Alpha blockers | 0.26 (0.02 - 2.7) | 0.26 |
| Hypertension | 1.90 (0.37 - 0.7) | 0.44 |