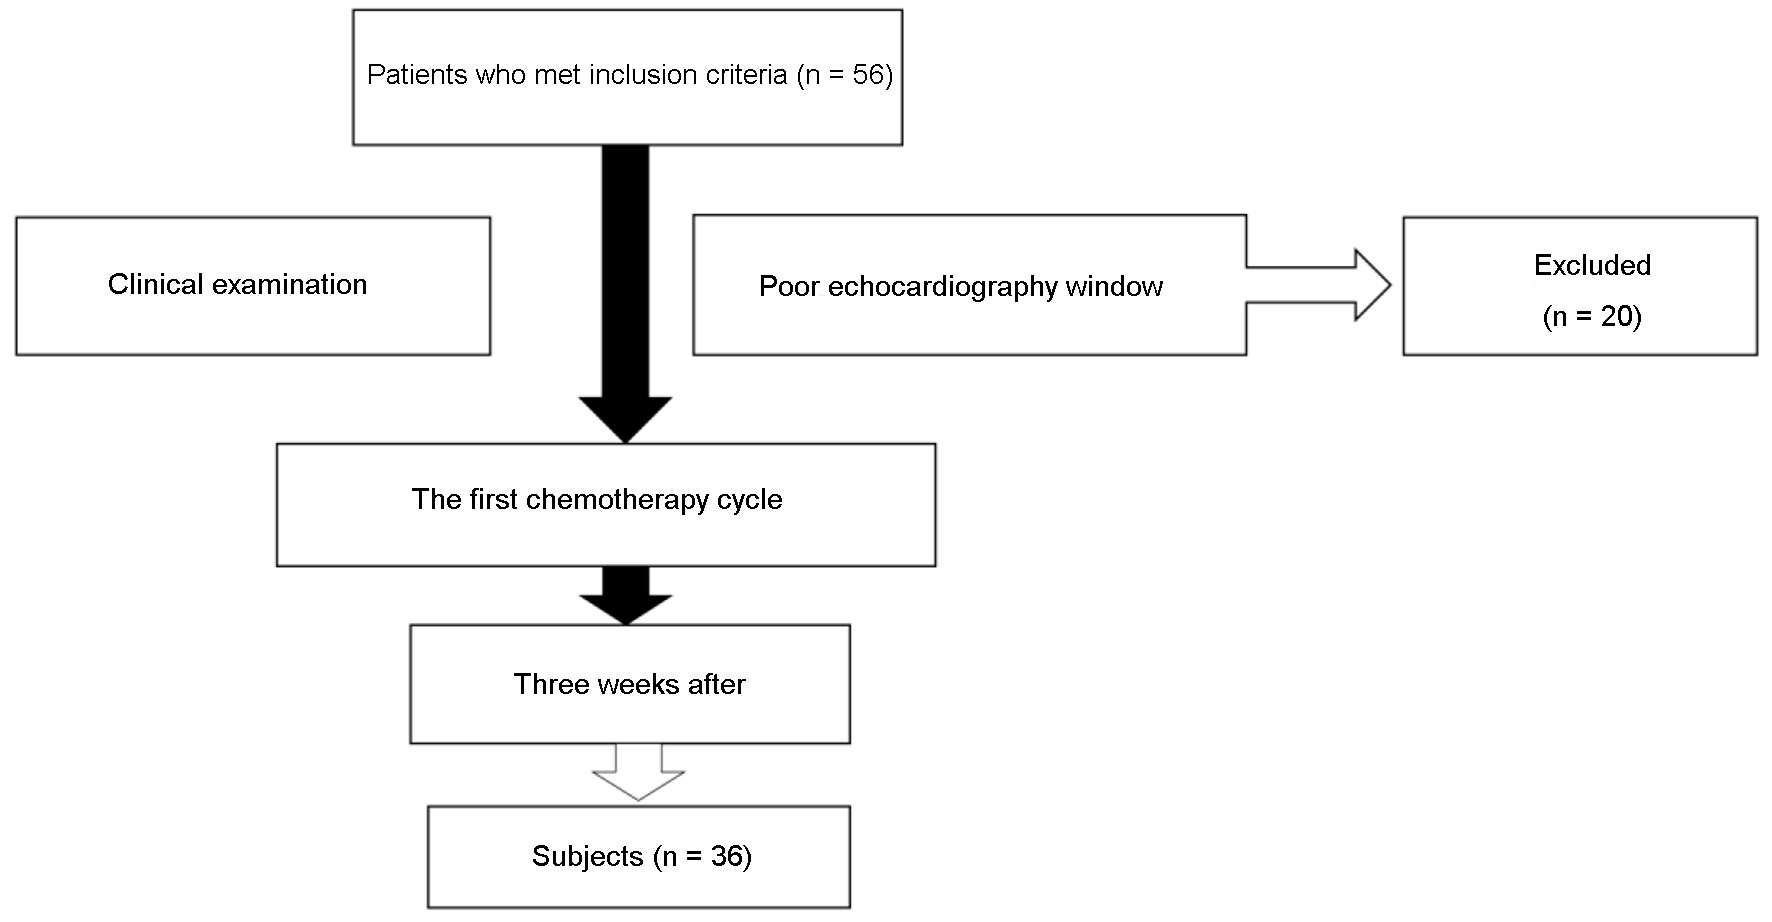
Figure 1. Subjects enrolment and assortment.
| Cardiology Research, ISSN 1923-2829 print, 1923-2837 online, Open Access |
| Article copyright, the authors; Journal compilation copyright, Cardiol Res and Elmer Press Inc |
| Journal website https://www.cardiologyres.org |
Original Article
Volume 12, Number 4, August 2021, pages 238-243
Global and Regional Longitudinal Strain Reduction in Breast Cancer Patients After First Chemotherapy Cycle With Fluorouracil, Adriamycin, and Cyclophosphamide Regimen
Figures
Tables
| Baseline characteristics | n = 36 |
|---|---|
| SD: standard deviation; BMI: body mass index; BSA: body surface area; CVD: cardiovascular disease. | |
| Age (years), mean ± SD | 46 ± 9 |
| Weight (kg), mean ± SD | 56 ± 8 |
| Height (m), mean ± SD | 1.54 ± 0.06 |
| BMI (kg/m2), mean ± SD | 23.66 ± 3.04 |
| BSA, mean ± SD | 1.53 ± 0.12 |
| Cancer type, n (%) | |
| Invasive ductal carcinoma mammae | 34 (94) |
| Invasive carcinoma of no specific type | 1 (3) |
| Clear cell carcinoma mammae | 1 (3) |
| Adjuvant, n (%) | 29 (80.6) |
| Neo-adjuvant, n (%) | 7 (19.4) |
| Cardiovascular risk factors, n (%) | |
| Obesity | 12 (33.3) |
| Hypertensive heart disease | 3 (8.3) |
| Hypertension | 3 (8.3) |
| Diabetes mellitus | 0 (0.0) |
| History of anthracycline chemotherapy | 0 (0.0) |
| History of radiotherapy | 0 (0.0) |
| Family history of premature CVD | 0 (0.0) |
| Smoking | 1 (2.8) |
| Characteristic | Baseline, mean ± SD (%) | 3 weeks, mean ± SD (%) | Difference, mean (95% CI) (%) | P value |
|---|---|---|---|---|
| *The GLS was reduced significantly after 3 weeks. CI: confidence interval; GLS: global longitudinal strain; LVEF: left ventricular ejection fraction; SD: standard deviation. | ||||
| GLS | -20.7 ± 2.4 | -19.1 ± 2.8 | -1.6 (-2.6 to -0.7) | 0.002* |
| LVEF biplane | 67.8 ± 4.5 | 65.8 ± 5.1 | 2.0 (-0.2 to 4.3) | 0.067 |
| Segment | Baseline, mean ± SD (%) | 3 weeks, mean ± SD (%) | Difference, mean (95% CI) (%) | P value |
|---|---|---|---|---|
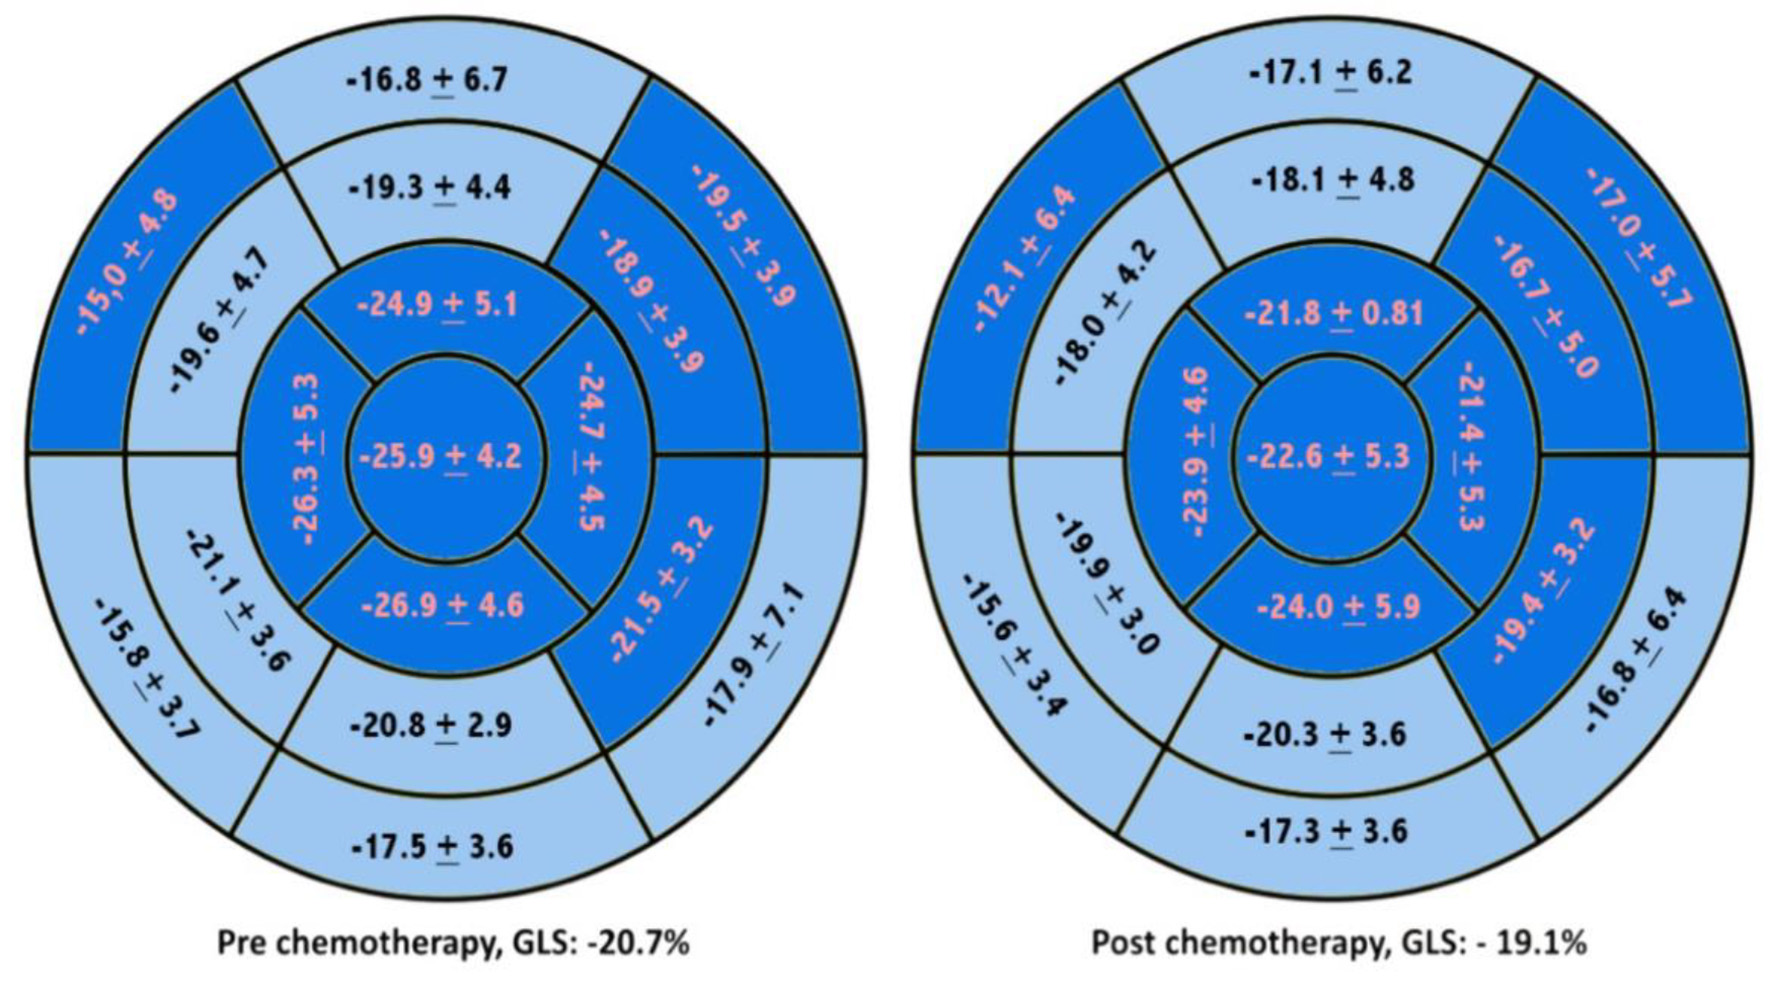
| The RLS of the basal anteroseptal, basal anterolateral, mid anterolateral, mid inferolateral, and all apical segments (*P < 0.05) were significantly reduced with the significant decline being found in apicoanterior, basal, and mid anterolateral segments. RLS: regional longitudinal strain; CI: confidence interval; SD: standard deviation. | ||||
| Basal anterior | -16.8 ± 6.7 | -17.1 ± 6.2 | -0.3 (-2.8 - 2.2) | 0.805 |
| Basal anteroseptal | -15.0 ± 4.8 | -12.1 ± 6.4 | 2.9 (0.7 - 5.2) | 0.013* |
| Basal inferoseptal | -15.8 ± 3.7 | -15.6 ± 3.4 | 0.2 (-1.2 - 1.6) | 0.749 |
| Basal inferior | -17.5 ± 3.6 | -17.3 ± 3.6 | 0.2 (-1.4 - 1.7) | 0.828 |
| Basal inferolateral | -17.9 ± 7.1 | -16.8 ± 6.4 | 1.1 (-1.8 - 4.1) | 0.433 |
| Basal anterolateral | -19.5 ± 3.9 | -17.0 ± 5.7 | 2.5 (0.6 - 4.4) | 0.013* |
| Mid anterior | -19.3 ± 4.4 | -18.1 ± 4.8 | 1.2 (-0.6 - 3.0) | 0.186 |
| Mid anteroseptal | -19.6 ± 4.7 | -18.0 ± 4.2 | 1.6 (-0.3 - 3.6) | 0.092 |
| Mid inferoseptal | -21.1 ± 3.6 | -19.9 ± 3.0 | 1.3 (-0.1 - 2.6) | 0.062 |
| Mid inferior | -20.8 ± 2.9 | -20.3 ± 3.6 | 0.4 (-0.8 - 1.7) | 0.472 |
| Mid inferolateral | -21.5 ± 3.2 | -19.4 ± 3.2 | 2.1 (1.0 - 3.3) | 0.001* |
| Mid anterolateral | -18.9 ± 3.9 | -16.7 ± 5.0 | 2.2 (0.5 - 3.9) | 0.012* |
| Apicoanterior | -24.9 ± 5.1 | -21.0 ± 8.1 | 3.9 (1.3 - 6.5) | 0.004* |
| Apicoseptal | -26.3 ± 5.3 | -23.9 ± 4.6 | 2.3 (0.1 - 4.5) | 0.038* |
| Apicoinferior | -26.9 ± 4.6 | -24.0 ± 5.9 | 3.0 (0.7 - 5.2)) | 0.010* |
| Apicolateral | -24.7 ± 4.5 | -21.4 ± 5.3 | 3.3 (1.0 - 5.5) | 0.005* |
| Apical cap | -25.9 ± 4.2 | -22.6 ± 5.3 | 3.3 (1.2 - 5.3) | 0.003* |