Figures
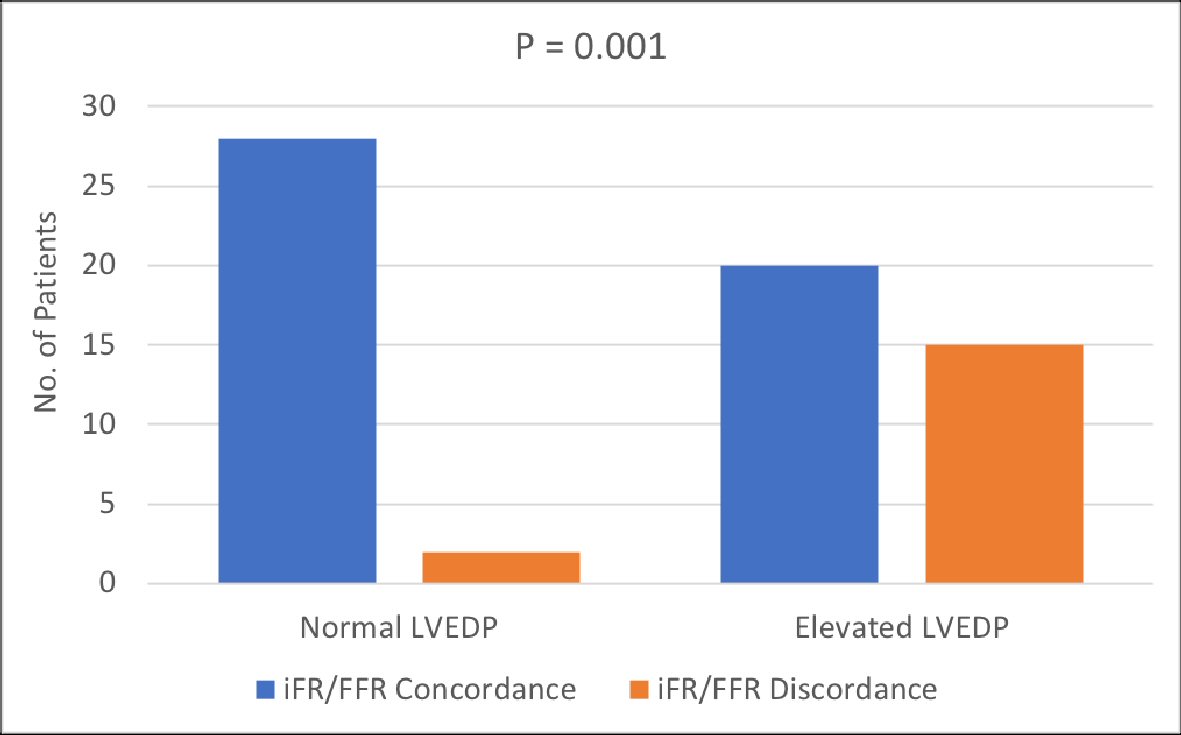
Figure 1. Comparison of iFR/FFR concordance and discordance between normal and elevated LVEDP groups. Significant number of patients in elevated LVEDP group had iFR/FFR discordance. P < 0.05 indicates statistical significance. iFR: instantaneous wave-free ratio; FFR: fractional flow reserve; LVEDP: left ventricular end diastolic pressure.
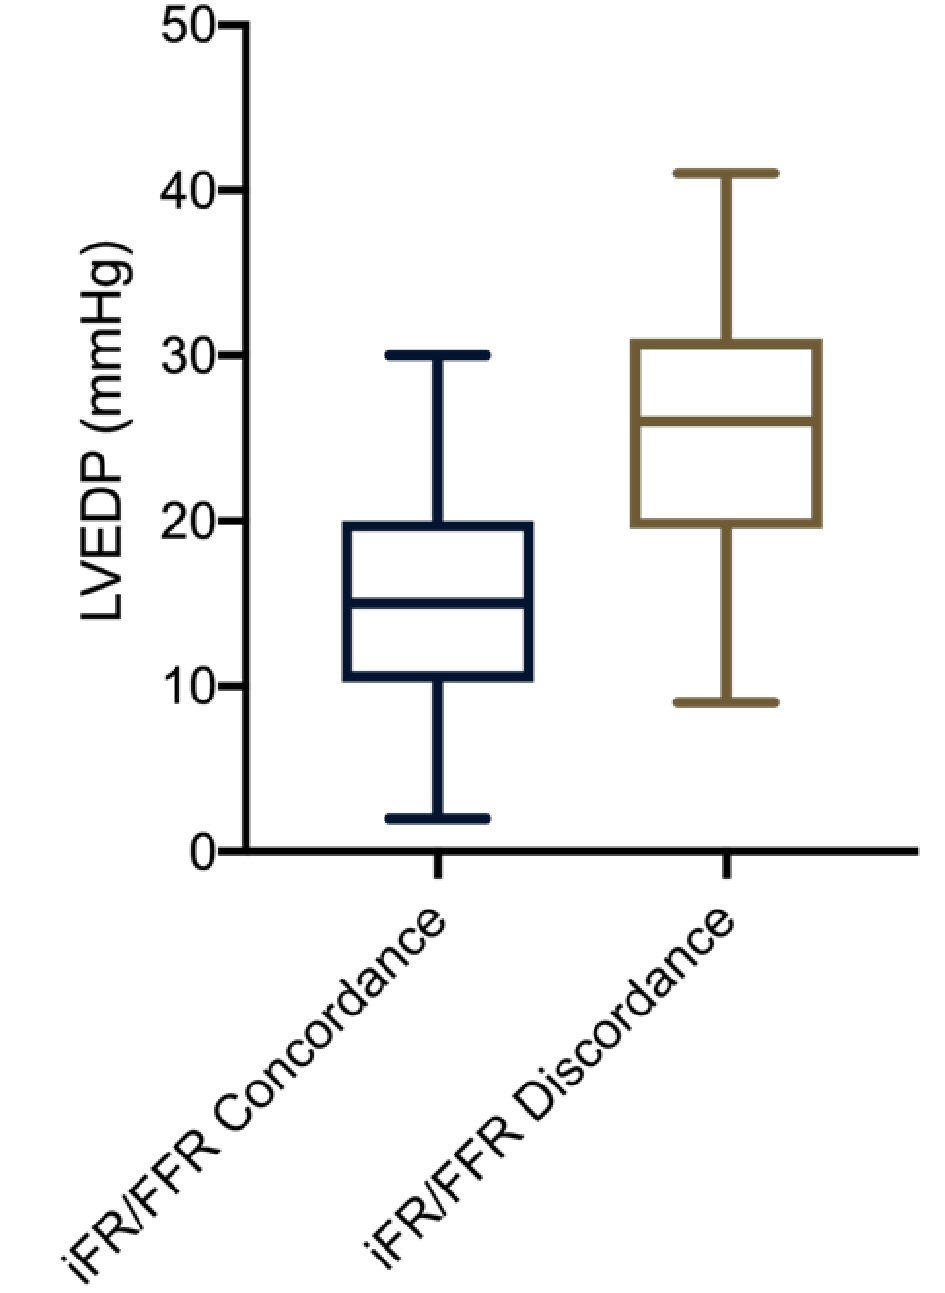
Figure 2. Mean LVEDP with range in iFR/FFR concordance and discordance patients. iFR: instantaneous wave-free ratio; FFR: fractional flow reserve; LVEDP: left ventricular end diastolic pressure.
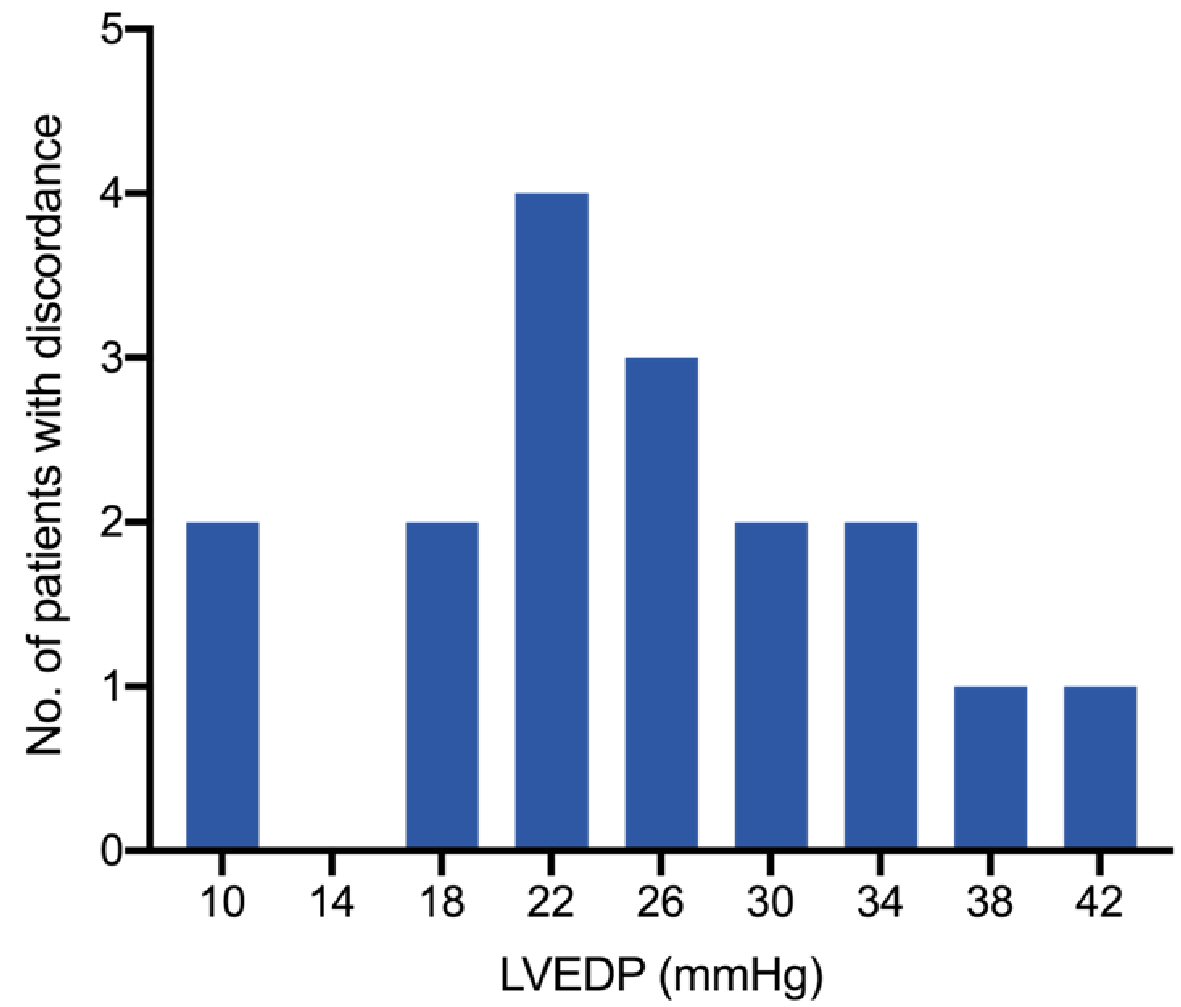
Figure 3. Frequency distribution of discordant patients according to LVEDP indicating that more than half of patients with iFR/FFR discordance had LVEDP > 25 mm Hg. iFR: instantaneous wave-free ratio; FFR: fractional flow reserve; LVEDP: left ventricular end diastolic pressure.
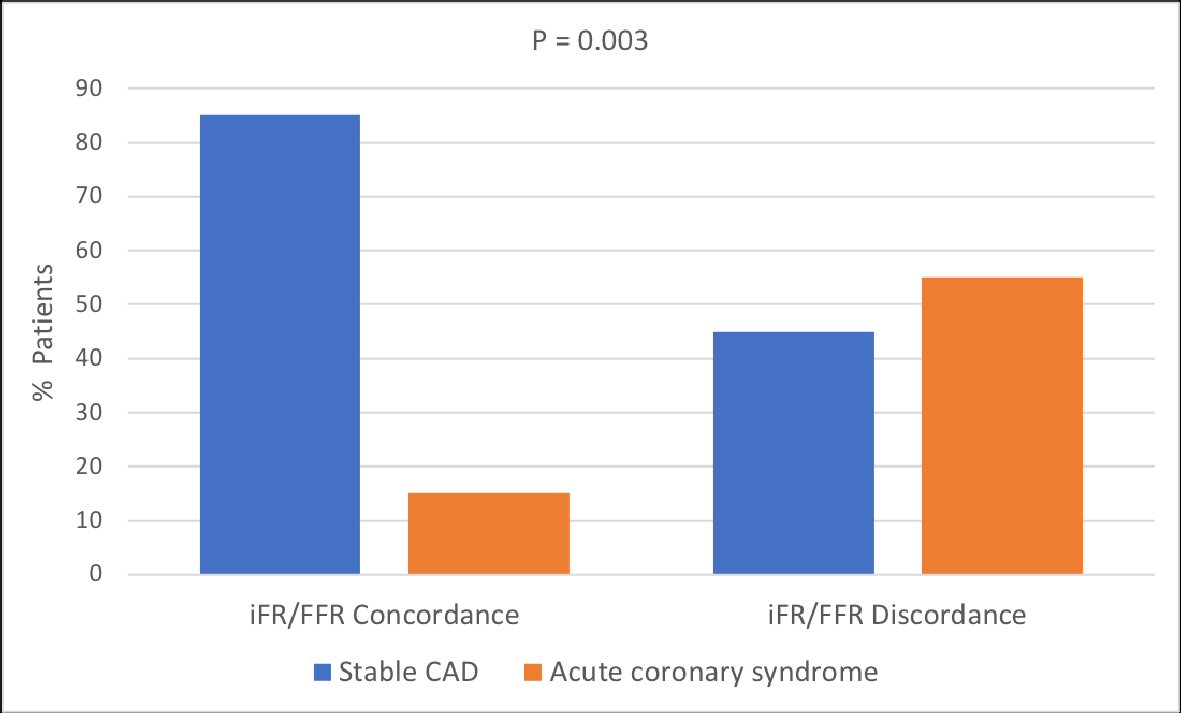
Figure 4. Comparison of iFR/FFR concordance and discordance according to stable CAD and acute coronary syndrome. Significantly more patients with acute coronary syndrome had iFR/FFR discordance. P < 0.05 indicates statistical significance. iFR: instantaneous wave-free ratio; FFR: fractional flow reserve; CAD: coronary artery disease.
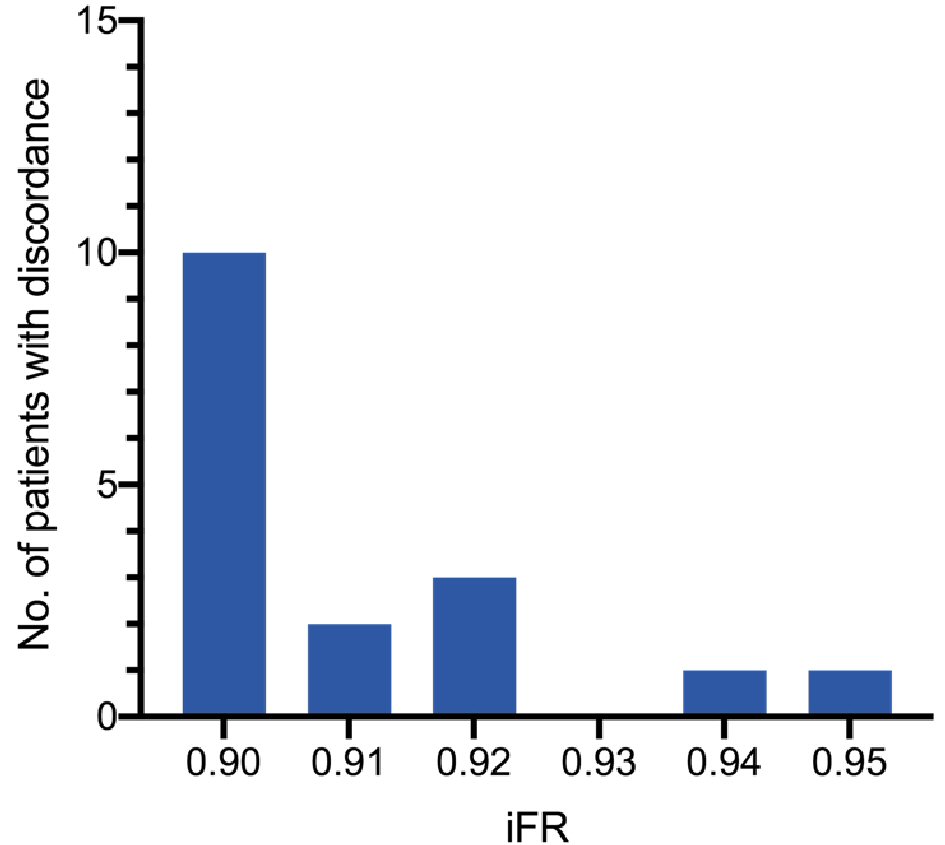
Figure 5. Frequency distribution of discordant patients according to iFR. Most of the patients with iFR/FFR discordance had iFR between 0.90 and 0.92. iFR: instantaneous wave-free ratio; FFR: fractional flow reserve.
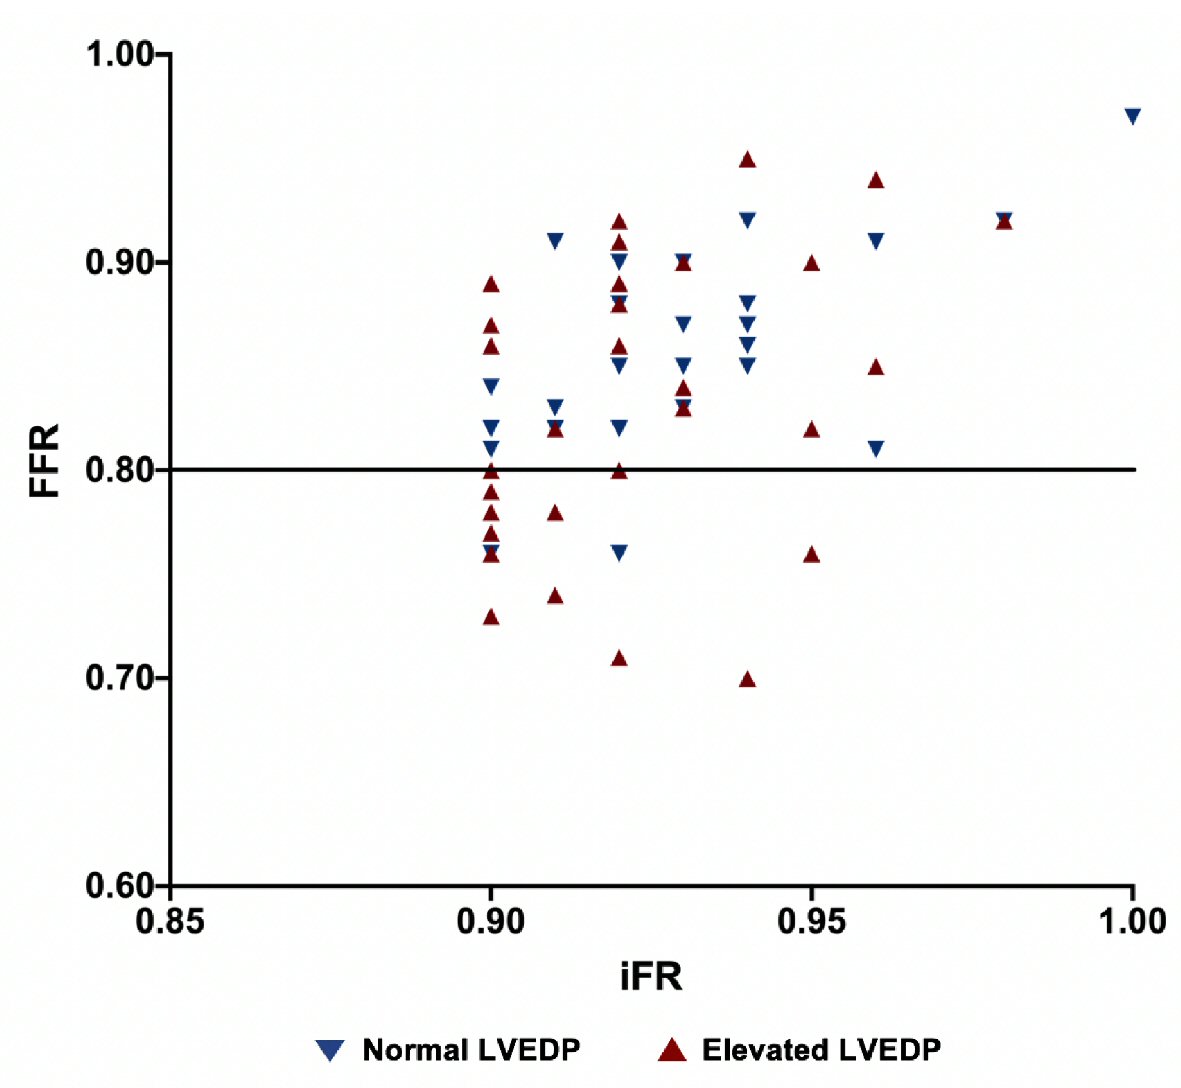
Figure 6. Scatter plot graph showing iFR and FFR distribution in patient population. Data below the FFR cutoff of 0.80 indicate discordance. iFR: instantaneous wave-free ratio; FFR: fractional flow reserve; LVEDP: left ventricular end diastolic pressure.
Table
Table 1. Clinical, Angiographic and Hemodynamic Characteristics of Patients
| Characteristics | All (n = 65) | Normal LVEDP (n = 30) | Elevated LVEDP (n = 35) | P value |
|---|
| Variables are expressed as number (%) or mean ± standard deviation. P < 0.05 indicates difference between the groups is statistically significant. PCI: percutaneous coronary intervention; MI: myocardial infarction; CABG: coronary artery bypass graft; UA: unstable angina; NSTEMI: non-ST elevation myocardial infarction; STEMI: ST elevation myocardial infarction; LAD: left anterior descending artery; LCX: left circumflex artery; RCA: right coronary artery; iFR: instantaneous wave-free ratio; FFR: fractional flow reserve; LVEDP: left ventricular end diastolic pressure. |
| Age (years) | 66.9 ± 9.4 | 67.9 ± 9.5 | 66 ± 9.5 | 0.42 |
| Sex | | | | |
| Female | 18 (28%) | 9 (30%) | 9 (26%) | 0.78 |
| Male | 47 (72%) | 21 (70%) | 26 (74%) | 0.78 |
| Medical history | | | | |
| Diabetes mellitus | 19 (29%) | 5 (17%) | 14 (40%) | 0.06 |
| Hypertension | 54 (83%) | 23 (77%) | 31 (88%) | 0.32 |
| Hyperlipidemia | 40 (61%) | 19 (63%) | 21 (60%) | 0.80 |
| Current smoker | 9 (14%) | 4 (13%) | 5 (14%) | 0.99 |
| Chronic systolic heart failure | 12 (18%) | 5 (17%) | 7 (20%) | 0.76 |
| Previous PCI | 18 (28%) | 6 (20%) | 12 (34%) | 0.26 |
| Previous MI | 9 (14%) | 5 (17%) | 4 (11%) | 0.72 |
| Previous CABG | 5 (7%) | 2 (6%) | 3 (8%) | 0.99 |
| Left ventricular ejection fraction (%) | 52.5 ± 11.2 | 53.95 ± 11.09 | 51.5 ± 11.33 | 0.44 |
| Diastolic dysfunction on echocardiogram | 14 (21%) | 2 (6%) | 12 (34%) | 0.01 |
| GFR < 30 mL/min | 4 (6%) | 0 (0%) | 4 (11%) | 0.12 |
| Clinical presentation | | | | |
| Stable angina | 49 (75%) | 24 (80%) | 25 (71%) | 0.56 |
| UA/NSTEMI | 16 (25%) | 6 (20%) | 10 (29%) | 0.56 |
| STEMI | 0 | 0 | 0 | 0.99 |
| Stenosis location | | | | |
| LAD | 49 (75%) | 23 (77%) | 26 (74%) | 0.99 |
| LCX | 4 (6%) | 2 (6%) | 2 (6%) | 0.99 |
| RCA | 10 (15%) | 5 (17%) | 5 (14%) | 0.99 |
| Diagonal | 1 (2%) | 0 | 1 (3%) | 0.99 |
| Obtuse marginal | 1 (2%) | 0 | 1 (3%) | 0.99 |
| Functional assessment | | | | |
| iFR | 0.92 ± 0.02 | 0.93 ± 0.02 | 0.92 ± 0.02 | 0.17 |
| FFR | 0.84 ± 0.06 | 0.85 ± 0.04 | 0.82 ± 0.06 | 0.07 |
| LVEDP (mm Hg) | 17.97 ± 7.8 | 11.3 ± 3.1 | 23.66 ± 5.95 | < 0.001 |