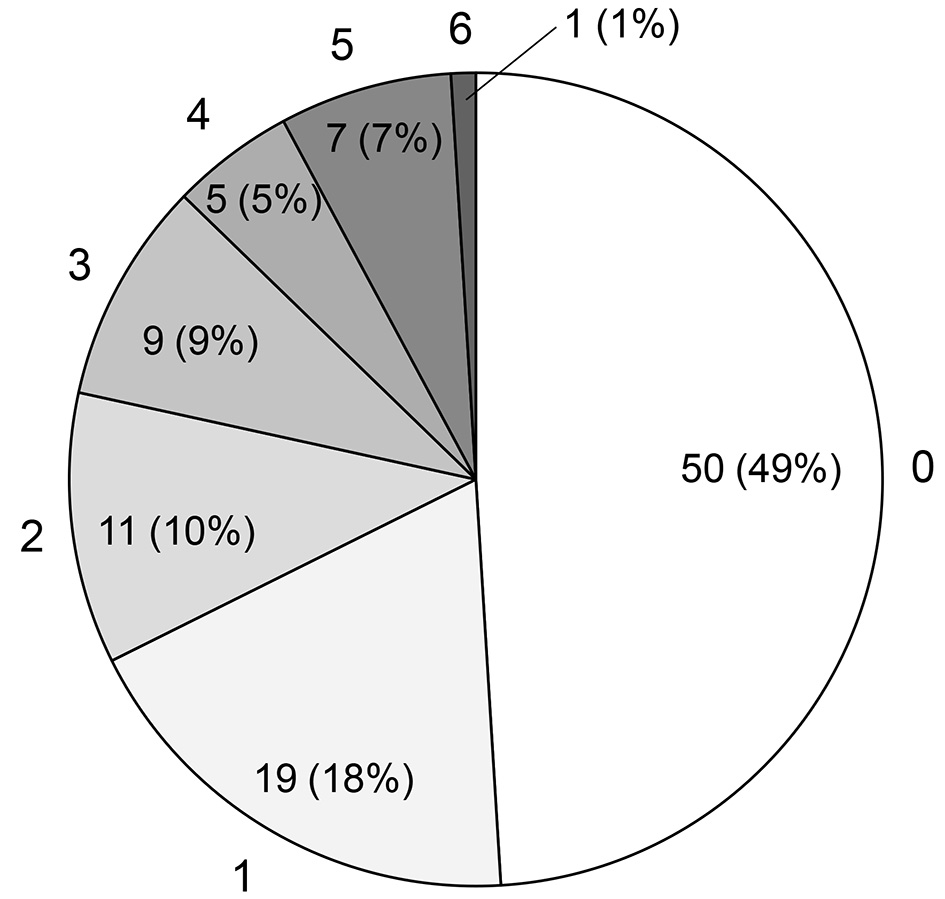
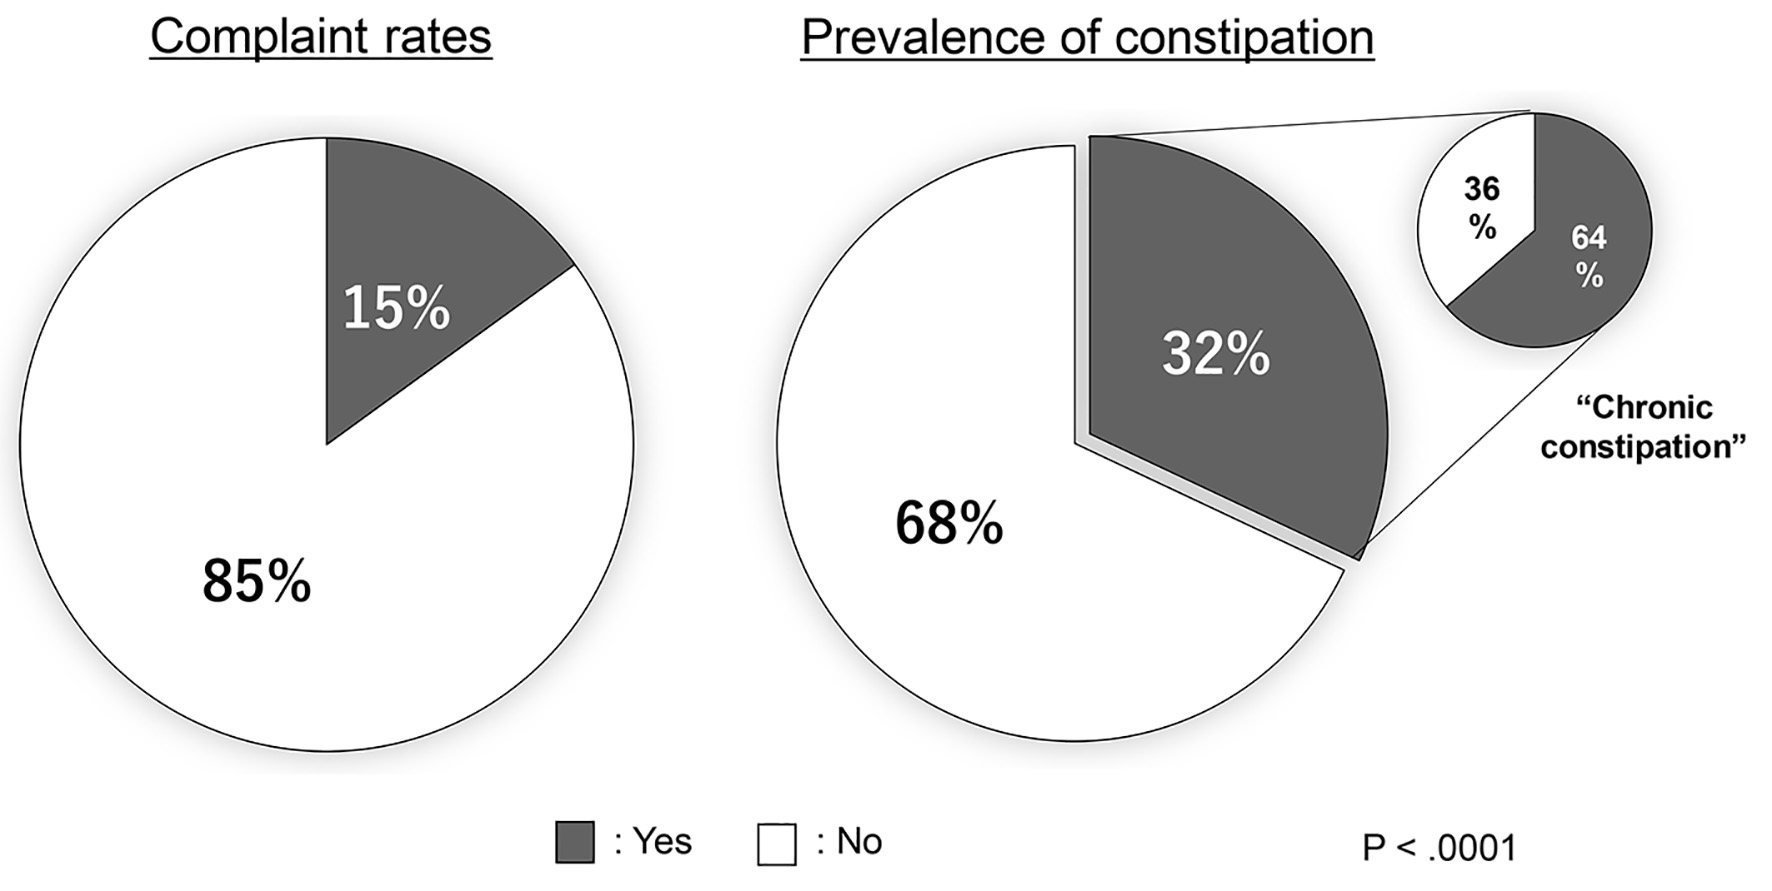
Figure 1. The number of applicable items for functional constipation diagnosis criteria. Subjects were classified into constipation (n = 33, 32%) and non-constipation (n = 69, 68%) groups according to the Chronic Constipation Treatment Guidelines.
| Cardiology Research, ISSN 1923-2829 print, 1923-2837 online, Open Access |
| Article copyright, the authors; Journal compilation copyright, Cardiol Res and Elmer Press Inc |
| Journal website https://www.cardiologyres.org |
Original Article
Volume 12, Number 3, June 2021, pages 169-176
Association Between Constipation and Frailty Components in Patients Undergoing Late Phase II Cardiac Rehabilitation
Figures
Tables
| All subjects (n = 102) | Constipation group (n = 33) | Non-constipation group (n = 69) | P value | |
|---|---|---|---|---|
| Data are presented as the mean ± SD. CVD: cardiovascular disease; CR: cardiac rehabilitation; eGFR: estimated glomerular filtration rate; HDL-C: high-density lipoprotein cholesterol; LDL-C: low-density lipoprotein cholesterol; FBS: fasting blood sugar; BNP: brain natriuretic peptide; NT-proBNP: N-terminal pro brain natriuretic peptide; GNRI: Geriatric Nutritional Risk Index; ACE-I: angiotensin-converting enzyme inhibitor; ARB: angiotensin II receptor blocker; CCB: calcium-channel blocker; OHA: oral hypoglycemic agent. | ||||
| Age, years | 62.7 ± 13.4 | 71.5 ± 11.2 | 58.5 ± 12.4 | < 0.01 |
| Male, n (%) | 68 (67) | 20 (61) | 48 (70) | 0.37 |
| Body mass index, kg/m2 | 24.0 ± 4.4 | 22.8 ± 3.3 | 24.5 ± 4.7 | 0.03 |
| Hypertension, n (%) | 59 (58) | 17 (51) | 42 (61) | 0.37 |
| Diabetes mellitus, n (%) | 12 (12) | 3 (9) | 10 (14) | 0.44 |
| Dyslipidemia, n (%) | 30 (29) | 12 (36) | 18 (26) | 0.28 |
| Current smoking, n (%) | 10 (18) | 1 (6) | 9 (23) | 0.27 |
| CVD at the beginning of CR, n (%) | ||||
| Chronic heart failure | 64 (63) | 22 (67) | 43 (62) | 0.52 |
| Aortic disease | 22 (21) | 8 (24) | 14 (20) | |
| Acute myocardial infarction | 16 (16) | 3 (9) | 12 (18) | |
| Atrial fibrillation | 25 (25) | 11 (33) | 14 (20) | 0.15 |
| Laboratory data | ||||
| Hemoglobin, g/dL | 13.1 ± 2.0 | 12.3 ± 1.8 | 13.4 ± 2.0 | < 0.01 |
| Albumin, g/dL | 3.8 ± 0.4 | 3.6 ± 0.4 | 3.9 ± 0.4 | < 0.01 |
| Creatinine, mg/dL | 1.07 ± 0.56 | 1.23 ± 0.67 | 0.99 ± 0.49 | 0.04 |
| eGFR, mL/min/1.73 m2 | 59.4 ± 20.6 | 50.7 ± 20.2 | 63.8 ± 19.3 | < 0.01 |
| Total cholesterol, mg/dL | 174 ± 32 | 170 ± 33 | 175 ± 33 | 0.55 |
| Triglyceride, mg/dL | 118 ± 97 | 115 ± 65 | 120 ± 110 | 0.82 |
| HDL-C, mg/dL | 50 ± 12 | 50 ± 13 | 50 ± 12 | 0.96 |
| LDL-C, mg/dL | 99 ± 30 | 92 ± 27 | 104 ± 30 | 0.07 |
| FBS, mg/dL | 104 ± 27 | 98 ± 18 | 106 ± 30 | 0.15 |
| Hemoglobin A1c, % | 5.9 ± 0.7 | 5.8 ± 0.4 | 5.9 ± 0.8 | 0.85 |
| BNP, pg/mL | 290 ± 348 | 361 ± 478 | 242 ± 221 | 0.20 |
| NT-proBNP, pg/mL | 1,855 ± 3,122 | 3,069 ± 2,989 | 1,855 ± 3,122 | 0.23 |
| GNRI | 100.1 ± 12.3 | 97.1 ± 10.7 | 103.3 ± 12.8 | 0.03 |
| Ejection fraction, % | 51.0 ± 17.5 | 51.6 ± 18.1 | 50.8 ± 17.4 | 0.81 |
| Medications, n (%) | ||||
| ACE-I | 33 (32) | 10 (30) | 23 (33) | 0.75 |
| ARB | 37 (36) | 12 (36) | 25 (36) | 0.98 |
| β-blockers | 87 (85) | 28 (85) | 59 (85) | 0.93 |
| CCB | 28 (27) | 6 (18) | 22 (32) | 0.14 |
| Loop diuretic | 66 (64) | 23 (70) | 43 (62) | 0.46 |
| Vasopressin antagonist | 16 (16) | 7 (21) | 9 (13) | 0.46 |
| Potassium-sparing diuretic | 39 (38) | 11 (33) | 28 (41) | 0.48 |
| Statin | 39 (38) | 14 (42) | 25 (36) | 0.54 |
| OHA | 8 (8) | 2 (6) | 6 (9) | 0.64 |
| Insulin | 2 (2) | 1 (3) | 1 (1) | 0.59 |
| Sleeping pills | 8 (8) | 3 (9) | 5 (7) | 0.74 |
| Proton pump inhibitor | 69 (67) | 22 (67) | 47 (68) | 0.88 |
| Laxatives | 31 (30) | 16 (48) | 15 (22) | < 0.01 |
| Irritant laxative | 18 (18) | 11 (34) | 7 (10) | < 0.01 |
| Lubiprostone | 4 (4) | 4 (12) | 0 (0) | < 0.01 |
| Osmotic laxative | 19 (19) | 7 (21) | 12 (17) | 0.20 |
| Herbal medicine | 5 (5) | 2 (6) | 3 (4) | 0.74 |
| All subjects (n = 102) | Constipation group (n = 33) | Non-constipation group (n = 69) | P value | |
|---|---|---|---|---|
| Data are presented as the mean ± SD. | ||||
| Kihon checklist score | ||||
| Activities of daily living | 0.80 ± 1.16 | 1.09 ± 1.55 | 0.68 ± 0.91 | 0.09 |
| Physical function | 1.21 ± 1.26 | 1.60 ± 1.24 | 1.04 ± 1.22 | 0.03 |
| Nutritional status | 0.60 ± 0.60 | 1.09 ± 0.94 | 0.71 ± 0.94 | 0.05 |
| Oral function | 0.82 ± 0.95 | 0.63 ± 0.60 | 0.61 ± 0.62 | 0.83 |
| Social activities of daily living | 0.40 ± 0.56 | 0.58 ± 0.56 | 0.31 ± 0.55 | 0.03 |
| Cognitive function | 0.35 ± 0.60 | 0.48 ± 0.66 | 0.30 ± 0.57 | 0.16 |
| Depressive mood | 1.89 ± 1.74 | 2.67 ± 1.57 | 1.53 ± 1.70 | < 0.01 |
| Total score | 6.02 ± 4.20 | 8.15 ± 4.24 | 5.20 ± 3.87 | < 0.01 |
| Prevalence of frailty | ||||
| Frailty, n (%) | 35 (34) | 18 (55) | 17 (25) | 0.01 |
| Pre-frailty, n (%) | 35 (34) | 10 (30) | 25 (36) | |
| Non-frailty, n (%) | 32 (32) | 5 (15) | 27 (39) | |