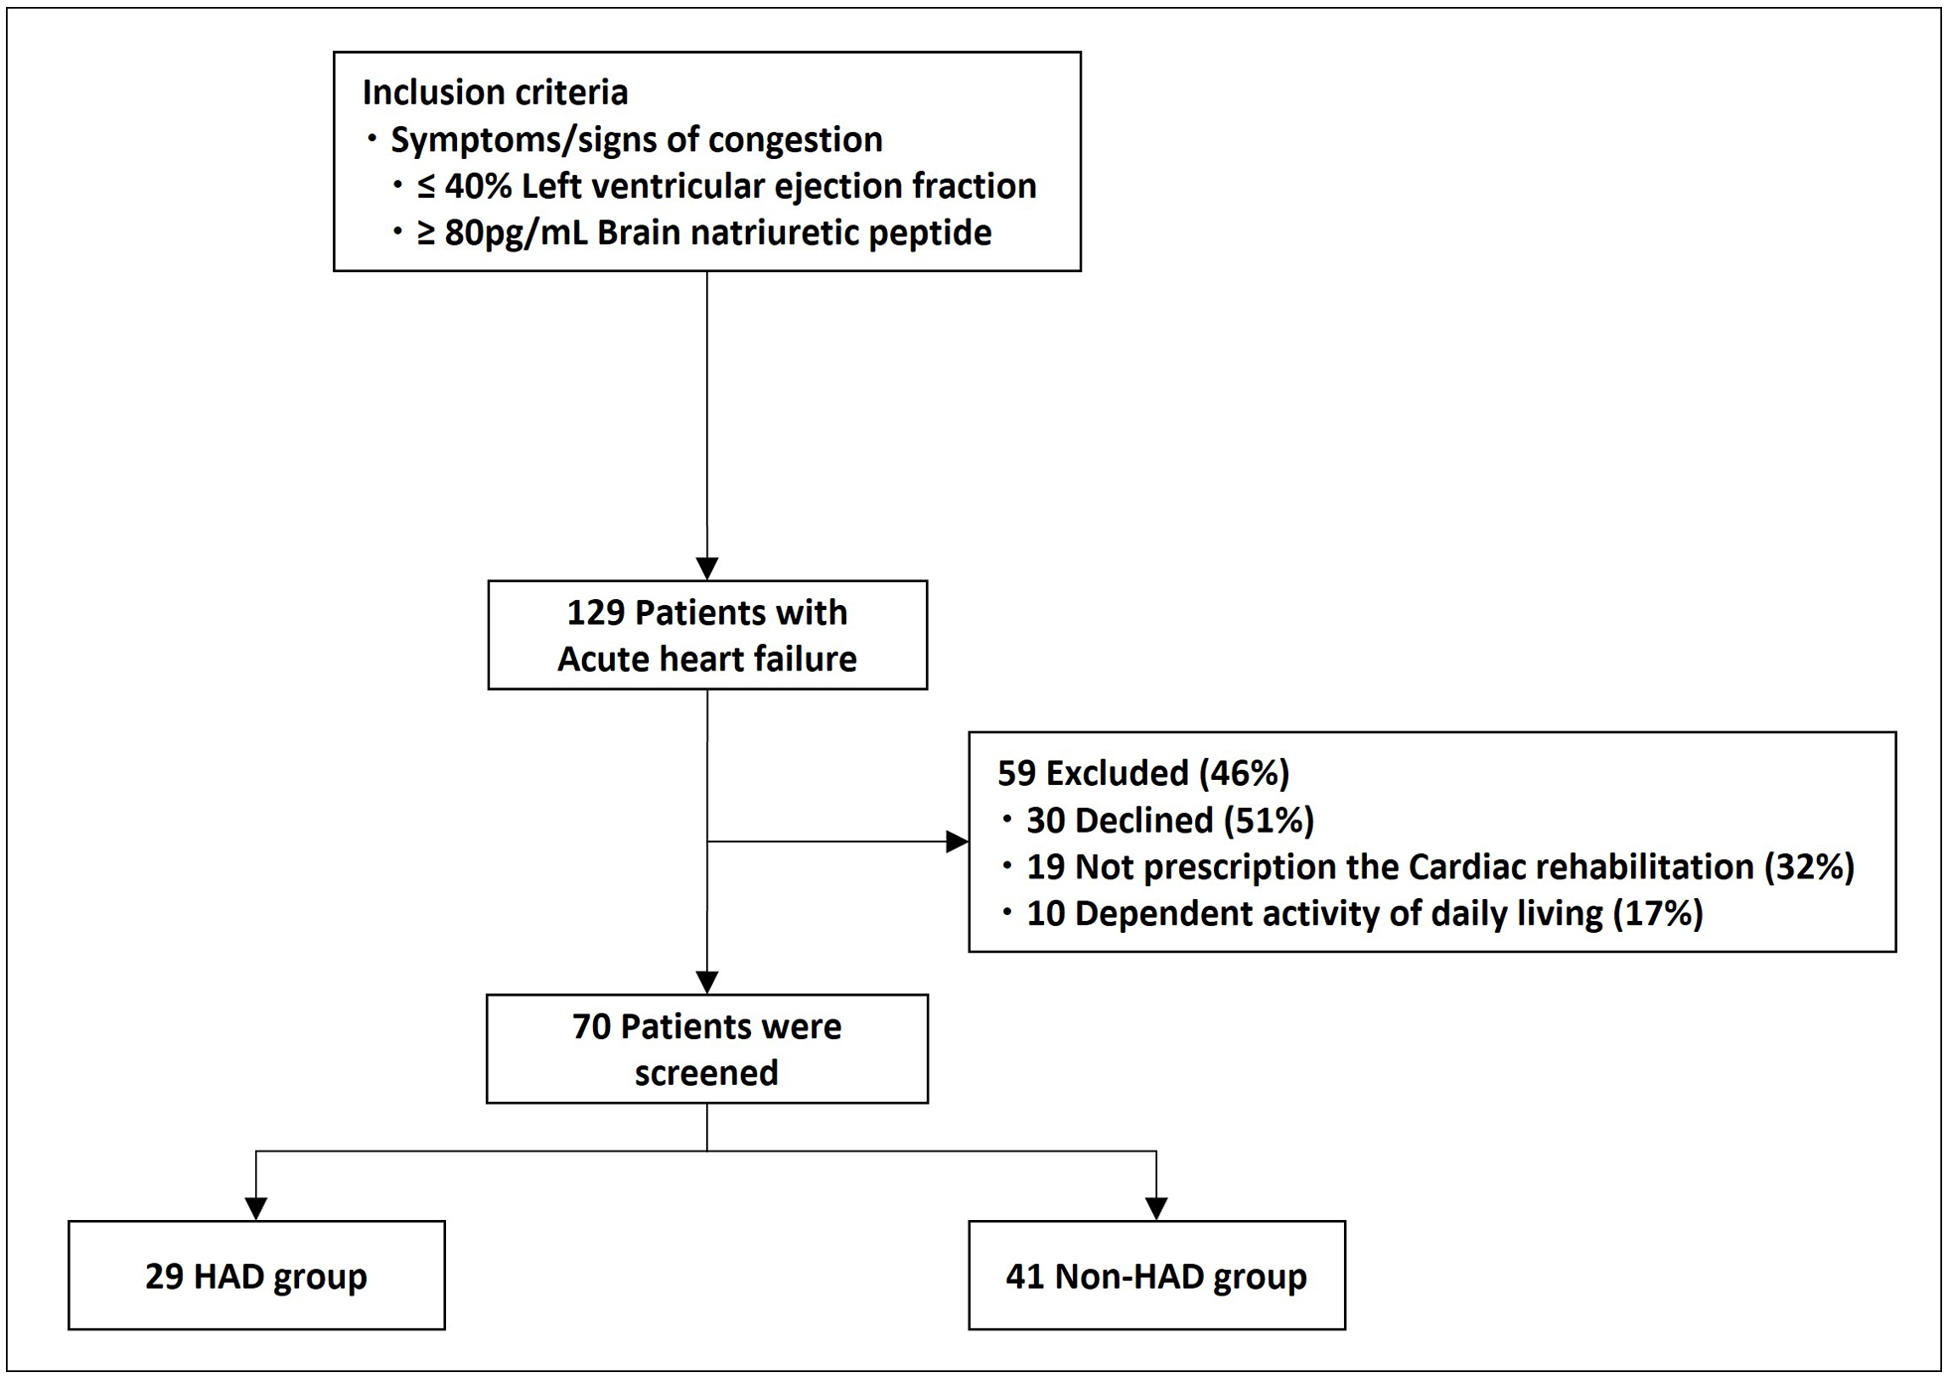
Figure 1. Flow chart with inclusion and exclusion criteria. HAD: hospital-acquired disability.
| Cardiology Research, ISSN 1923-2829 print, 1923-2837 online, Open Access |
| Article copyright, the authors; Journal compilation copyright, Cardiol Res and Elmer Press Inc |
| Journal website https://www.cardiologyres.org |
Original Article
Volume 12, Number 5, October 2021, pages 293-301
Clinical Characteristics of Older Heart Failure Patients With Hospital-Acquired Disability: A Preliminary, Single-Center, Observational Study
Figures
Tables
| All (n = 70) | HAD (n = 29) | Non-HAD (n = 41) | P value | |
|---|---|---|---|---|
| Data are presented as the median (interquartile range). HAD: hospital-acquired disability; BMI: body mass index; NYHA: New York Heart Association Functional Classification; LVEF: left ventricular ejection fraction; HFrEF: HF with reduced ejection fraction; HFmrEF: HF with midrange ejection fraction; HFpEF: HF with preserved ejection fraction; BNP: brain natriuretic peptide; Hb: hemoglobin; eGFR: estimated glomerular filtration rate; CRP: C-reactive protein; Na: serum sodium. | ||||
| Age, years | 78 (74 - 83) | 81 (78 - 86) | 78 (72 - 83) | 0.034 |
| Sex, female, n (%) | 29 (41) | 14 (48) | 15 (37) | 0.416 |
| BMI, kg/m2 | 22 (20, 25) | 21 (19, 25) | 24 (20, 26) | 0.110 |
| Living alone, n (%) | 24 (34) | 8 (28) | 16 (39) | 0.506 |
| Requiring care, n (%) | 14 (41) | 9 (31) | 5 (12) | 0.101 |
| Etiology, n (%) | ||||
| Ischemic heart disease, n (%) | 19 (27) | 8 (28) | 11 (27) | 0.999 |
| Hypertensive heart disease, n (%) | 25 (36) | 9 (31) | 16 (39) | 0.664 |
| Valvular heart disease, n (%) | 26 (37) | 12 (41) | 14 (34) | 0.714 |
| NYHA class III/IV, n (%) | 26 (37)/44 (63) | 8 (28)/21 (72) | 18 (44)/23 (56) | 0.254 |
| Hypertension, n (%) | 68 (97) | 28 (97) | 40 (98) | 0.999 |
| Dyslipidemia, n (%) | 28 (40) | 14 (48) | 14 (34) | 0.347 |
| Diabetes mellitus, n (%) | 20 (29) | 6 (21) | 14 (34) | 0.338 |
| Atrial fibrillation, n (%) | 26 (37) | 11 (38) | 15 (37) | 0.999 |
| Myocardial infarction, n (%) | 8 (11) | 4 (14) | 4 (10) | 0.887 |
| Charlson Comorbidity Index | 4 (3 - 5) | 4 (3 - 5) | 4 (3 - 5) | 0.950 |
| History of HF, n (%) | 37 (53) | 18 (62) | 19 (48) | 0.340 |
| LVEF, % | 43 (32 - 56) | 43 (36 - 58) | 42 (31 - 54) | 0.349 |
| HFrEF, n (%) | 29 (41) | 10 (35) | 19 (46) | 0.456 |
| HFmEF, n (%) | 15 (21) | 6 (21) | 9 (22) | 0.999 |
| HFpEF, n (%) | 26 (37) | 13 (45) | 13 (33) | 0.429 |
| BNP, pg/dL | 535 (344 - 927) | 538 (393 - 1267) | 527 (265 - 749) | 0.285 |
| Hb, g/dL | 11.8 (10.2- 14.1) | 11.5 (10.3- 12.7) | 11.9 (9.7 - 14.4) | 0.807 |
| eGFR, mL/min/1.73 m2 | 33.8 (25.4 - 45.9) | 32.4 (22.9 - 45.2) | 34.5 (25.9 - 50) | 0.788 |
| CRP, mg/dL | 0.6 (0.1 - 2.9) | 0.8 (0.2 - 2.9) | 0.5 (0.1 - 2.9) | 0.725 |
| Na, mEq/L | 140 (136 - 141) | 138 (138 - 141) | 140 (138 - 141) | 0.107 |
| All (n = 70) | HAD (n = 29) | Non-HAD (n = 41) | P value | |
|---|---|---|---|---|
| Data are presented as the median (interquartile range). HAD: hospital-acquired disability; IABP: intra-aortic balloon pumping; NPPV: non-invasive positive pressure ventilation; CRRT: continuous renal replacement therapy; ICU: intensive care unit; MRA: mineralocorticoid receptor antagonist; ACEI: angiotensin-converting enzyme inhibitor; ARB: angiotensin II receptor blocker; CCB: calcium channel blocker. | ||||
| Inotropes use, n (%) | 2 (4) | 2 (7) | 1 (2) | 0.758 |
| IABP, n (%) | 1 (1) | 0 (0) | 1 (2) | 0.999 |
| Ventilator, n (%) | 1 (1) | 1 (3) | 0 (0) | 0.999 |
| NPPV, n (%) | 15 (21) | 8 (28) | 7 (17) | 0.861 |
| CRRT, n (%) | 3 (4) | 2 (7) | 1 (2) | 0.447 |
| Patients admitted to the ICU, n (%) | 9 (13) | 6 (21) | 3 (7) | 0.199 |
| ICU length of stay, days | 0 (0 - 0) | 0 (0 - 0) | 0 (0 - 0) | 0.124 |
| Physical therapy start date | 2 (1 - 3) | 2 (1 - 3) | 1 (1 - 3) | 0.389 |
| Rehabilitation time, min | 180 (100 - 240) | 200 (80 - 260) | 160 (100 - 220) | 0.693 |
| Walking exercise, days | 2 (1 - 4) | 3 (2 - 4) | 2 (1 - 4) | 0.015 |
| Urinary-catheter-placement period, days | 2 (0 - 4) | 3 (1 - 5) | 1 (0 - 2) | 0.019 |
| Intravenous therapy started, days | 4 (2 - 6) | 4 (3 - 6) | 3 (1 - 6) | 0.244 |
| Medication at discharge | ||||
| Beta-blocker, n (%) | 52 (74) | 22 (76) | 30 (73) | 0.999 |
| MRA, n (%) | 36 (37) | 18 (62) | 18 (44) | 0.209 |
| ACEI/ARB, n (%) | 22 (31) | 9 (31) | 13 (32) | 0.999 |
| CCB, n (%) | 19 (27) | 7 (24) | 12 (29) | 0.839 |
| Length of stay, days | 11 (7 - 14) | 12 (7 - 15) | 10 (7 - 14) | 0.470 |
| Return to home rate, n (%) | 61 (87) | 20 (67) | 41 (100) | < 0.01 |
| All (n=70) | HAD (n=29) | Non-HAD (n=41) | P value | |
|---|---|---|---|---|
| Data are presented as the median (interquartile range). HAD: hospital-acquired disability; BI: Barthel Index; KCL: Kihon checklist; Multi-faceted frailty: KCL scores ≥ 8; SPPB: Short physical performance battery; Physical frailty: SPPB scores < 10; MMSE: mini-mental state examination; PA: physical activity. | ||||
| Before admission | ||||
| BI, score | 100 (90 - 100) | 95 (90 - 100) | 100 (90 - 100) | 0.050 |
| KCL, score | 12 (7 - 15) | 14 (11 - 17) | 9 (6 - 13) | < 0.01 |
| Multi-faceted frailty, n (%) | 62 (89) | 26 (90) | 36 (29) | < 0.01 |
| At discharge | ||||
| SPPB, score | 9 (6 - 11) | 6 (4 - 10) | 10 (8 - 12) | < 0.01 |
| Physical frailty, n (%) | 39 (58) | 22 (76) | 17 (42) | < 0.01 |
| Handgrip strength, kg | 19 (16 - 26) | 18 (14 - 19) | 22 (18 - 30) | < 0.01 |
| MMSE, score | 26 (21 - 26) | 21 (17 - 24) | 24 (22 - 27) | 0.022 |
| BI, score | 95 (85 - 100) | 85 (70 - 90) | 100 (100 - 100) | < 0.01 |
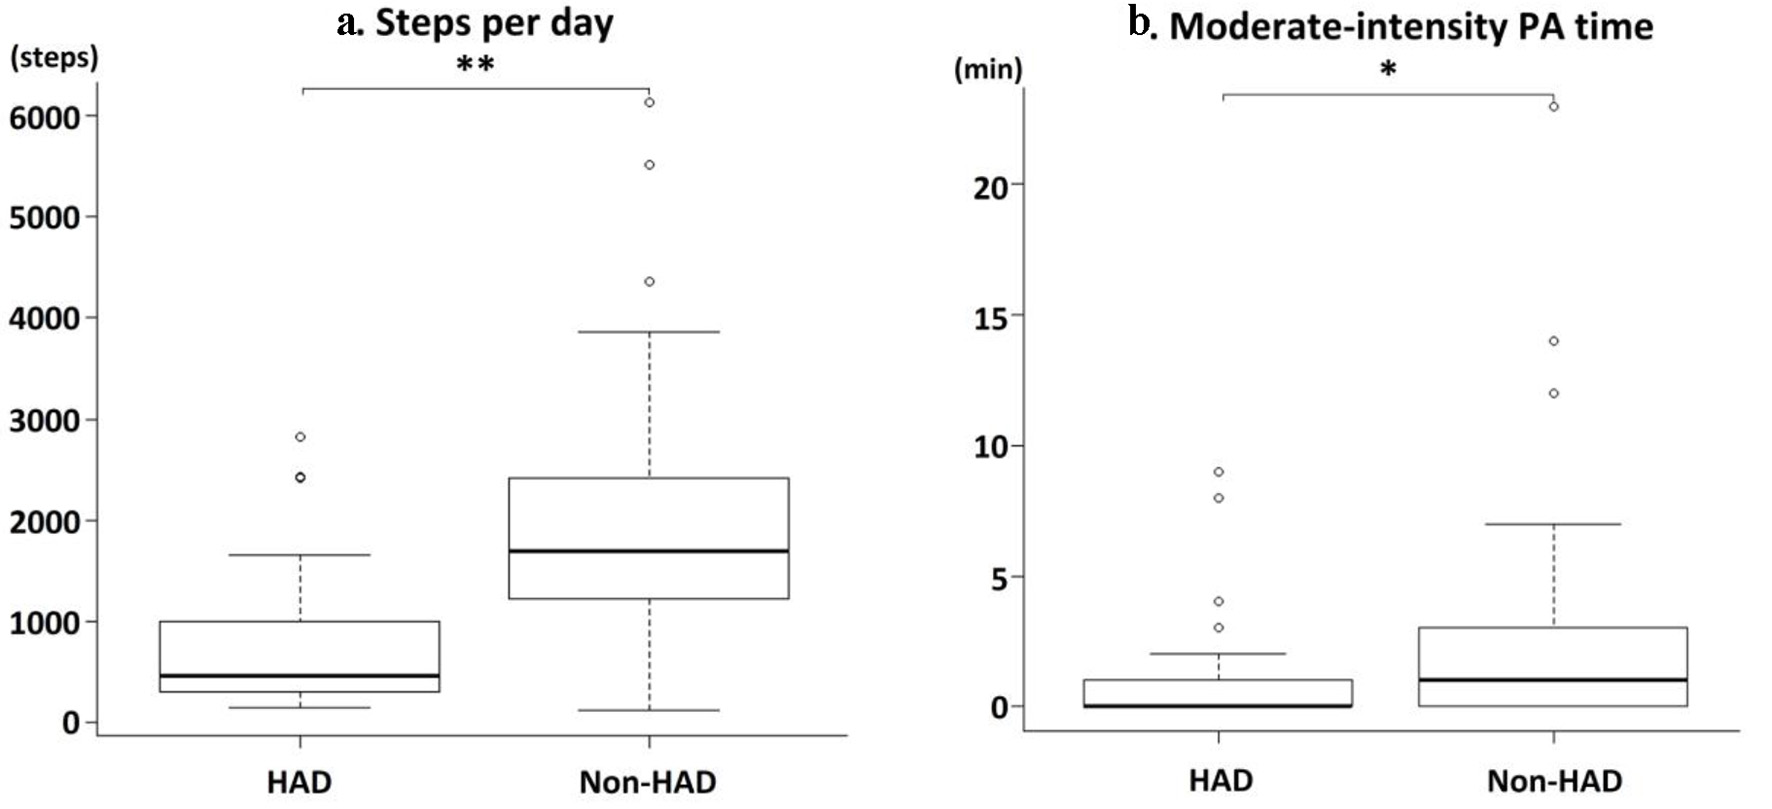
| PA during hospitalization | ||||
| Steps per day, step | 1,239 (452 - 1,878) | 457 (301 - 997) | 1,692 (1,227 - 2,418) | < 0.01 |
| Moderate-intensity PA time, min | 0 (0 - 1) | 0 (0 - 1) | 1 (0 - 3) | 0.021 |