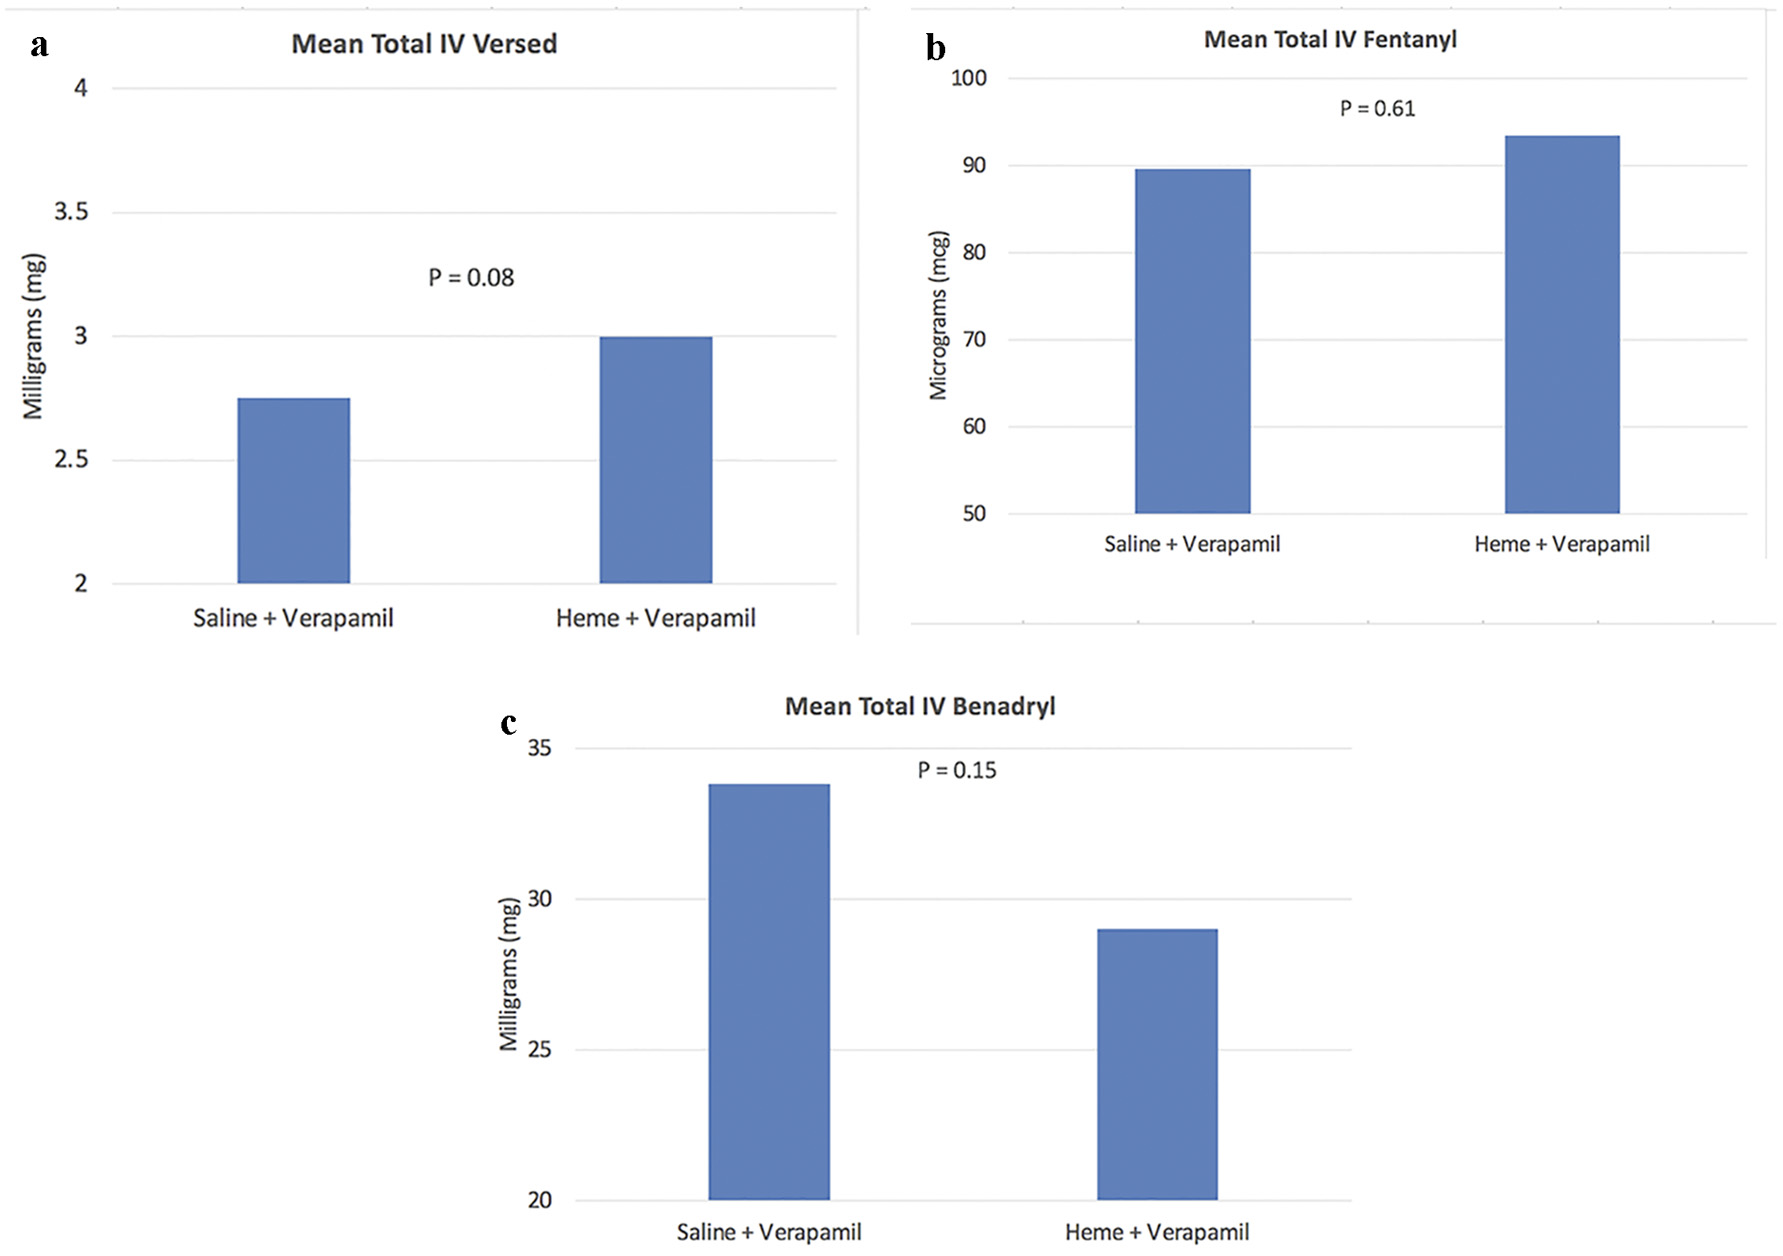
Figure 1. Graphs of total sedation between the two groups.
| Cardiology Research, ISSN 1923-2829 print, 1923-2837 online, Open Access |
| Article copyright, the authors; Journal compilation copyright, Cardiol Res and Elmer Press Inc |
| Journal website https://www.cardiologyres.org |
Original Article
Volume 12, Number 5, October 2021, pages 286-292
Heme Effects in Lowering Patient Discomfort in Radial Artery Verapamil Injection
Figures
Tables
| Characteristics | Saline + verapamil (n = 100) | Heme + verapamil (n = 103) | P-value |
|---|---|---|---|
| Variables are expressed as no. (%) or mean ± standard deviation. P < 0.05 indicates statistically significant difference between the groups. STEMI: ST elevation myocardial infarction; NSTEMI: non-ST elevation myocardial infarction; UA: unstable angina; BMI: body mass index. | |||
| Age (years) | 65.05 ± 10.68 | 64.68 ± 10.63 | 0.80 |
| Male sex | 59 (59.0%) | 63 (61.2%) | 0.75 |
| Medical history | |||
| Diabetes mellitus | 36 (36.0%) | 38 (36.9%) | 0.90 |
| Hypertension | 84 (84.0%) | 79 (76.7%) | 0.19 |
| Hyperlipidemia | 76 (76.0%) | 77 (74.8%) | 0.84 |
| Current smoker | 44 (44.0%) | 38 (36.9%) | 0.30 |
| Chronic systolic heart failure | 19 (19.0%) | 14 (13.6%) | 0.30 |
| Coronary artery disease | 37 (37.0%) | 38 (36.9%) | 0.99 |
| Peripheral vascular disease | 7 (7.0%) | 3 (2.9%) | 0.21 |
| Chronic kidney disease | 10 (10%) | 13 (12.6%) | 0.82 |
| Clinical presentation | |||
| STEMI | 0 (0.0%) | 1 (1.0%) | 1.00 |
| NSTEMI | 1 (1.0%) | 3 (2.9%) | 0.62 |
| UA | 8 (8.0%) | 18 (17.5%) | 0.04 |
| BMI (kg/m2) | 29.87 (11.10) | 31.05 (8.30) | 0.50 |
| Medications | Saline + verapamil (n = 100) | Heme + verapamil (n = 103) | P-value |
|---|---|---|---|
| Variables are expressed as no. (%). P < 0.05 indicates statistically significant difference between the groups. CCB: calcium channel blocker; ACEI: angiotensin-converting-enzyme inhibitors; ARB: angiotensin II receptor blockers. | |||
| Aspirin | 63 (63.0%) | 57 (55.3%) | 0.27 |
| Clopidogrel | 9 (9.0%) | 10 (9.7%) | 0.86 |
| Prasugrel | 2 (2.0%) | 5 (4.9%) | 0.45 |
| Ticagrelor | 2 (2.0%) | 3 (2.9%) | 1.00 |
| Warfarin | 10 (10.0%) | 7 (6.8%) | 0.41 |
| Apixaban | 5 (5.0%) | 7 (6.8%) | 0.59 |
| Rivaroxaban | 2 (2.0%) | 4 (3.9%) | 0.68 |
| Endoxaban | 1 (1.0%) | 0 (0.0%) | 0.49 |
| Beta-blocker | 61 (61.0%) | 64 (62.1%) | 0.87 |
| CCB | 13 (13.0%) | 26 (25.2%) | 0.027 |
| ACEI/ARB | 51 (51.0%) | 49 (47.6%) | 0.63 |
| Statin | 63 (63.0%) | 65 (63.1%) | 0.99 |
| Variables | Saline + verapamil (n = 100) | Heme + verapamil (n = 103) | P-value |
|---|---|---|---|
| Variables are expressed as no. (%) or mean ± standard deviation. P < 0.05 indicates statistically significant difference between the groups. PCI: percutaneous coronary intervention. | |||
| Ultrasound used | 12 (12.0%) | 11 (10.7%) | 0.77 |
| PCI | 12 (12.0%) | 18 (17.5%) | 0.27 |
| Nitro (µg) | 230.0 ± 87.5 | 217 ± 100 | 0.59 |
| Verapamil (mL) | 2.34 ± 0.83 | 2.61 ± 0.79 | 0.02 |
| Lidocaine (mL) | 1.4 ± 1.6 | 1.3 ± 1.43 | 0.58 |
| Number of sticks | 1.54 ± 1.007 | 1.71 ± 1.0 | 0.77 |
| Outcomes | Saline + verapamil (n = 100) | Heme + verapamil (n = 103) | P-value |
|---|---|---|---|
| Variables are expressed as no. (%) or mean ± standard deviation. P < 0.05 indicates statistically significant difference between the groups. | |||
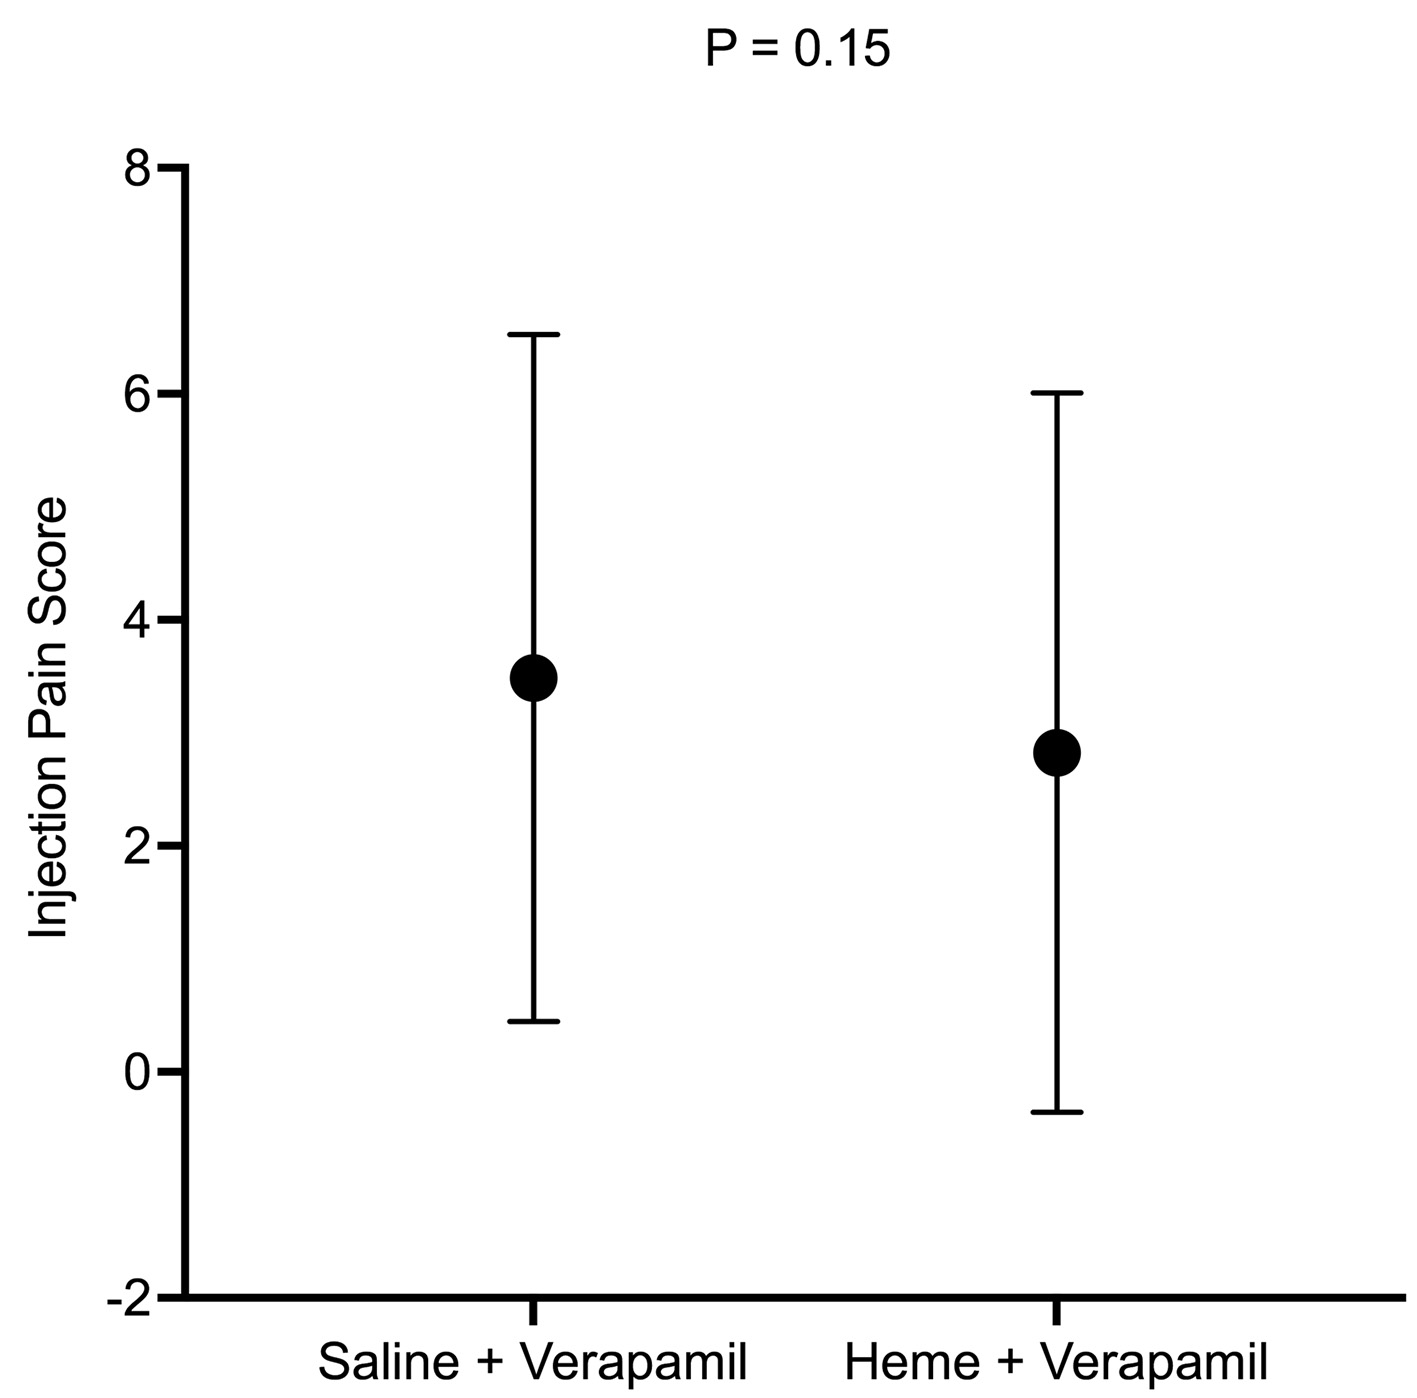
| Injection pain score | 3.48 ± 3.01 | 2.83 ± 3.18 | 0.15 |
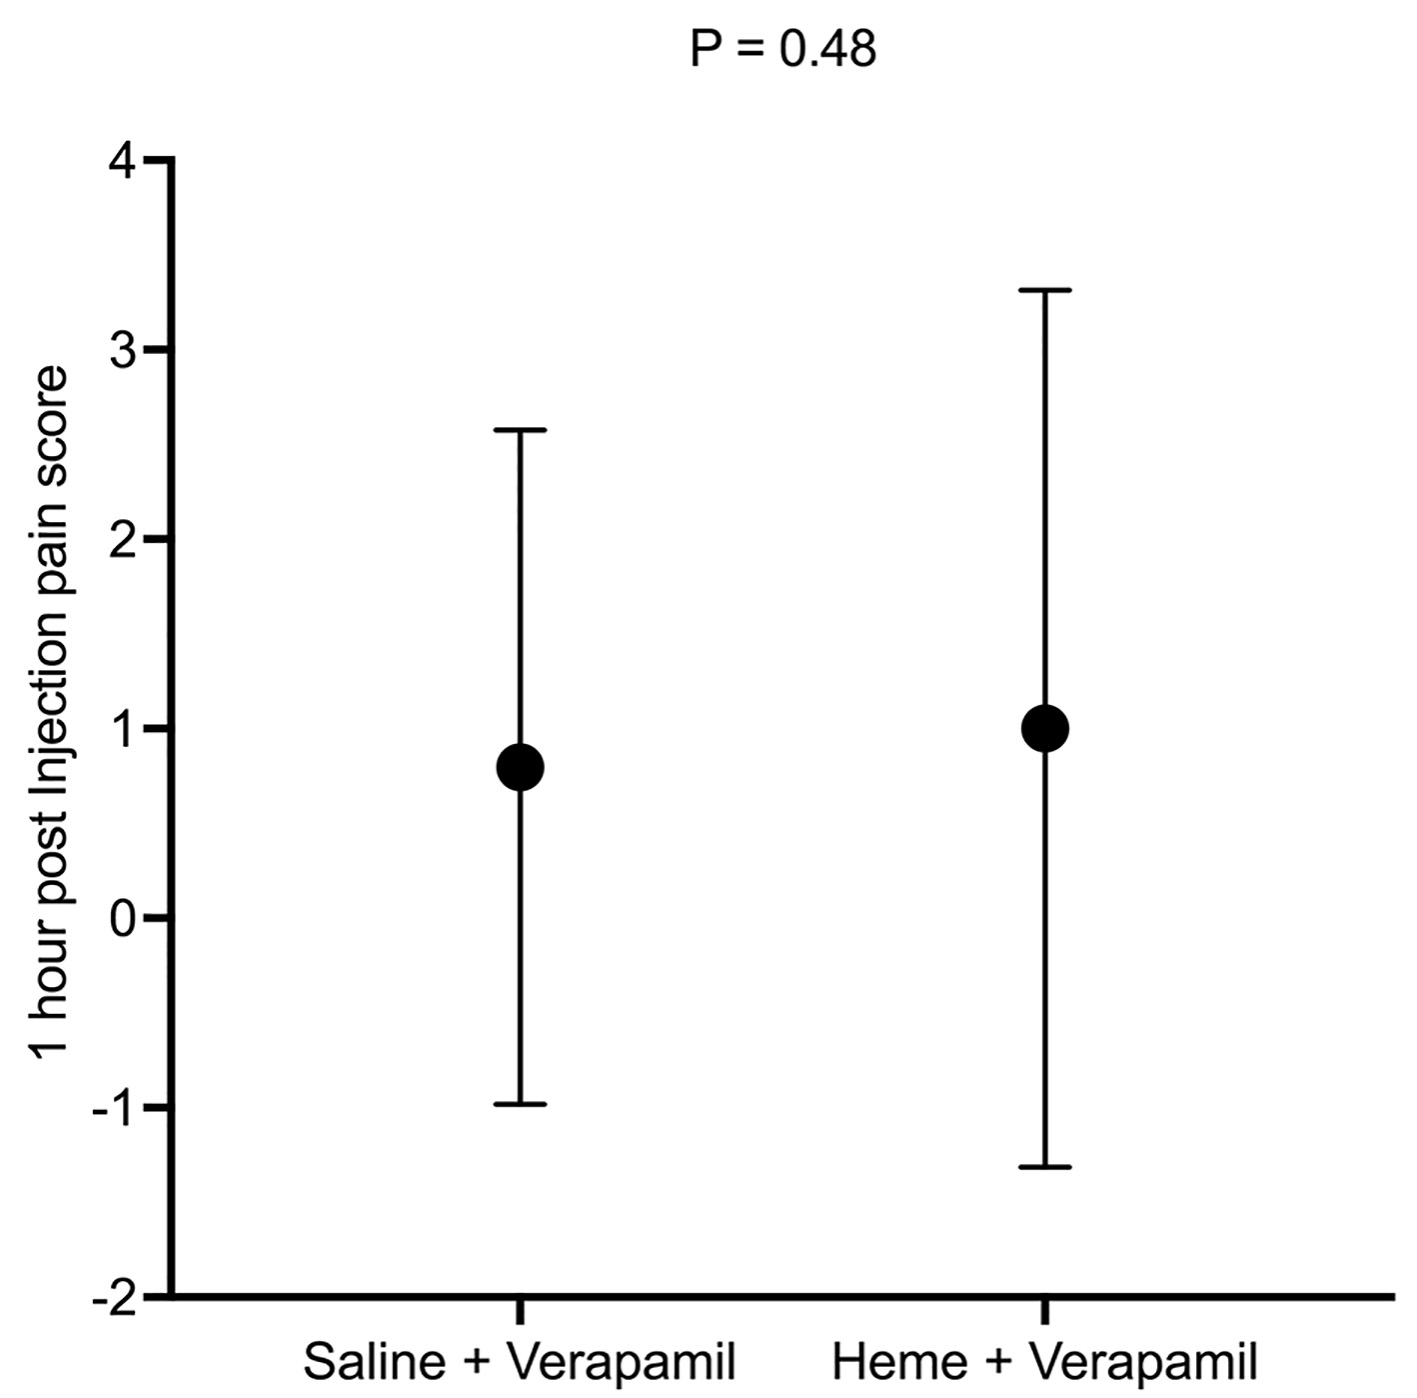
| 1-h pain score | 0.80 ± 1.78 | 1.0 ± 2.31 | 0.48 |
| Pre-versed (mg) | 1.5 ± 1.2 | 2.4 ± 2.1 | 0.016 |
| Pre-fentanyl (µg) | 50.65 ± 50.0 | 53.23 ± 52.12 | 0.60 |
| Pre-benadryl (mg) | 33.25 ± 23.58 | 29.85 ± 24.52 | 0.32 |
| Total versed (mg) | 2.75 ± 2.38 | 3.0 ± 2.0 | 0.08 |
| Total fentanyl (µg) | 89.67 ± 55.31 | 93.45 ± 55.39 | 0.61 |
| Total benadryl (mg) | 33.81 ± 23.51 | 29 ± 24.56 | 0.15 |
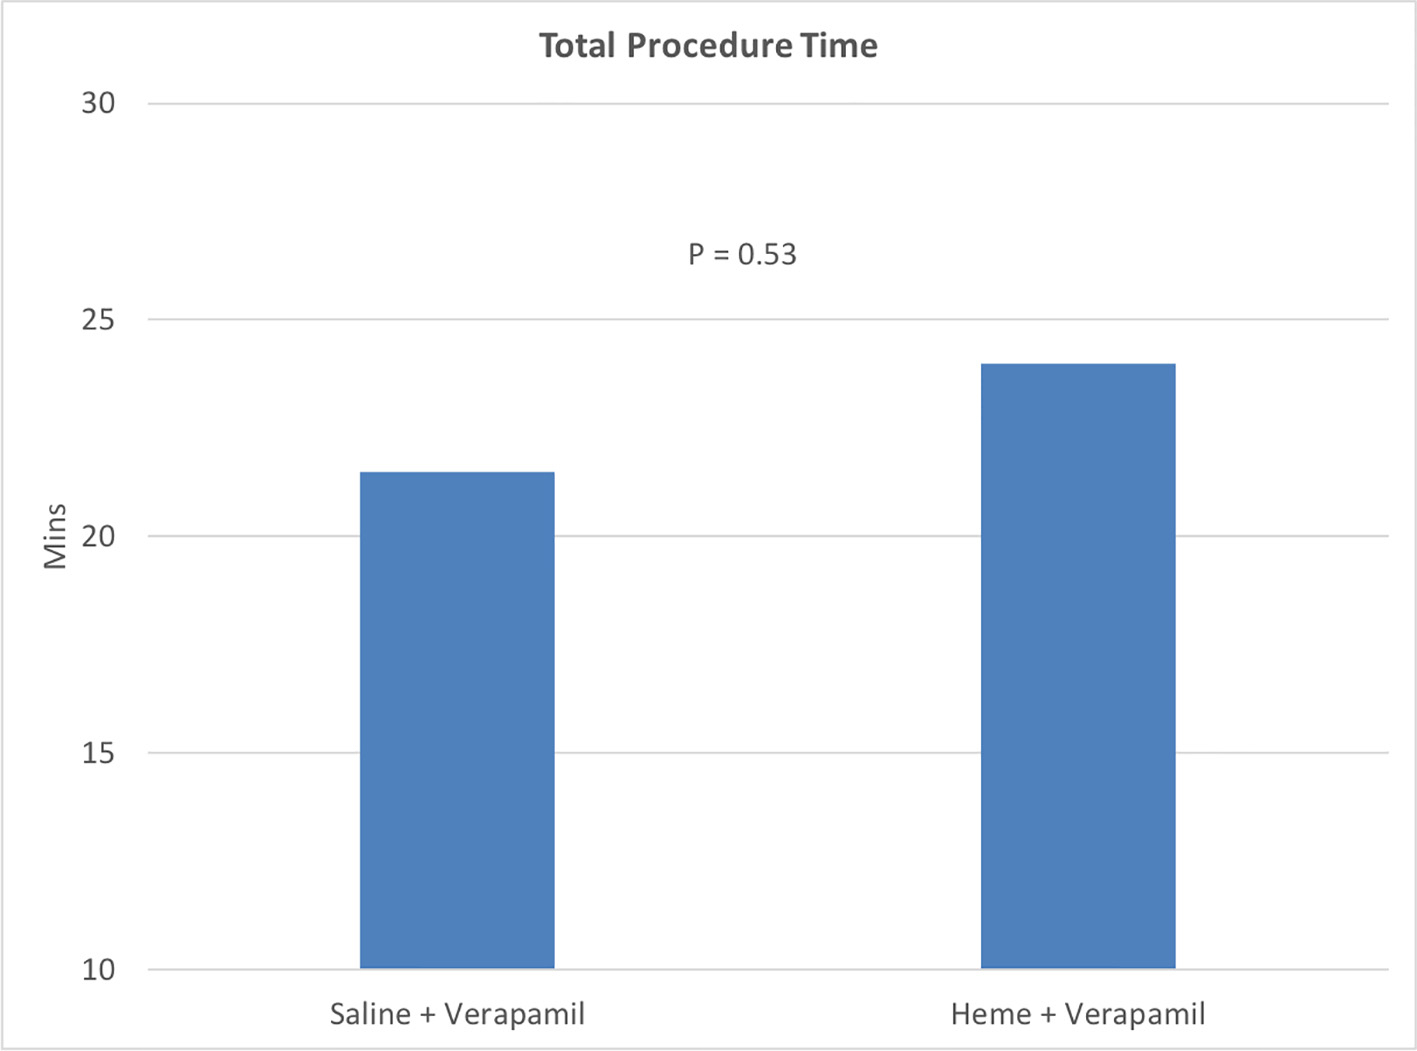
| Total procedure time (min) | 21.5 ± 21.0 | 24.0 ± 20.0 | 0.53 |
| Vasospasm | 3 (3.0%) | 0 (0.0%) | 0.12 |
| Hematoma | 1 (1.0%) | 1 (1.0%) | 1.00 |