Figures
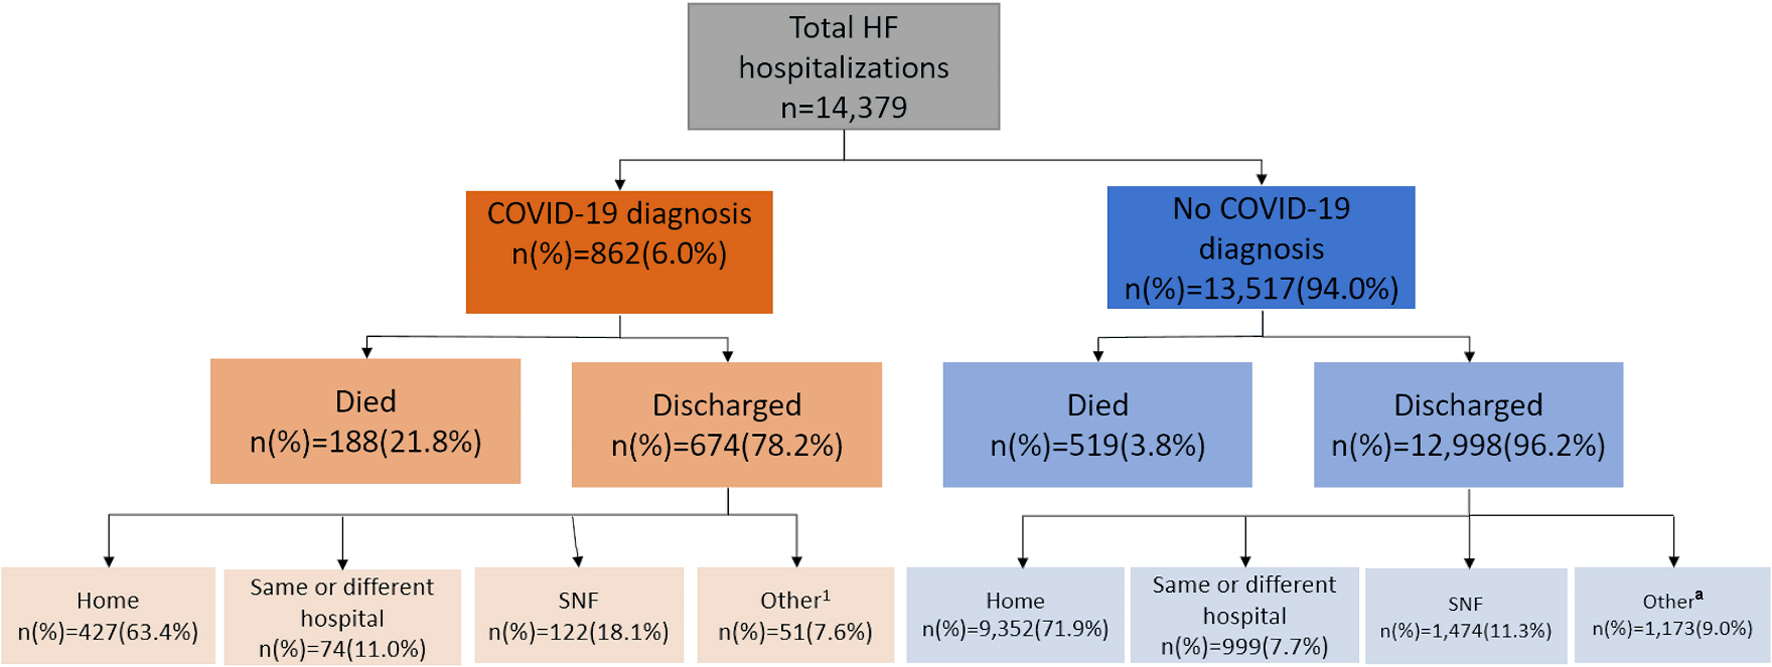
Figure 1. Summary of patients hospitalized with HF during the COVID-19 pandemic. aIncludes intermediate care facilities, court/law, hospice, rehabilitation facilities, and other stated locations. HF: heart failure; COVID-19: coronavirus disease 2019; SNF: skilled nursing facility.
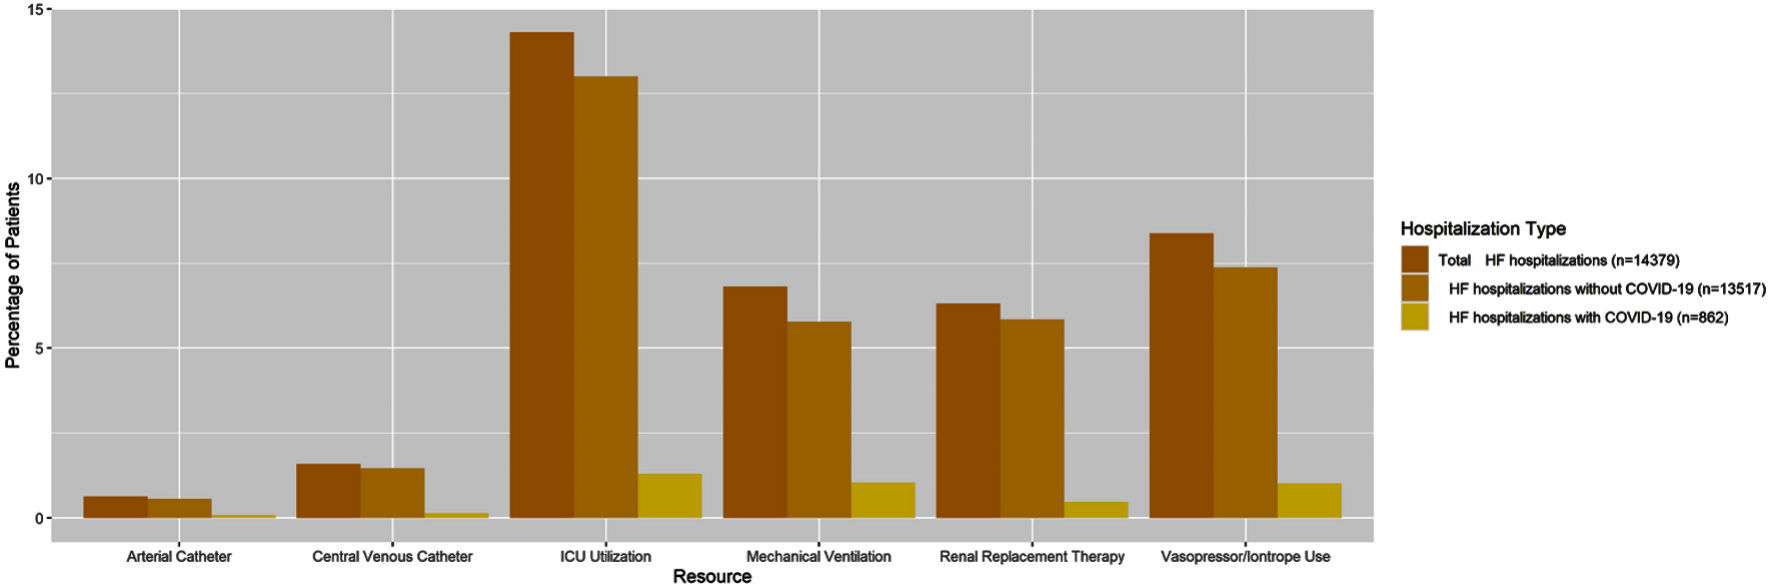
Figure 2. Hospital resource use of as a percentage of total HF patients by COVID-19 diagnosis status (n = 14,379). HF: heart failure; COVID-19: coronavirus disease 2019; ICU: intensive care unit.
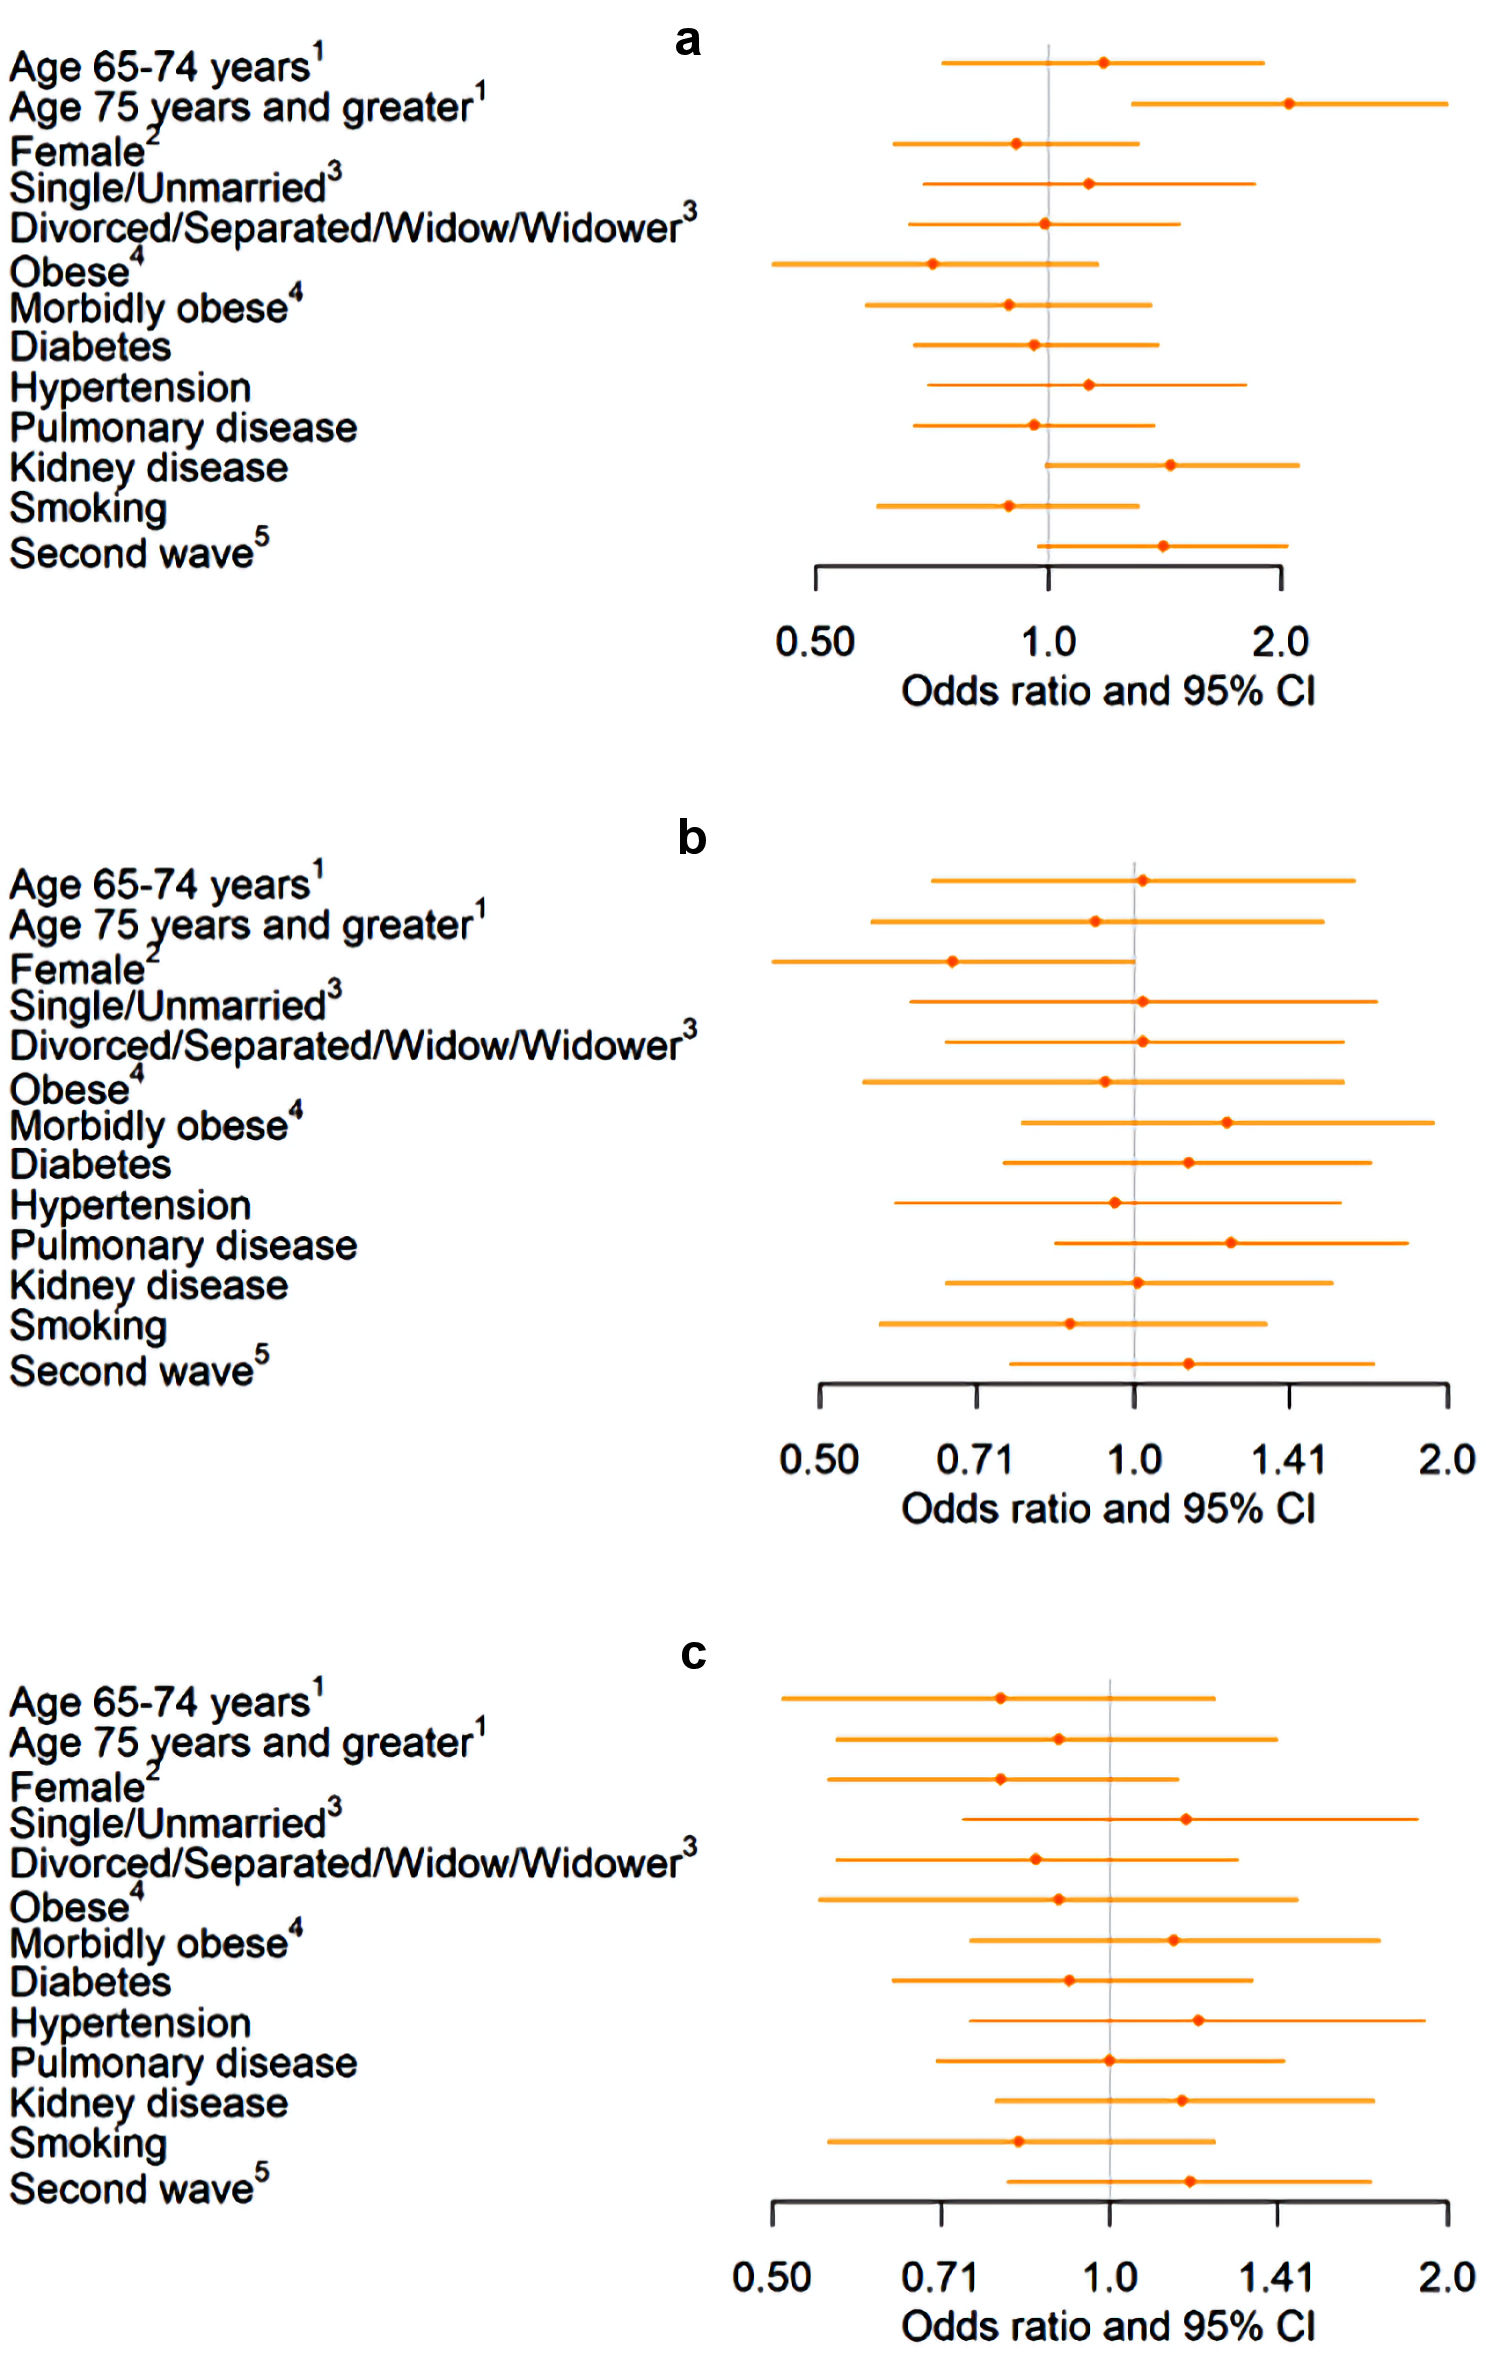
Figure 3. Association of demographics and comorbidities with mortality, mechanical ventilation, and ICU stay in a sample of HF patients diagnosed with COVID-19 (n = 862). (a) Association between demographics and comorbidities and mortality among hospitalized COVID-19 patients. (b) Association between demographics and comorbidities and mechanical ventilation among hospitalized COVID-19 patients. (c) Association between demographics and comorbidities and ICU stay among hospitalized COVID-19 patients. 1Reference: age < 65 years. 2Reference: male. 3Reference: married. 4Reference: not obese. 5Reference: first wave. HF: heart failure; COVID-19: coronavirus disease 2019; ICU: intensive care unit; CI: confidence interval.
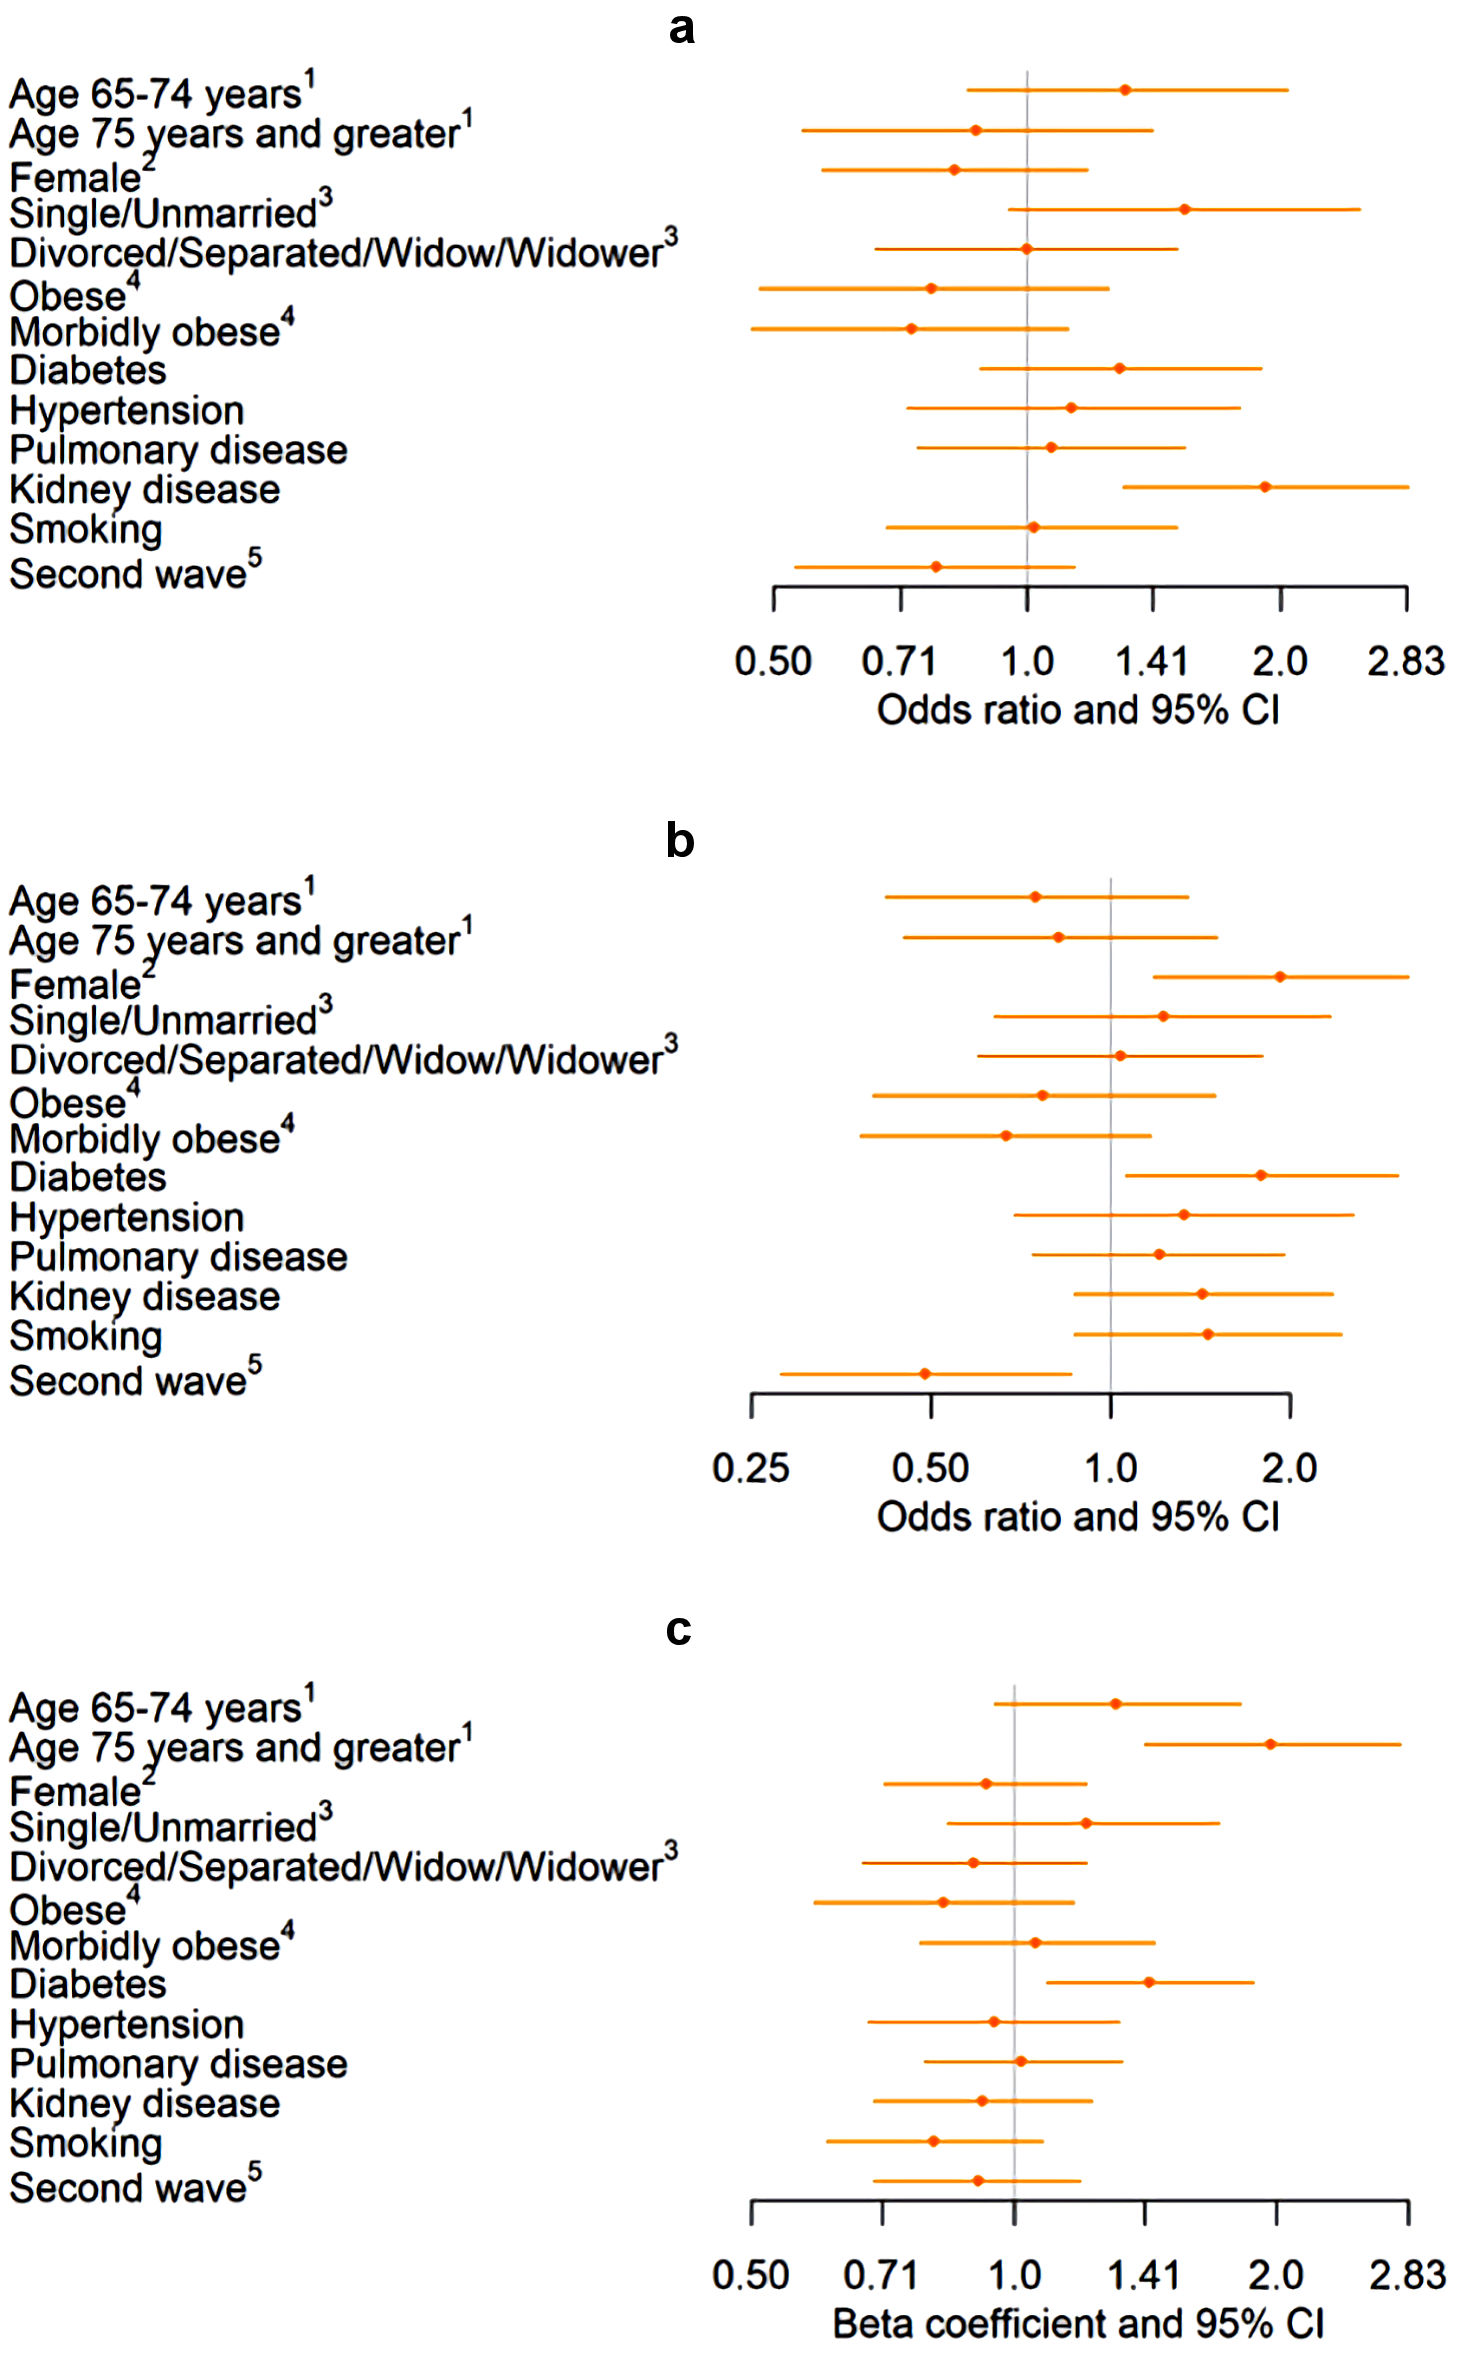
Figure 4. Association of demographics and comorbidities with re-admittance between 1 and 30 days, re-admittance between 31 and 60 days, and length of stay in a sample of HF patients diagnosed with COVID-19 (n = 862). (a) Association between demographics and comorbidities and re-admittance between 1 and 30 days among hospitalized COVID-19 patients. (b) Association between demographics and comorbidities and re-admittance between 31 and 60 days among hospitalized COVID-19 patients. (c) Association between demographics and comorbidities and length of stay among hospitalized COVID-19 patients. Values back-transformed from log10 scale. 1Reference: age < 65 years. 2Reference: male. 3Reference: married. 4Reference: not obese. 5Reference: first wave. HF: heart failure; COVID-19: coronavirus disease 2019; CI: confidence interval.
Tables
Table 1. Baseline Characteristics of a Sample of Hospitalized HF Patients Stratified by COVID-19 Diagnosis Status (N = 14,379)
| Baseline characteristics | No COVID-19 (n = 13,517) | COVID-19 (n = 862) | Total (n = 14,379) | P value |
|---|
| N | % (within row) | N | % (within row) | N | % (of total) |
|---|
| HF: heart failure; COVID-19: coronavirus disease 2019. |
| Age (years) | | | | | | | |
| 18 - 39 | 206 | 94.9 | 11 | 5.1 | 217 | 1.5 | 0.02 |
| 40 - 49 | 784 | 96.2 | 31 | 3.8 | 815 | 5.7 | - |
| 50 - 64 | 3,567 | 94.5 | 207 | 5.5 | 3,774 | 26.3 | - |
| 65 - 74 | 4,205 | 96.7 | 283 | 6.3 | 4,488 | 31.2 | - |
| 74 and older | 4,755 | 93.5 | 330 | 6.5 | 5,085 | 35.4 | - |
| Marital status | | | | | | | |
| Married | 5,501 | 93.8 | 364 | 6.2 | 5,865 | 41.1 | 0.10 |
| Single | 2,149 | 93.3 | 154 | 6.7 | 2,303 | 16.1 | - |
| Divorced/separated/widowed | 5,782 | 94.5 | 339 | 5.5 | 6,121 | 42.8 | - |
| White | | | | | | | |
| No | 373 | 93.3 | 27 | 6.8 | 400 | 2.8 | 0.52 |
| Yes | 13,144 | 94 | 835 | 6 | 13,979 | 97.2 | - |
| Gender | | | | | | | |
| Male | 6,147 | 93.4 | 433 | 6.6 | 6,580 | 45.8 | 0.01 |
| Female | 7,369 | 94.5 | 429 | 5.5 | 7,798 | 54.2 | - |
| Insurance | | | | | | | |
| Medicaid/Medicare | 12,320 | 94.1 | 778 | 5.9 | 13,098 | 91.1 | 0.37 |
| Other | 1,197 | 93.4 | 84 | 6.6 | 1,281 | 8.9 | - |
| Weight status | | | | | | | |
| Underweight | 541 | 95.6 | 25 | 4.4 | 566 | 4.1 | 0.09 |
| Normal weight | 2,850 | 94.4 | 170 | 5.6 | 3,020 | 21.7 | - |
| Overweight | 3,136 | 93.8 | 209 | 6.3 | 3,345 | 24.1 | - |
| Obese | 2,576 | 94.5 | 151 | 5.5 | 2,727 | 19.6 | - |
| Morbidly obese | 3,967 | 93.3 | 284 | 6.7 | 4,251 | 30.6 | - |
| Asthma | | | | | | | |
| No | 13,331 | 94 | 854 | 6 | 14,185 | 98.7 | 0.27 |
| Yes | 186 | 95.9 | 8 | 4.1 | 194 | 1.4 | - |
| Diabetes | | | | | | | |
| No | 6,357 | 94.3 | 385 | 5.7 | 6,742 | 46.9 | 0.18 |
| Yes | 7,160 | 93.8 | 477 | 6.3 | 7,637 | 53.1 | - |
| Hypertension | | | | | | | |
| No | 2,356 | 93.6 | 162 | 6.4 | 2,518 | 17.5 | 0.31 |
| Yes | 11,161 | 94.1 | 700 | 5.9 | 11,861 | 82.5 | - |
| Anemia | | | | | | | |
| No | 12,620 | 94 | 812 | 6.1 | 13,432 | 93.4 | 0.34 |
| Yes | 897 | 94.7 | 50 | 5.3 | 947 | 6.6 | - |
| Hepatitis | | | | | | | |
| No | 946 | 88.3 | 125 | 11.7 | 1071 | 88.7 | 0.32 |
| Yes | 124 | 91.2 | 12 | 8.8 | 136 | 11.3 | - |
| Valvular heart disease | | | | | | | |
| No | 12,528 | 93.9 | 812 | 6.1 | 13,340 | 92.8 | 0.10 |
| Yes | 989 | 95.2 | 50 | 4.8 | 1,039 | 7.2 | - |
| Pulmonary disease | | | | | | | |
| No | 5,676 | 93.3 | 409 | 6.7 | 6,085 | 42.3 | < 0.01 |
| Yes | 7,841 | 94.5 | 453 | 5.5 | 8,294 | 57.7 | - |
| Kidney disease | | | | | | | |
| No | 9,526 | 93.9 | 624 | 6.2 | 10,150 | 70.6 | 0.23 |
| Yes | 3,991 | 94.4 | 238 | 5.6 | 4,229 | 29.4 | - |
| End-stage renal disease | | | | | | | |
| No | 12,713 | 94 | 807 | 6 | 13,520 | 94 | 0.60 |
| Yes | 804 | 93.6 | 55 | 6.4 | 859 | 6 | - |
| Malignancy | | | | | | | |
| No | 12,888 | 93.9 | 835 | 6.1 | 13,723 | 95.4 | 0.04 |
| Yes | 629 | 95.9 | 27 | 4.1 | 656 | 4.6 | - |
| Smoking | | | | | | | |
| No | 7,968 | 93 | 599 | 7 | 8,567 | 59.6 | <0.01 |
| Yes | 5,549 | 95.5 | 263 | 4.5 | 5,812 | 40.4 | - |
Table 2. Adjusted and Unadjusted Results for the Association of COVID-19 Diagnosis and Multiple Outcomes in a Sample of Hospitalized HF Patients (N = 14,379)
| Wave 1 (April 1, 2020 to May 31, 2021) | Wave 2 (June 1, 2021 to October 19, 2021) |
|---|
| *P ≤ 0.05. aAdjusted for age, gender, marital status, obesity status, diabetes, hypertension, pulmonary disease, kidney disease, and smoking. HF: heart failure; COVID-19: coronavirus disease 2019; ICU: intensive care unit; OR: odds ratio; CI: confidence interval. |
| Mortality | | |
| Unadjusted OR (95% CI) | 6.55 (5.21 - 8.23)* | 7.04 (5.04 - 9.85)* |
| Adjusted OR (95% CI)a | 6.21 (4.88 - 7.91)* | 7.47 (5.27 - 10.60)* |
| Mechanical ventilation | | |
| Unadjusted OR (95% CI) | 2.98 (2.34 - 3.78)* | 3.93 (2.78 - 5.56)* |
| Adjusted OR (95% CI)a | 3.40 (2.63 - 4.34)* | 3.78 (2.63 - 5.41)* |
| ICU stay | | |
| Unadjusted OR (95% CI) | 1.57 (1.26 - 1.94)* | 1.71 (1.26 - 2.31)* |
| Adjusted OR (95% CI)a | 1.62 (1.30 - 2.02)* | 1.66 (1.22 - 2.26)* |
| 1 - 30 days re-admittance | | |
| Unadjusted OR (95% CI) | 1.18 (0.96 - 1.45) | 1.12 (0.82 - 1.52) |
| Adjusted OR (95% CI)a | 1.25 (1.01 - 1.54)* | 1.18 (0.86 - 1.60) |
| 31 - 60 days re-admittance | | |
| Unadjusted OR (95% CI) | 0.65 (0.50 - 0.84)* | 0.44 (0.27 - 0.71)* |
| Adjusted OR (95% CI)a | 0.66 (0.51 - 0.86)* | 0.46 (0.28 - 0.75)* |
| Length of stay in days | | |
| Unadjusted beta coefficient (95% CI) | 1.59 (1.49 - 1.69)* | 1.42 (1.30 - 1.55)* |
| Adjusted beta coefficient (95% CI)a | 1.56 (1.47 - 1.66)* | 1.42 (1.30 - 1.55)* |