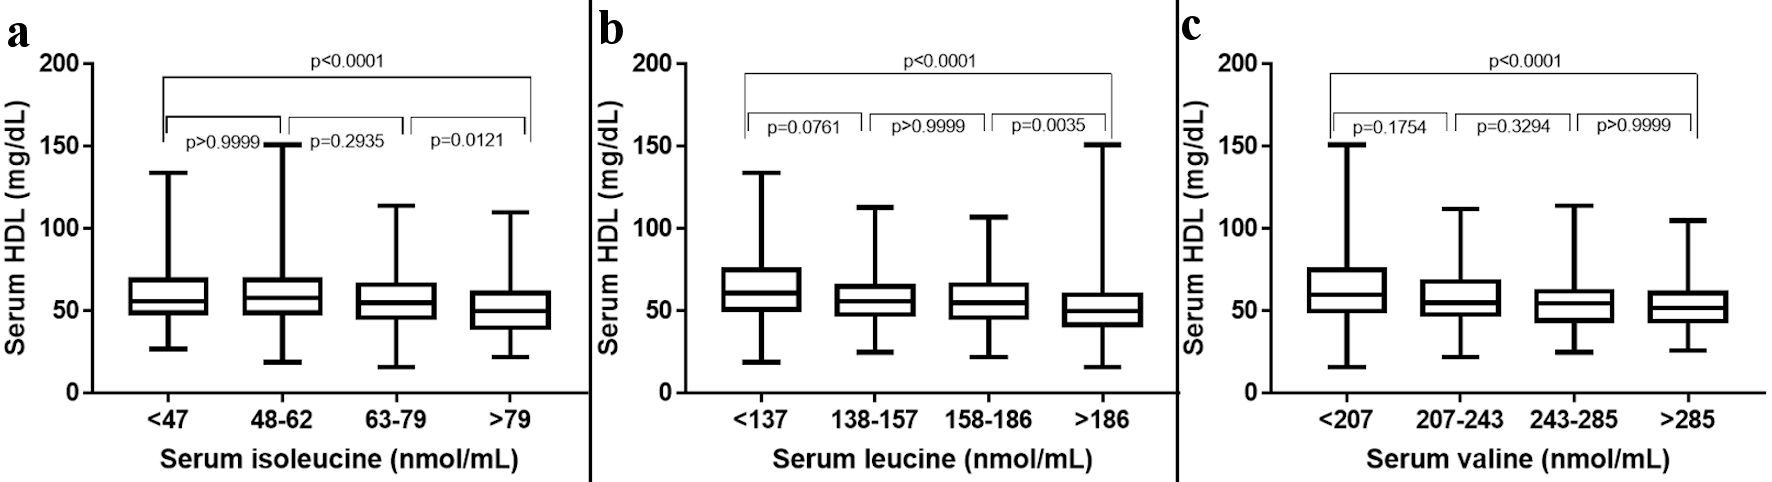
Figure 1. The 25th, 50th, and 75th percentiles were used as cut-off points to stratify participants according to the plasma levels of individual BCAAs. HDL: high-density lipoprotein; BCAAs: branched-chain amino acids.
| Cardiology Research, ISSN 1923-2829 print, 1923-2837 online, Open Access |
| Article copyright, the authors; Journal compilation copyright, Cardiol Res and Elmer Press Inc |
| Journal website https://www.cardiologyres.org |
Original Article
Volume 14, Number 3, June 2023, pages 167-175
Preliminary Study on the Association of Serum Branched-Chain Amino Acids With Lipid and Hepatic Markers
Figures
Tables
| Biomarker | Mean ± SD |
|---|---|
| SD: standard deviation; LDL: low-density lipoprotein. | |
| Gender (n = 714) | |
| Male | 47.22 ± 16.88 |
| Female | 49.34 ± 16.59 |
| Cardiac markers (mg/dL) | |
| Cholesterol | 182.5 ± 43.04 |
| High-density lipoprotein | 57.51 ± 17.29 |
| Triglyceride | 92.22 ± 61.68 |
| Low-density lipoprotein | 115.7 ± 38.75 |
| Apolipoprotein A1 | 165.1 ± 37.4 |
| Apolipoprotein B | 92.19 ± 25.73 |
| Lipoprotein (a) | 37.45 ± 39.97 |
| N-terminal pro-B-type natriuretic peptide | 93.37 ± 238.5 |
| Small dense LDL | 28.49 ± 11.69 |
| High-sensitivity C-reactive protein | 2.436 ± 6.864 |
| Homocysteine | 9.655 ± 3.617 |
| Oxidized LDL | 44.44 ± 19.35 |
| Myeloperoxidase | 1102 ± 929.2 |
| Lipoprotein-associated phospholipase A2 | 163 ± 43.13 |
| Hepatic markers (U/L) | |
| Alanine transaminase (ALT) | 26.05 ± 38.1 |
| Aspartate transaminase (AST) | 27.51 ± 38.04 |
| Total bilirubin | 0.5558 ± 0.318 |
| Total protein | 7.154 ± 0.5635 |
| Albumin | 4.686 ± 0.418 |
| Alkaline phosphatase (ALK) | 73.58 ± 32.23 |
| Isoleucine quartile range | |||||
|---|---|---|---|---|---|
| Q1 (< 47) | Q2 (48 - 62) | Q3 (63 - 79) | Q4 (> 79) | P valuea | |
| aP values among the T-BCAA quartiles were obtained using the analysis of variance or the Kruskal-Wallis test. LDL: low-density lipoprotein; T-BCAA: total BCAA. | |||||
| N | 179 | 178 | 178 | 178 | |
| Cholesterol | 184.8 ± 40.9 | 182.8 ± 43.5 | 185.5 ± 44.5 | 177.1 ± 42.9 | 0.4425 |
| High-density lipoprotein | 60.96 ± 18.7 | 60.08 ± 17.0 | 57.09 ± 16.5 | 51.88 ± 15.4 | < 0.0001 |
| Triglyceride | 88.0 ± 43.9 | 84.4 ± 43.6 | 89.5 ± 47.6 | 106.9 ± 94.2 | 0.0223 |
| Low-density lipoprotein | 118.8 ± 39.8 | 114.3 ± 39.1 | 116.9 ± 39.8 | 112.7 ± 36.1 | 0.7016 |
| Apolipoprotein A1 | 168.2 ± 37.5 | 168.6 ± 38.9 | 166.9 ± 37.3 | 156.5 ± 34.6 | 0.0117 |
| Apolipoprotein B | 93.4 ± 26.1 | 90.8 ± 25.1 | 94.0 ± 27.2 | 90.4 ± 24.1 | 0.6524 |
| Lipoprotein (a) | 43.1 ± 44.3 | 36.1 ± 39.3 | 31.6 ± 34.5 | 39.1 ± 40.7 | 0.2088 |
| N-terminal pro-B-type natriuretic peptide | 94.27 ± 195.8 | 119.3 ± 385.5 | 145.5 ± 925.3 | 84.45 ± 176.7 | 0.0007 |
| Small dense LDL | 27.6 ± 12.0 | 27.5 ± 10.3 | 29.7 ± 12.4 | 28.9 ± 11.8 | 0.1163 |
| High-sensitivity C-reactive protein | 2.1 ± 4.6 | 3.5 ± 11.2 | 1.7 ± 4.0 | 2.3 ± 4.9 | 0.5935 |
| Homocysteine | 9.2 ± 3.4 | 9.3 ± 3.5 | 9.4 ± 2.9 | 10.5 ± 4.2 | 0.0007 |
| Oxidized LDL | 46.01 ± 21.6 | 42.9 ± 18.1 | 43.3 ± 19.5 | 45.4 ± 17.6 | 0.3754 |
| Myeloperoxidase | 1,041 ± 852.6 | 1,061 ± 903.4 | 1,139 ± 923.7 | 1,167 ± 1032 | 0.9008 |
| Lipoprotein-associated phospholipase A2 | 162.9 ± 45.9 | 160.6 ± 42.4 | 162.5 ± 43.5 | 165.9 ± 40.6 | 0.6616 |
| Alanine transaminase (ALT) | 25.8 ± 30.7 | 28.3 ± 66.3 | 22.4 ± 12.6 | 27.6 ± 17.2 | 0.0002 |
| Aspartate transaminase (AST) | 29.3 ± 52.9 | 28.0 ± 44.6 | 26.0 ± 28.9 | 26.5 ± 13.1 | 0.861 |
| Total bilirubin | 0.53 ± 0.26 | 0.57 ± 0.32 | 0.56 ± 0.35 | 0.55 ± 0.32 | 0.9263 |
| Total protein | 7.1 ± 0.52 | 7.1 ± 0.55 | 7.2 ± 0.63 | 7.0 ± 0.52 | 0.4228 |
| Albumin | 4.7 ± 0.4 | 4.6 ± 0.3 | 4.7 ± 0.4 | 4.6 ± 0.4 | 0.191 |
| Alkaline phosphatase (ALK) | 73.8 ± 26.6 | 69.7 ± 26.0 | 76.3 ± 34.3 | 74.4 ± 39.8 | 0.1666 |
| Leucine quartile range | |||||
|---|---|---|---|---|---|
| Q1 (< 137) | Q2 (138 - 157) | Q3 (158 - 186) | Q4 (> 186) | P valuea | |
| aP values among the T-BCAA quartiles were obtained using the analysis of variance or the Kruskal-Wallis test. LDL: low-density lipoprotein; T-BCAA: total BCAA. | |||||
| N | 179 | 178 | 178 | 178 | |
| Cholesterol | 182.2 ± 39.6 | 183.8 ± 42.5 | 189.5 ± 47.2 | 174.8 ± 41.4 | 0.0161 |
| High-density lipoprotein | 62.9 ± 17.8 | 58.3 ± 17.1 | 57.3 ± 17.1 | 51.45 ± 16.5 | < 0.0001 |
| Triglyceride | 83.78 ± 41.9 | 86.21 ± 41.9 | 90.34 ± 51.6 | 108.6 ± 93.3 | 0.0012 |
| Low-density lipoprotein | 109.6 ± 35.3 | 117.4 ± 40.1 | 122.8 ± 41.0 | 113.1 ± 37.3 | 0.0086 |
| Apolipoprotein A1 | 176.5 ± 38.1 | 167.7 ± 34.3 | 163.3 ± 37.0 | 152.7 ± 36.2 | < 0.0001 |
| Apolipoprotein B | 87.6 ± 23.0 | 92.9 ± 25.9 | 96.5 ± 27.8 | 91.6 ± 25.2 | 0.0151 |
| Lipoprotein (a) | 32.6 ± 32.7 | 42.8 ± 43.3 | 42.2 ± 47.8 | 32.0 ± 33.1 | 0.0849 |
| N-terminal pro-B-type natriuretic peptide | 121.1 ± 352.8 | 80.81 ± 112.2 | 106.4 ± 273.2 | 137.5 ± 946.7 | < 0.0001 |
| Small dense LDL | 25.7 ± 9.4 | 28.02 ± 11.4 | 30.59 ± 13.2 | 29.57 ± 11.8 | 0.0004 |
| High-sensitivity C-reactive protein | 2.1 ± 4.8 | 2.3 ± 6.6 | 2.8 ± 9.9 | 2.3 ± 4.8 | 0.4858 |
| Homocysteine | 8.9 ± 3.2 | 10.0 ± 4.2 | 9.4 ± 3.2 | 10.1 ± 3.5 | 0.0003 |
| Oxidized LDL | 45.6 ± 19.5 | 43.1 ± 19.7 | 43.2 ± 19.0 | 45.8 ± 19.1 | 0.3837 |
| Myeloperoxidase | 1,113 ± 953.9 | 1,016 ± 819.9 | 1,063 ± 897.3 | 1,217 ± 1031 | 0.3047 |
| Lipoprotein-associated phospholipase A2 | 149.9 ± 41.8 | 164.7 ± 41.1 | 170.7 ± 43.9 | 166.7 ± 42.9 | < 0.0001 |
| Alanine transaminase (ALT) | 22.4 ± 19.4 | 23.2 ± 11.6 | 26.6 ± 29.0 | 31.8 ± 66.3 | < 0.0001 |
| Aspartate transaminase (AST) | 24.6 ± 16.2 | 25 ± 9.2 | 30.5 ± 58.6 | 29.7 ± 44.7 | 0.0233 |
| Total bilirubin | 0.50 ± 0.27 | 0.54 ± 0.26 | 0.58 ± 0.31 | 0.59 ± 0.39 | 0.0209 |
| Total protein | 7.06 ± 0.51 | 7.1 ± 0.51 | 7.1 ± 0.52 | 7.2 ± 0.67 | 0.1506 |
| Albumin | 4.6 ± 0.37 | 4.6 ± 0.33 | 4.6 ± 0.42 | 4.7 ± 0.51 | 0.1036 |
| Alkaline phosphatase (ALK) | 73.17 ± 36.0 | 75.24 ± 36.6 | 71.37 ± 24.1 | 74.54 ± 30.5 | 0.2264 |
| Valine quartile range | |||||
|---|---|---|---|---|---|
| Q1 (< 207) | Q2 (207 - 243) | Q3 (243 - 285) | Q4 (> 285) | P valuea | |
| aP values among the T-BCAA quartiles were obtained using the analysis of variance or the Kruskal-Wallis test. LDL: low-density lipoprotein; T-BCAA: total BCAA. | |||||
| N | 179 | 178 | 176 | 180 | |
| Cholesterol | 184.7 ± 43.7 | 182.8 ± 38.9 | 183.7 ± 44.0 | 179 ± 45.2 | 0.5521 |
| High-density lipoprotein | 62.77 ± 19.33 | 58.72 ± 17.3 | 55.38 ± 15.93 | 53.16 ± 14.85 | < 0.0001 |
| Triglyceride | 83.69 ± 34.08 | 91.68 ± 51.51 | 90.65 ± 52.99 | 102.8 ± 91.31 | 0.0656 |
| Low-density lipoprotein | 112.2 ± 39.3 | 115.6 ± 36.5 | 119.6 ± 39.0 | 115.5 ± 39.8 | 0.1488 |
| Apolipoprotein A1 | 174.7 ± 41.9 | 167.4 ± 37.1 | 160.3 ± 34.2 | 157.8 ± 33.4 | < 0.0001 |
| Apolipoprotein B | 89.44 ± 25.5 | 91.88 ± 25.0 | 94.49 ± 25.8 | 92.99 ± 26.3 | 0.1266 |
| Lipoprotein (a) | 37.07 ± 39.2 | 37.53 ± 39.7 | 35.98 ± 37.7 | 39.27 ± 43.4 | 0.988 |
| N-terminal pro-B-type natriuretic peptide | 109.6 ± 338.2 | 96.8 ± 210.7 | 68.01 ± 93.8 | 168.2 ± 945.2 | 0.0139 |
| Small dense LDL | 27.1 ± 11.3 | 28.2 ± 11.2 | 29.7 ± 12.9 | 28.7 ± 11.1 | 0.1352 |
| High-sensitivity C-reactive protein | 3.1 ± 10.1 | 2.1 ± 5.0 | 1.9 ± 4.3 | 2.4 ± 6.2 | 0.1159 |
| Homocysteine | 9.13 ± 3.2 | 10.05 ± 4.0 | 9.5 ± 3.2 | 9.8 ± 3.8 | 0.0443 |
| Oxidized LDL | 47.02 ± 21.2 | 40.5 ± 18.3 | 46.7 ± 19.1 | 43.67 ± 18.0 | 0.008 |
| Myeloperoxidase | 1,085 ± 836.8 | 1,179 ± 1,083 | 1,123 ± 983.3 | 1,025 ± 796.1 | 0.94 |
| Lipoprotein-associated phospholipase A2 | 152.9 ± 43.5 | 165.1 ± 43.5 | 167.9 ± 40.9 | 166 ± 43.1 | 0.0056 |
| Alanine transaminase (ALT) | 20.74 ± 14.4 | 27.46 ± 29.3 | 30.02 ± 66.3 | 26.06 ± 19.1 | < 0.0001 |
| Aspartate transaminase (AST) | 24.03 ± 14.0 | 29.95 ± 51.8 | 28.68 ± 44.7 | 27.4 ± 30.1 | 0.0293 |
| Total bilirubin | 0.51 ± 0.26 | 0.55 ± 0.28 | 0.58 ± 0.36 | 0.56 ± 0.3 | 0.2668 |
| Total protein | 7.09 ± 0.56 | 7.2 ± 0.51 | 7.1 ± 0.55 | 7.1 ± 0.61 | 0.0795 |
| Albumin | 4.5 ± 0.44 | 4.75 ± 0.38 | 4.68 ± 0.33 | 4.71 ± 0.48 | 0.0162 |
| Alkaline phosphatase (ALK) | 72.22 ± 27.3 | 72.35 ± 31.9 | 78.74 ± 42.6 | 71.08 ± 23.7 | 0.3241 |
| Isoleucine | Leucine | Valine | ||||
|---|---|---|---|---|---|---|
| r | P (two-tailed) | r | P (two-tailed) | r | P (two-tailed) | |
| BCAA: branched-chain amino acid; LDL: low-density lipoprotein. | ||||||
| Cholesterol | -0.07 | 0.05 | -0.06 | 0.10 | -0.04 | 0.27 |
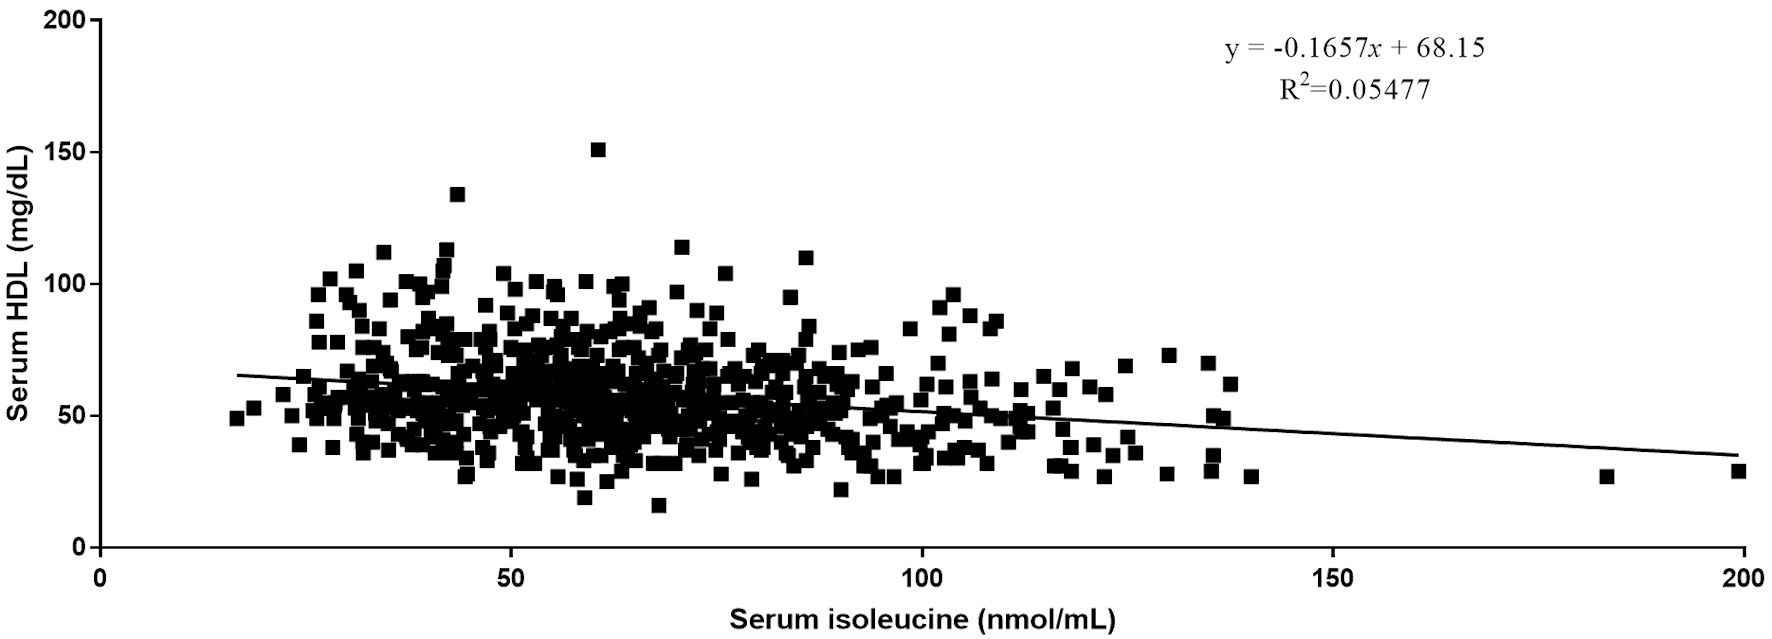
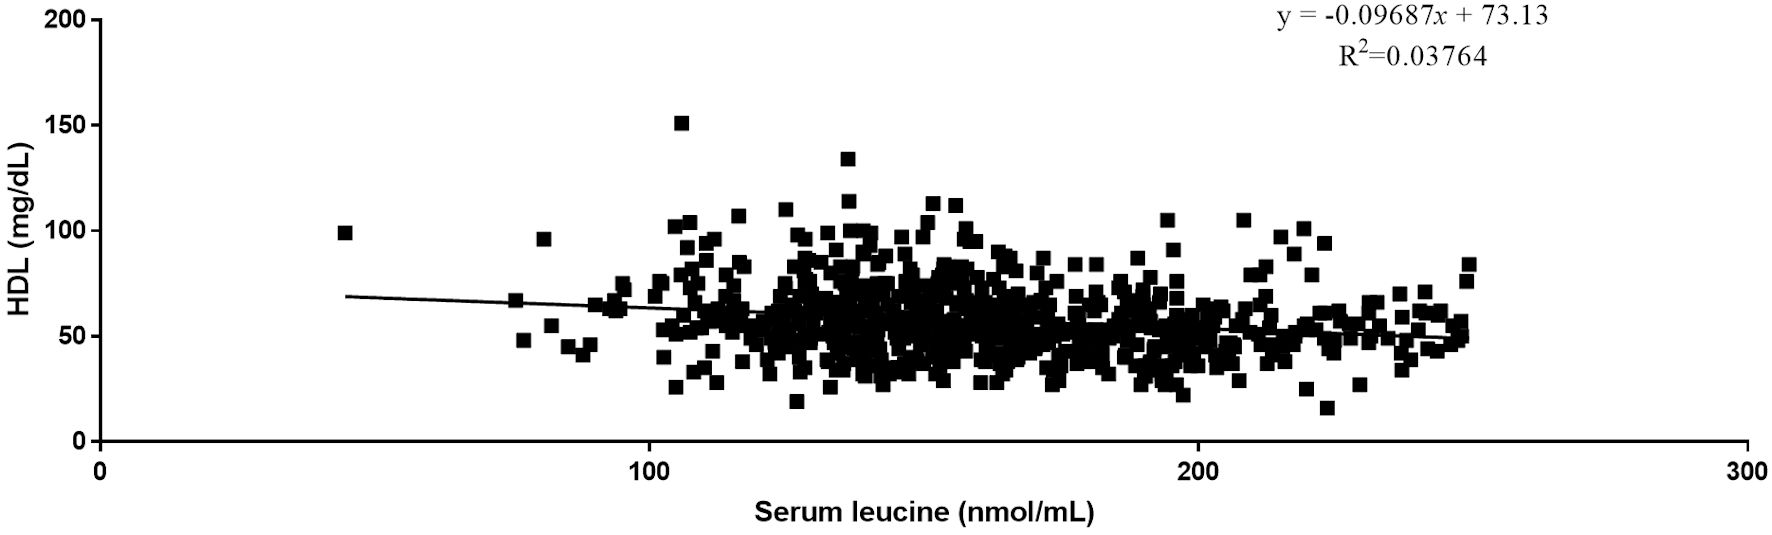
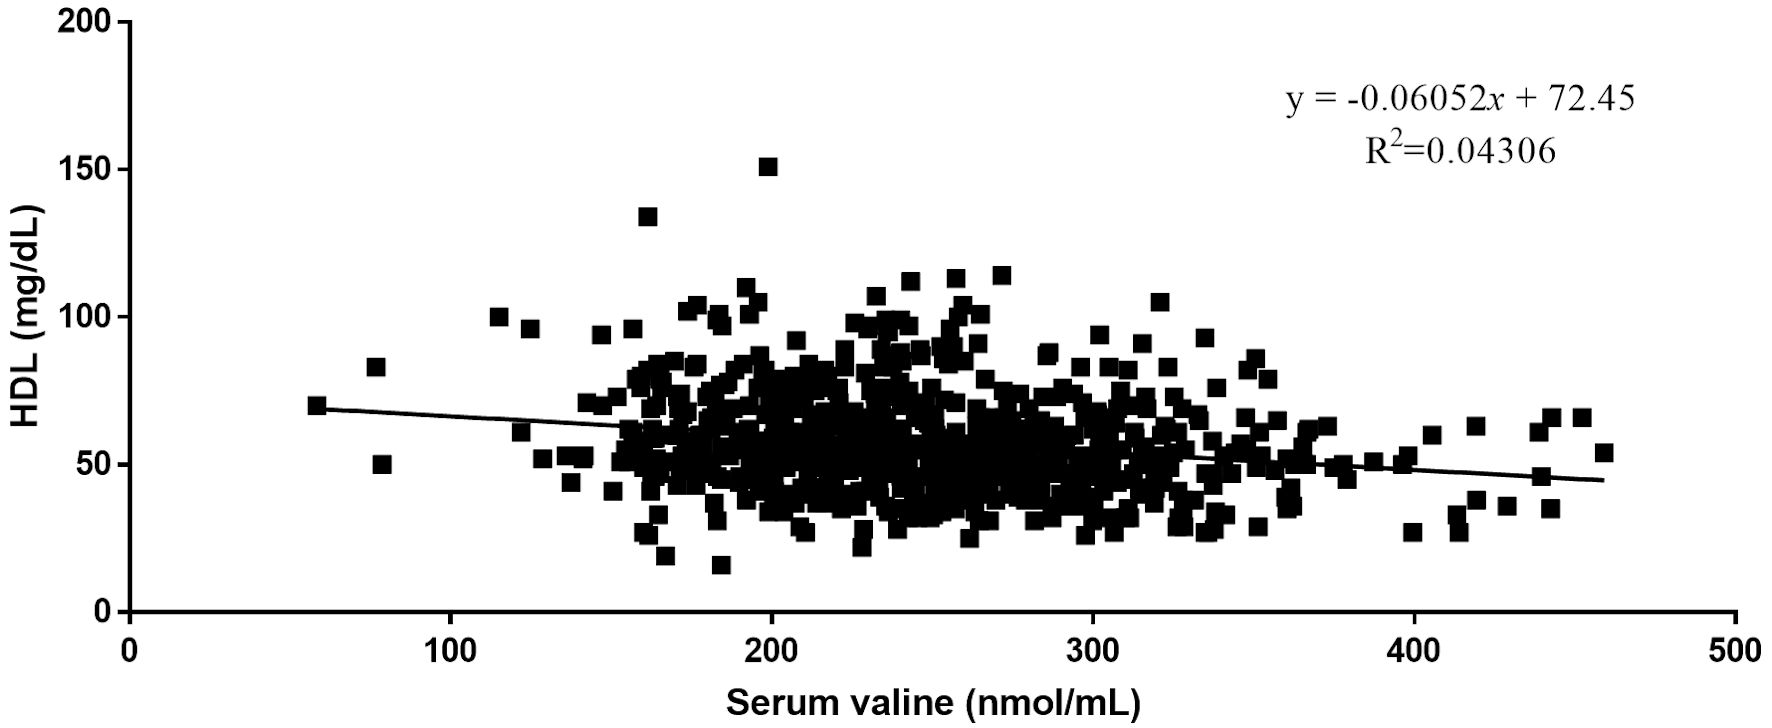
| High-density lipoprotein | -0.22 | < 0.0001 | -0.24 | < 0.0001 | -0.19 | < 0.0001 |
| Triglyceride | 0.15 | < 0.0001 | 0.16 | < 0.0001 | 0.10 | 0.01 |
| Low-density lipoprotein | -0.05 | 0.23 | 0.03 | 0.36 | 0.03 | 0.40 |
| Apolipoprotein A1 | -0.13 | 0.00 | -0.23 | < 0.0001 | -0.16 | < 0.0001 |
| Apolipoprotein B | -0.03 | 0.45 | 0.06 | 0.13 | 0.04 | 0.29 |
| Lipoprotein (a) | -0.04 | 0.33 | -0.03 | 0.49 | 0.02 | 0.72 |
| N-terminal pro-B-type natriuretic peptide | -0.02 | 0.62 | 0.03 | 0.39 | 0.08 | 0.03 |
| Small dense LDL | 0.05 | 0.22 | 0.14 | 0.00 | 0.05 | 0.21 |
| High-sensitivity C-reactive protein | -0.01 | 0.85 | -0.02 | 0.62 | -0.02 | 0.64 |
| Homocysteine | 0.10 | 0.01 | 0.09 | 0.02 | 0.07 | 0.08 |
| Oxidized LDL | 0.01 | 0.79 | -0.01 | 0.85 | -0.03 | 0.42 |
| Myeloperoxidase | 0.03 | 0.40 | 0.06 | 0.14 | -0.03 | 0.39 |
| Lipoprotein-associated phospholipase A2 | 0.01 | 0.82 | 0.12 | 0.00 | 0.10 | 0.01 |
| Alanine transaminase (ALT) | 0.00 | 0.94 | 0.08 | 0.03 | 0.04 | 0.26 |
| Aspartate transaminase (AST) | -0.03 | 0.49 | 0.05 | 0.21 | 0.01 | 0.79 |
| Total bilirubin | 0.00 | 0.91 | 0.11 | 0.00 | 0.07 | 0.06 |
| Total protein | -0.02 | 0.68 | 0.09 | 0.01 | 0.05 | 0.17 |
| Albumin | -0.07 | 0.07 | 0.12 | 0.00 | 0.08 | 0.03 |
| Alkaline phosphatase (ALK) | 0.03 | 0.45 | 0.02 | 0.66 | 0.02 | 0.67 |