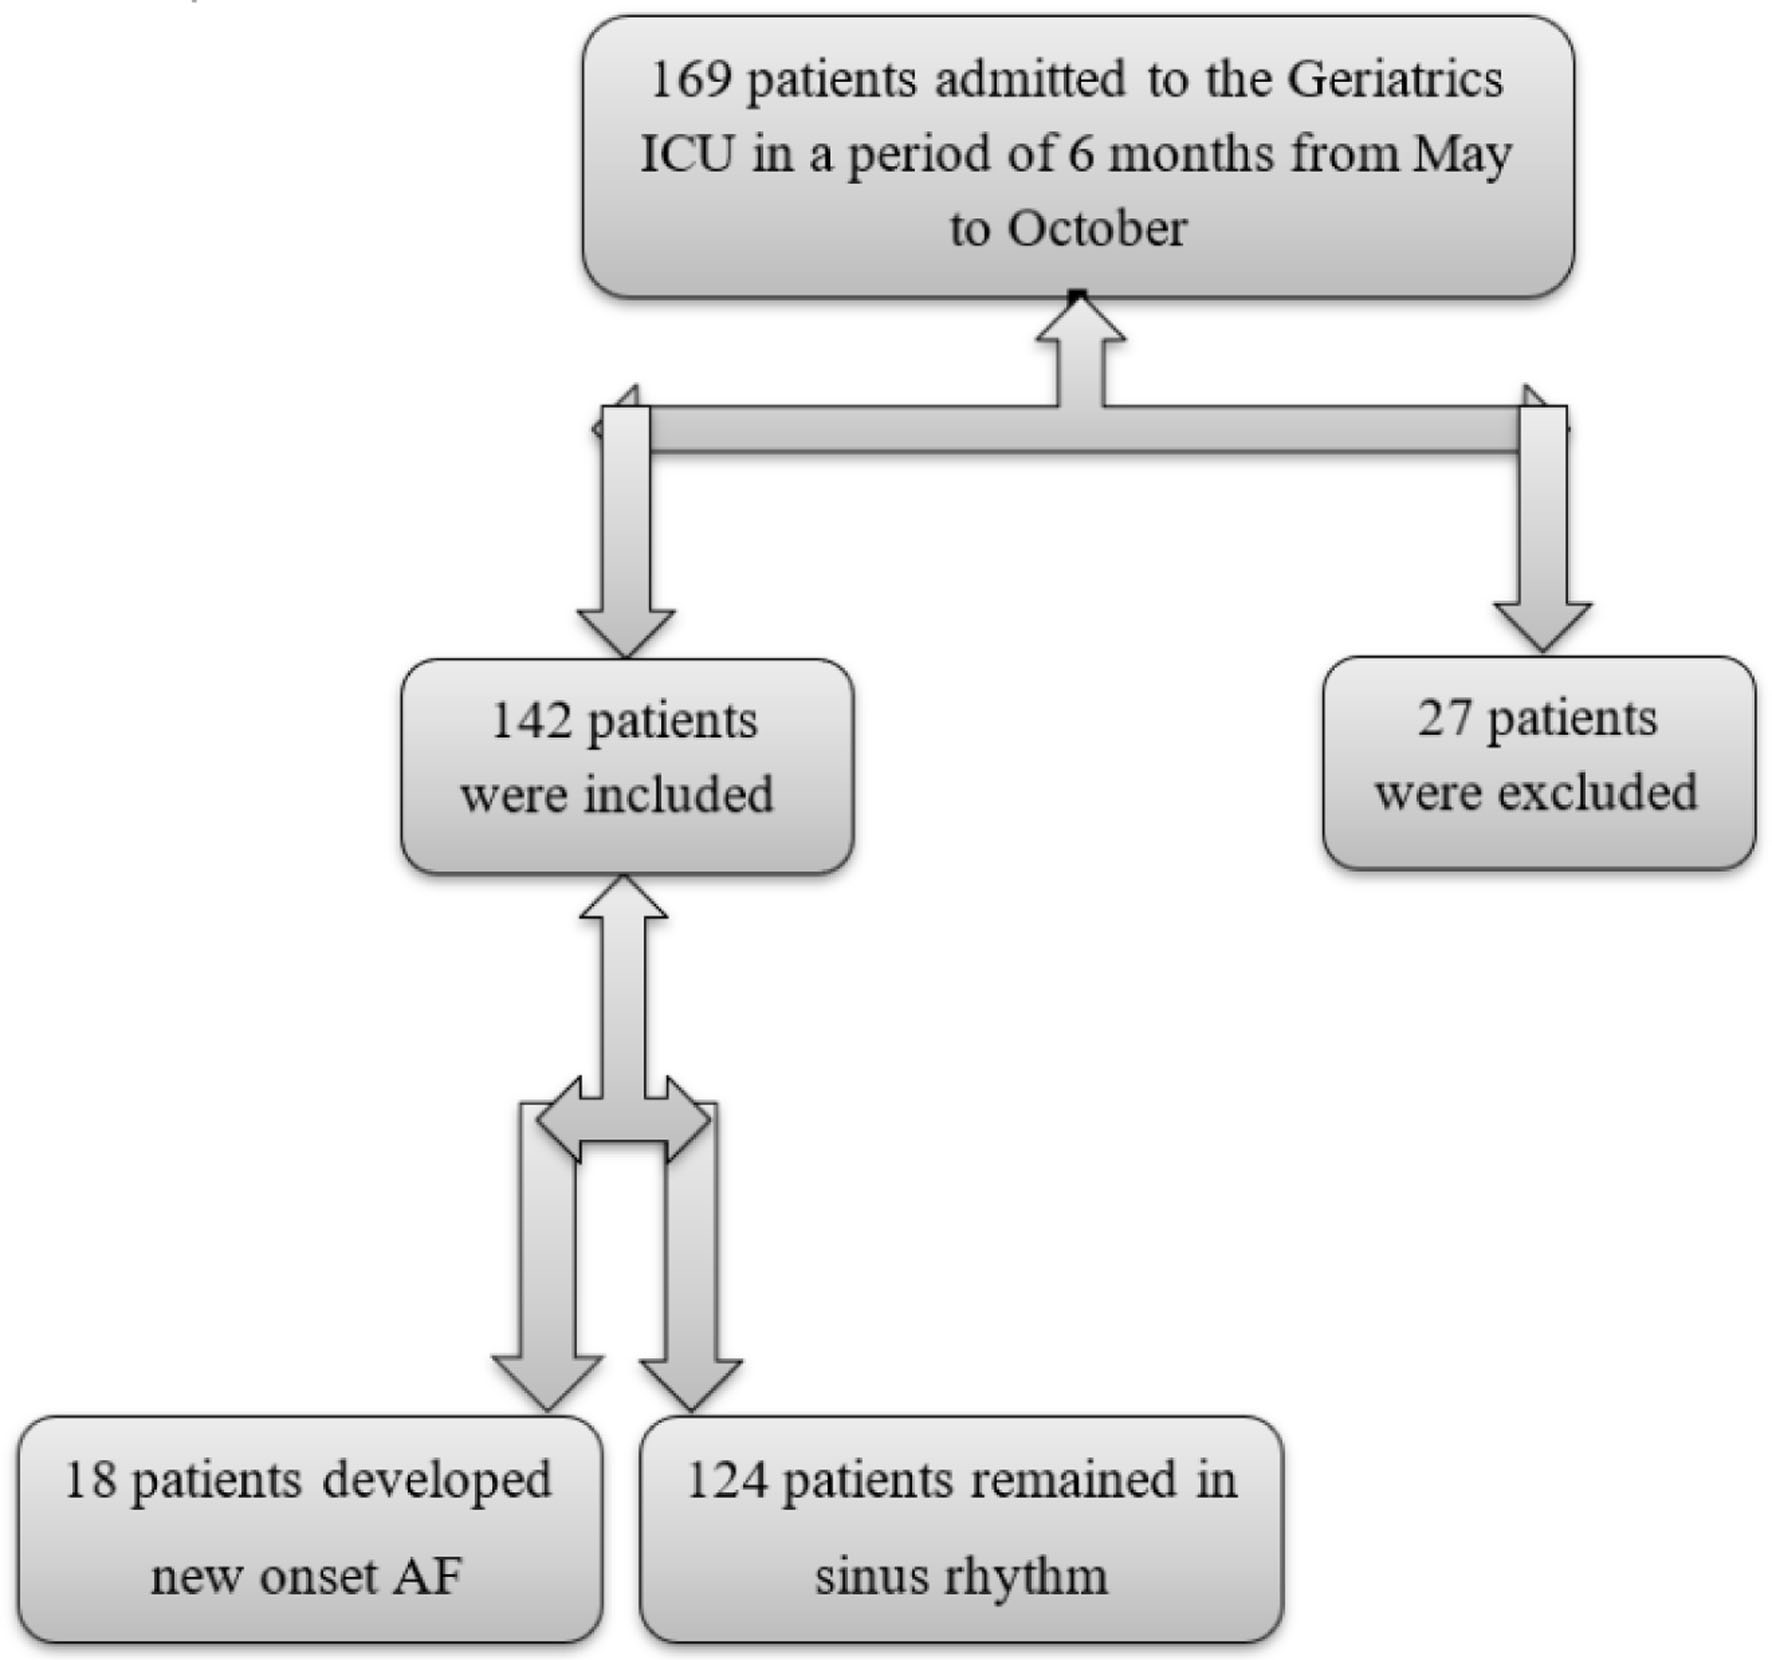
Figure 1. Study flow chart.
| Cardiology Research, ISSN 1923-2829 print, 1923-2837 online, Open Access |
| Article copyright, the authors; Journal compilation copyright, Cardiol Res and Elmer Press Inc |
| Journal website https://www.cardiologyres.org |
Original Article
Volume 14, Number 2, April 2023, pages 106-114
Triggers of Atrial Fibrillation in the Geriatric Medical Intensive Care Unit: An Observational Study
Figures
Tables
| Stay sinus (n = 124) | Converted to AF (n = 18) | P value | |
|---|---|---|---|
| *P ≤ 0.05. No difference is found between the two groups except for pneumonia. AF: atrial fibrillation; BMI: body mass index; COPD: chronic obstructive pulmonary disease. | |||
| Age (years) | 69.3 ± 7.2 | 71.6 ± 8.4 | 0.2 |
| Sex, n (%) | |||
| Male | 63 (51%) | 9 (50%) | 1 |
| Female | 61 (49%) | 9 (50%) | |
| BMI | 24.2 ± 7.2 | 25.2 ± 7.8 | 0.8 |
| Smoking, n (%) | 25 (20%) | 3 (16.6%) | 0.87 |
| COPD | 36 (29%) | 6 (33%) | 0.85 |
| Pneumonia | 12 (9.6%) | 9 (50%) | 0.00* |
| Pulmonary embolism | 1 (0.8%) | 1 (5.5%) | 0.23 |
| Diabetes | 63 (50%) | 8 (44%) | 0.8 |
| Renal impairment | 19 (15%) | 2 (11%) | 1 |
| Hemorrhage | 10 (8%) | 0 (0%) | 0.3 |
| Heart failure | 16 (13%) | 3 (16.6%) | 0.7 |
| Pulmonary edema | 2 (1.6%) | 0 (0%) | 1 |
| Hypertension | 72 (58%) | 8 (44%) | 0.3 |
| Obstructive sleep apnea | 1 (0.8%) | 0 (0%) | 0.87 |
| Stay sinus (n = 124) | Converted to AF (n = 18) | P value | |
|---|---|---|---|
| There is no difference between the two groups. APACHE II: Acute Physiology and Chronic Health Evaluation II; SIRS: systemic inflammatory response syndrome; SD: standard deviation. | |||
| Systolic blood pressure (mm Hg), mean ± SD | 119.6 ± 33.6 | 111.6 ± 25 | 0.3 |
| Diastolic blood pressure (mm Hg), mean ± SD | 72.4 ± 20 | 68.8 ± 17 | 0.4 |
| Pulse (beats/min), mean ± SD | 92 ± 17.6 | 93 ± 13.6 | 0.8 |
| Temperature (°C), mean ± SD | 37.5 ± 0.6 | 37.6 ± 0.7 | 0.5 |
| Respiratory rate, mean ± SD | 22.6 ± 7 | 25.3 ± 7.8 | 0.1 |
| APACHE II, mean ± SD | 14 ± 6.7 | 14.7 ± 6.4 | 0.7 |
| SIRS | |||
| Negative | 86 (69%) | 11 (61%) | 0.5 |
| Positive | 38 (30.6%) | 7 (39%) | |
| Septic shock | |||
| Negative | 111 (89%) | 13 (72%) | 0.8 |
| Positive | 13 (8%) | 5 (27.7%) | |
| Serum electrolyte concentrations | Stay sinus (n = 124) | Converted to AF (n = 18) | P value |
|---|---|---|---|
| *P ≤ 0.001. Data are presented as mean ± SD. Difference is noted between the two groups regarding serum copper and serum zinc. SD: standard deviation. | |||
| Sodium (mmol/L) | 134.2 ± 13.5 | 137 ± 10.4 | 0.32 |
| Potassium (mmol/L) | 4.4 ± 3.7 | 3.7 ± 0.8 | 0.84 |
| Magnesium (mEq/L) | 1.9 ± 0.4 | 1.8 ± 0.5 | 0.186 |
| Phosphorous (mmol/L) | 3.4 ± 1.7 | 3.4 ± 2 | 0.66 |
| Calcium (mg/dL) | 8.6 ± 1 | 8.8 ± 0.75 | 0.17 |
| Chloride (mmol/L) | 108.7 ± 11 | 109.5 ± 9 | 0.580 |
| Copper (µg/dL) | 128 ± 64 | 72.3 ± 37.4 | 0.000* |
| Zinc (µmol/L) | 132 ± 79 | 52 ± 27.5 | 0.000* |
| Laboratory investigation | Stay sinus (n = 124) | Converted to AF (n = 18) | P value |
|---|---|---|---|
| Data are presented as mean ± SD. ALT: alanine transaminase; AST: aspartate transaminase; BUN: blood urea nitrogen; CK: creatine kinase; HGB: hemoglobin; INR: international normalized ratio; SD: standard deviation; WBCs: white blood cell counts. | |||
| WBCs | 15.5 ± 18.6 | 16 ± 6 | 0.9 |
| HGB | 12 ± 10.4 | 10.4 ± 2 | 0.5 |
| Platelets | 220.6 ± 119 | 214 ± 123 | 0.2 |
| BUN | 42.4 ± 34.6 | 45.7 ± 44.2 | 0.7 |
| Creatinine | 2.4 ± 2 | 1.9 ± 1.4 | 0.4 |
| Total proteins | 6.4 ± 0.8 | 6.2 ± 0.8 | 0.4 |
| Albumin | 3 ± 0.7 | 2.7 ± 0.8 | 0.2 |
| AST | 47 ± 72.4 | 50.3 ± 63 | 0.8 |
| ALT | 44.6 ± 130.6 | 33 ± 24 | 0.7 |
| Total bilirubin | 1.7 ± 3.2 | 1.5 ± 1.4 | 0.8 |
| Direct bilirubin | 0.74 ± 1.7 | 0.7 ± 0.9 | 0.9 |
| CK total | 475.8 ± 948 | 469.7 ± 653.4 | 0.9 |
| CKMB | 23 ± 21.7 | 24.3 ± 16 | 0.7 |
| INR | 1.3 ± 0.3 | 1.5 ± 0.9 | 0.25 |
| Variables | Beta | Standard errors | P | 95% confidence interval | |
|---|---|---|---|---|---|
| Lower bound | Upper bound | ||||
| AF: atrial fibrillation. | |||||
| Pneumonia | 0.254 | 0.069 | 0.00 | 0.117 | 0.391 |
| Copper | -0.252 | 0.000 | 0.000 | -0.002 | 0.000 |
| Zinc | -0.268 | 0.000 | 0.000 | -0.002 | 0.000 |