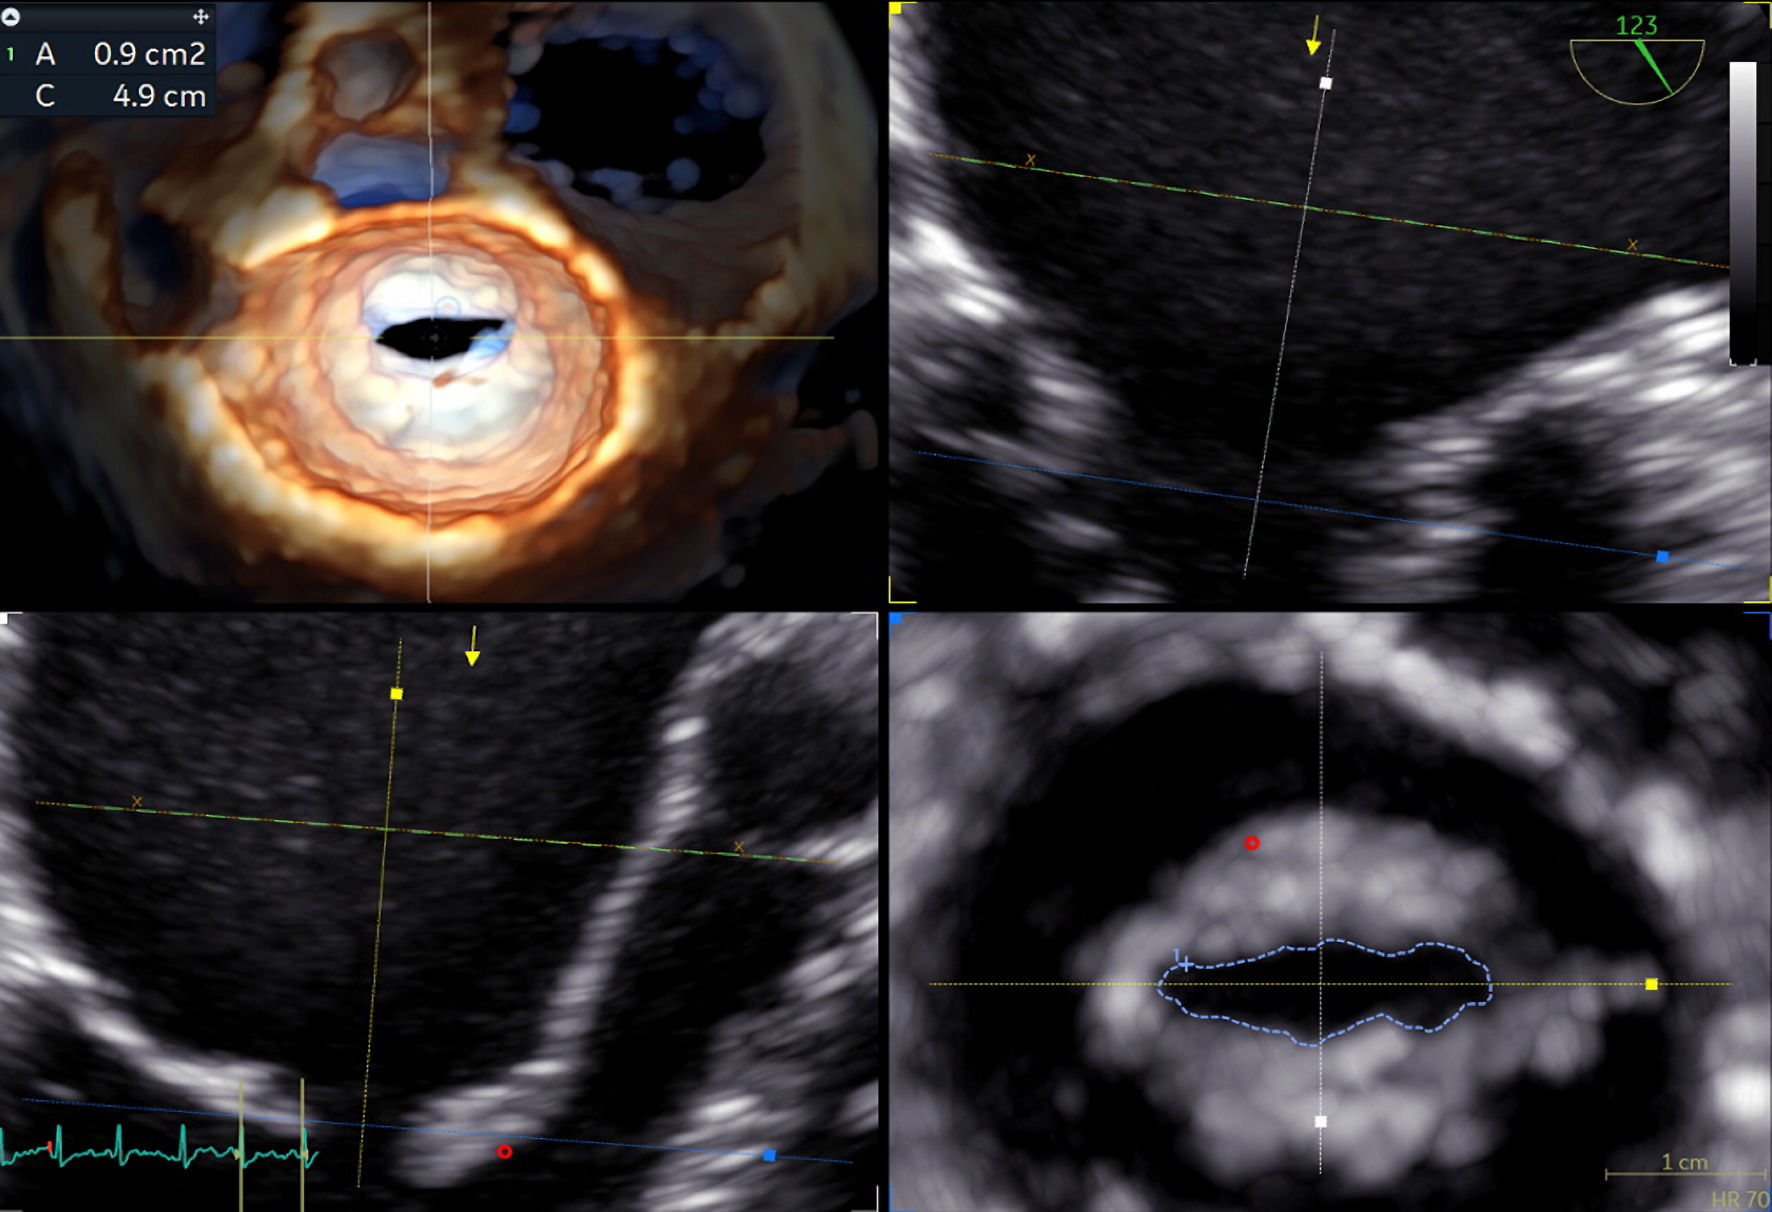
Figure 1. Measurement of MVA using multiplanar reconstruction by 3D TEE. MVA: mitral valve area; 3D: three-dimensional; TEE: transesophageal echocardiography.
| Cardiology Research, ISSN 1923-2829 print, 1923-2837 online, Open Access |
| Article copyright, the authors; Journal compilation copyright, Cardiol Res and Elmer Press Inc |
| Journal website https://www.cardiologyres.org |
Original Article
Volume 14, Number 2, April 2023, pages 142-148
Left Atrial Remodeling in Patients With Severe Rheumatic Mitral Stenosis and Sinus Rhythm Using Two-Dimensional and Three-Dimensional Speckle Tracking Echocardiography
Figures
Tables
| Cases (n = 40) | Controls (n = 30) | P value | |
|---|---|---|---|
| *Significant. Data are presented as mean ± SD or number (percentage). BMI: body mass index; BSA: body surface area; SD: standard deviation. | |||
| Age (years) | 35 ± 7 | 28 ± 5 | < 0.001* |
| Sex | |||
| Males | 17 (42.5) | 16 (53.3) | 0.369 |
| Females | 23 (57.5) | 14 (46.7) | |
| BMI | 26.9 ± 1.6 | 27.2 ± 1 | 0.379 |
| BSA | 1.7 ± 0.1 | 1.8 ± 0.1 | 0.130 |
| Cases (n = 40) | Controls (n = 30) | P value | |
|---|---|---|---|
| *Significant. Data are presented as mean ± SD. 2D: two-dimensional; 3D: three-dimensional; V max: maximum LA volume; LAVi: indexed LA volume; V min: minimum LA volume; V pre A: LA volume pre atrial contraction; LAEF: left atrium ejection fraction; LASr: LA strain at reservoir; LAS-cd: LA strain at conduit; LAS-ct: LA strain during contraction; pLASRr: peak LA strain in reservoir; pLASR-cd: peak LA strain at conduit; pLASR-ct: peak LA strain during contraction; PAP: pulmonary artery pressure; EF: ejection fraction; LV GLS: left ventricular global longitudinal strain; SD: standard deviation. | |||
| 3D parameters | |||
| V max | 76 ± 18 | 50 ± 5 | < 0.001* |
| LAVi | 44.6 ± 10.1 | 28.7 ± 3.7 | < 0.001* |
| V min | 51 ± 15 | 30 ± 4 | < 0.001* |
| V pre A | 63 ± 15 | 41 ± 6 | < 0.001* |
| Total LAEF | 38 ± 7 | 45 ± 4 | < 0.001* |
| LASr | 23 ± 6 | 41 ± 3 | < 0.001* |
| LAS-cd | -10 ± 2 | -24 ± 2 | < 0.001* |
| LAS-ct | -13 ± 4 | -18 ± 1 | < 0.001* |
| 2D parameters | |||
| pLASR-r | 24 ± 6 | 43 ± 3 | < 0.001* |
| pLASR-cd | -11 ± 3 | -25 ± 2 | < 0.001* |
| pLASR-ct | -13 ± 4 | -18 ± 1 | < 0.001* |
| PAP | 48 ± 7 | 27 ± 4 | < 0.001* |
| EF | 61.7 ± 5.51 | 64.77 ± 3.78 | 0.011* |
| E/e’ | 22.5 ± 5.16 | 8.05 ± 0.98 | < 0.001* |
| LV GLS% | -16 ± 2 | -23 ± 2 | < 0.001* |
| ICC (95% CI) | |
|---|---|
| 2D: two-dimensional; 3D: three-dimensional; LASr: LA strain at reservoir; LAS-cd: LA strain at conduit; LAS-ct: LA strain during contraction; ICC: intraclass correlation coefficient; CI: confidence interval. | |
| LASr | 0.835 (0.7 - 0.911) |
| LASR-cd | 0.688 (0.477 - 0.823) |
| LASR-ct | 0.862 (0.752 - 0.925) |
| 3D parameters | 3D MVA | |
|---|---|---|
| r | P | |
| *Significant. R: Correlation coefficient. 2D: two-dimensional; 3D: three-dimensional; LASr: left atrial strain during reservoir; LAS-cd: left atrial strain during conduit; LAS-ct: left atrial strain during contraction; MVA: mitral valve area. | ||
| LAVi | -0.354 | 0.025* |
| LASr | 0.475 | 0.002* |
| LAS-cd | 0.495 | 0.001* |
| LAS-ct | 0.392 | 0.012* |
| 2D parameters | 2D MVA | |
|---|---|---|
| r | P | |
| *Significant. R: correlation coefficient. 2D: two-dimensional; 3D: three-dimensional; MVA: mitral valve area; pLASr: peak left atrial strain during reservoir; pLAS-cd: peak left atrial strain during conduit; pLAS-ct: peak left atrial strain during contraction. | ||
| pLASr | 0.425 | 0.006* |
| pLAS-cd | 0.490 | 0.001* |
| pLAS-ct | 0.268 | 0.094* |
| 3D parameters | LV GLS | |
|---|---|---|
| r | P | |
| *Significant. r: correlation coefficient. 2D: two-dimensional; 3D: three-dimensional; MVA: mitral valve area; LAVi: indexed LA volume; LA: left atrium; LV GLS: left ventricle global longitudinal strain. | ||
| MVA | 0.433 | 0.005* |
| LAVi | -0.509 | < 0.001* |