Figures
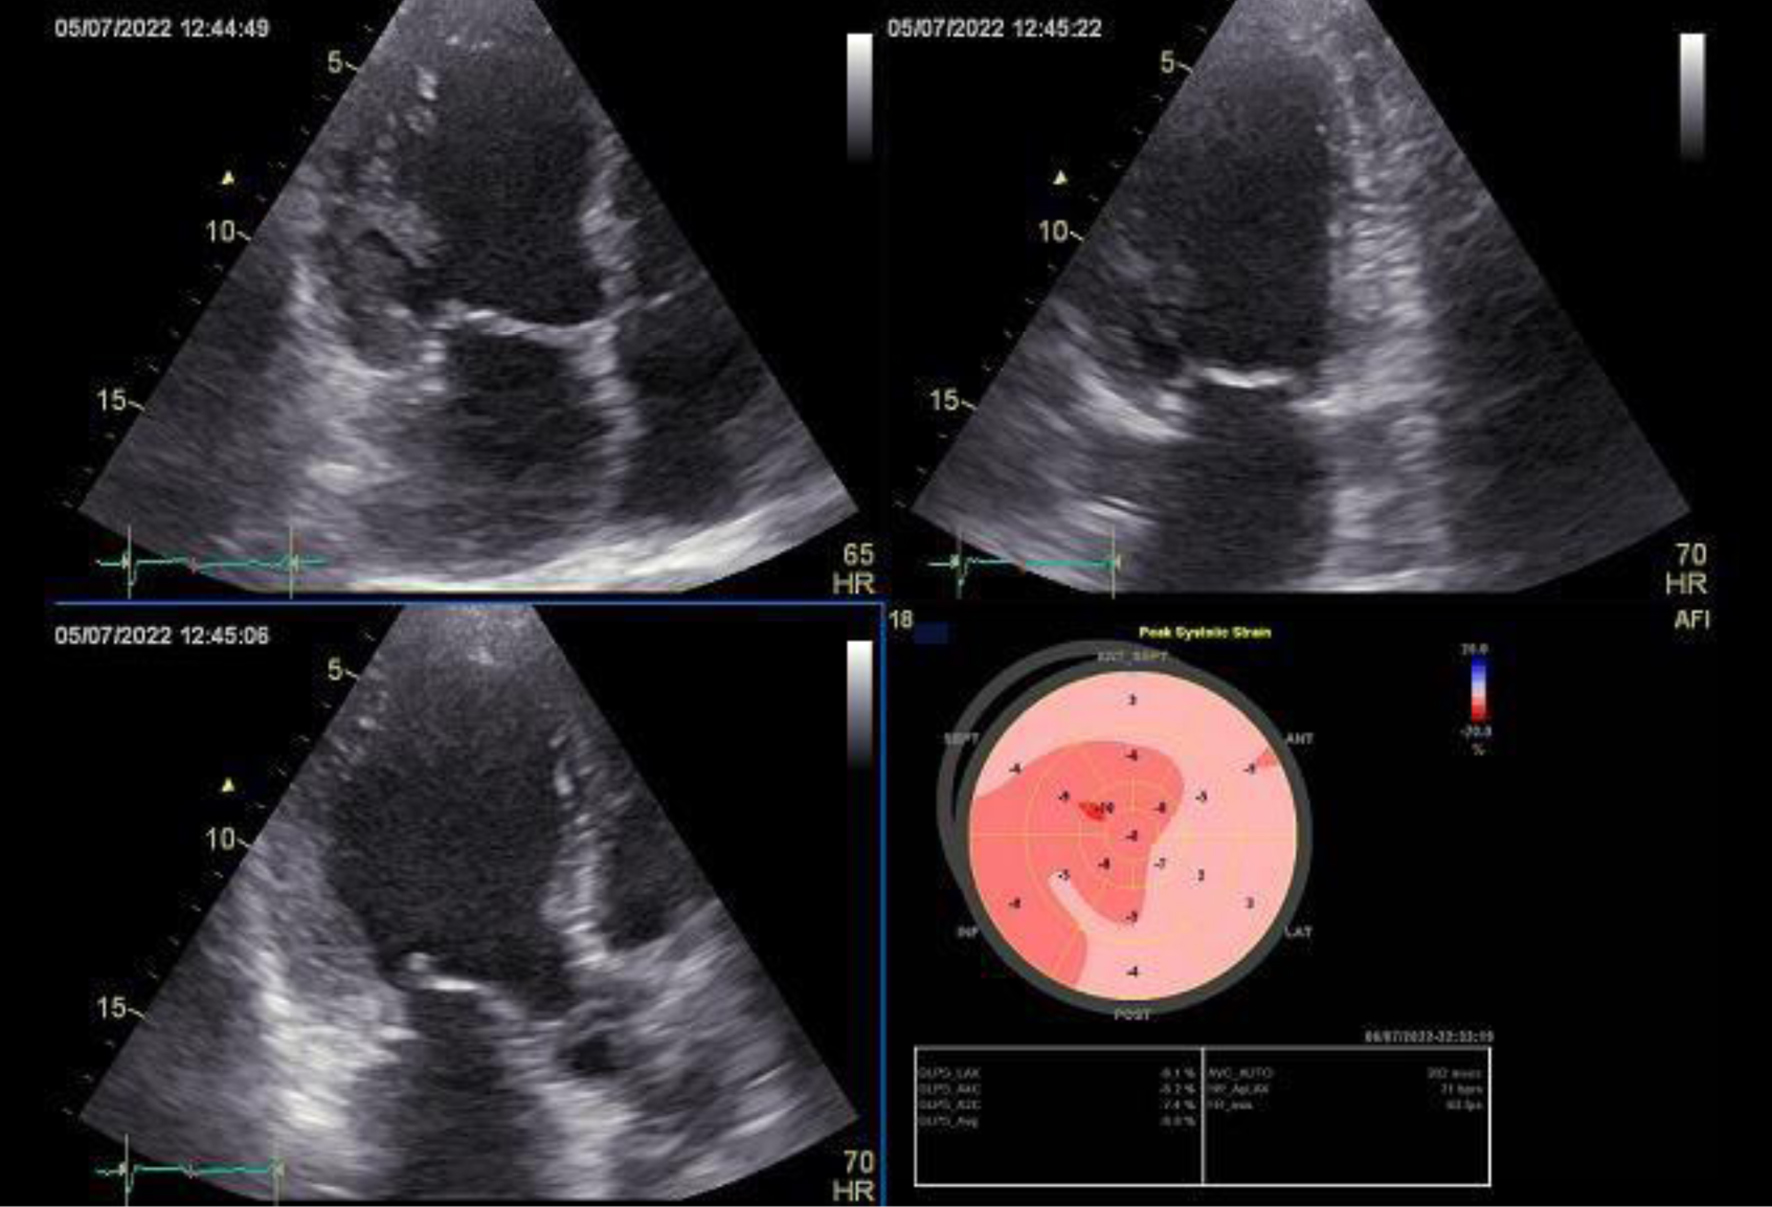
Figure 1. Echocardiography of a 67-year-old male patient showing immobilizing interstitial cardiac fibrosis. Diffuse decrease in LV myocardial contractility was noted. LV contractility was reduced. Total LVEF was 41%. LVEF: left ventricular ejection fraction.
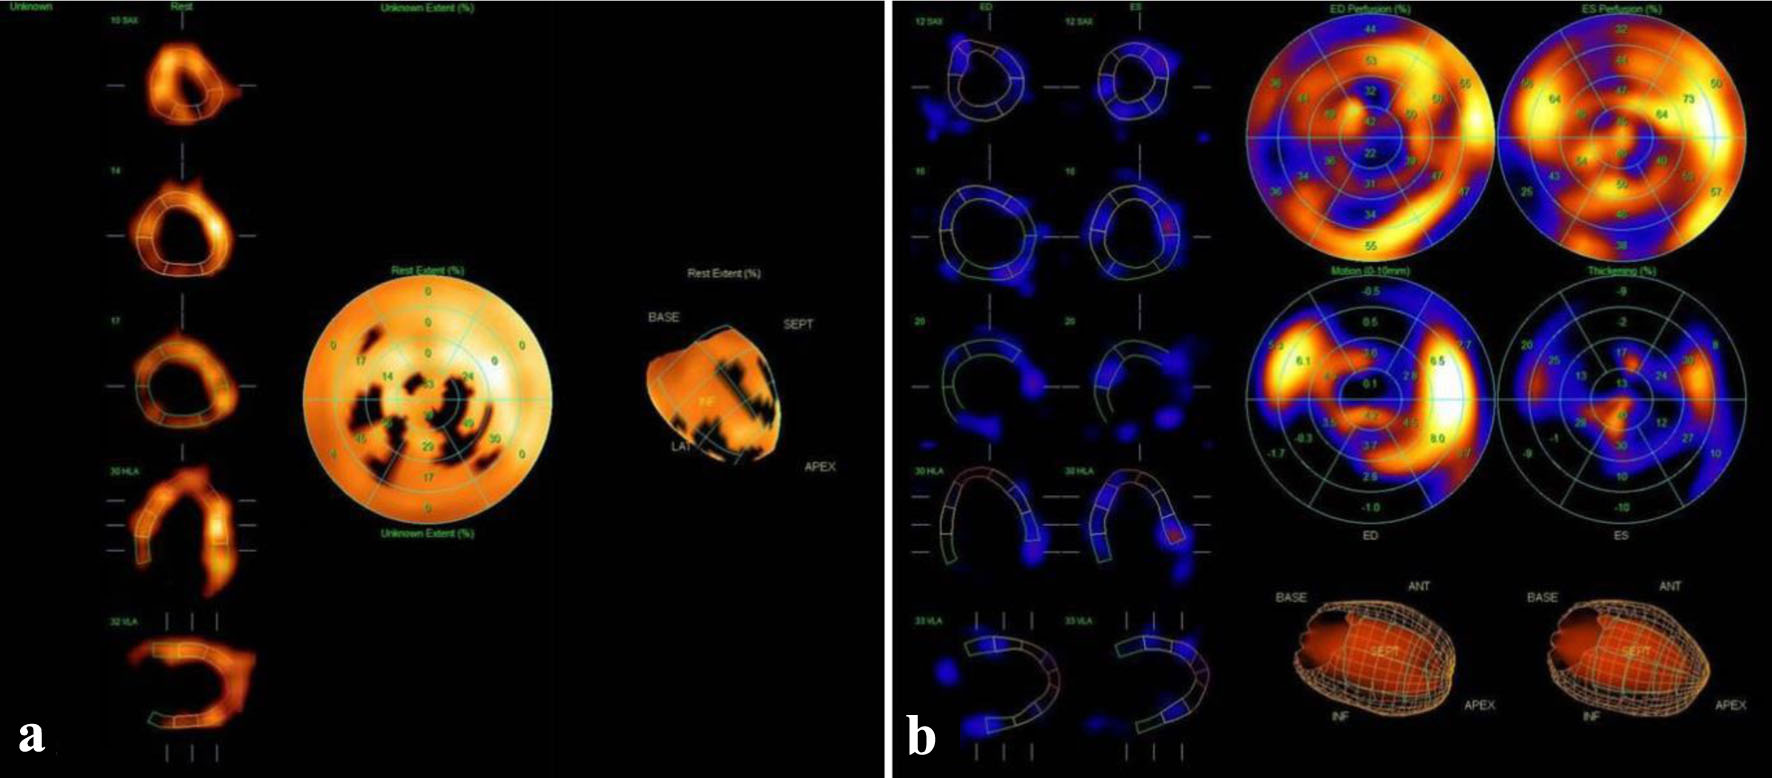
Figure 2. 99mTc scintigraphy of the myocardium (a: LV myocardial perfusion; b: LV myocardial function) of a 49-year-old male patient showing immobilizing interstitial cardiac fibrosis. Diffuse decrease in perfusion and diffuse decrease in regional systolic wall thickening in the entire LV myocardium without a clear differentiation between the areas of local hypoperfusion and local hypokinesia were noted. LV contractility was significantly decreased. Total LVEF was 37%. LVEF: left ventricular ejection fraction.
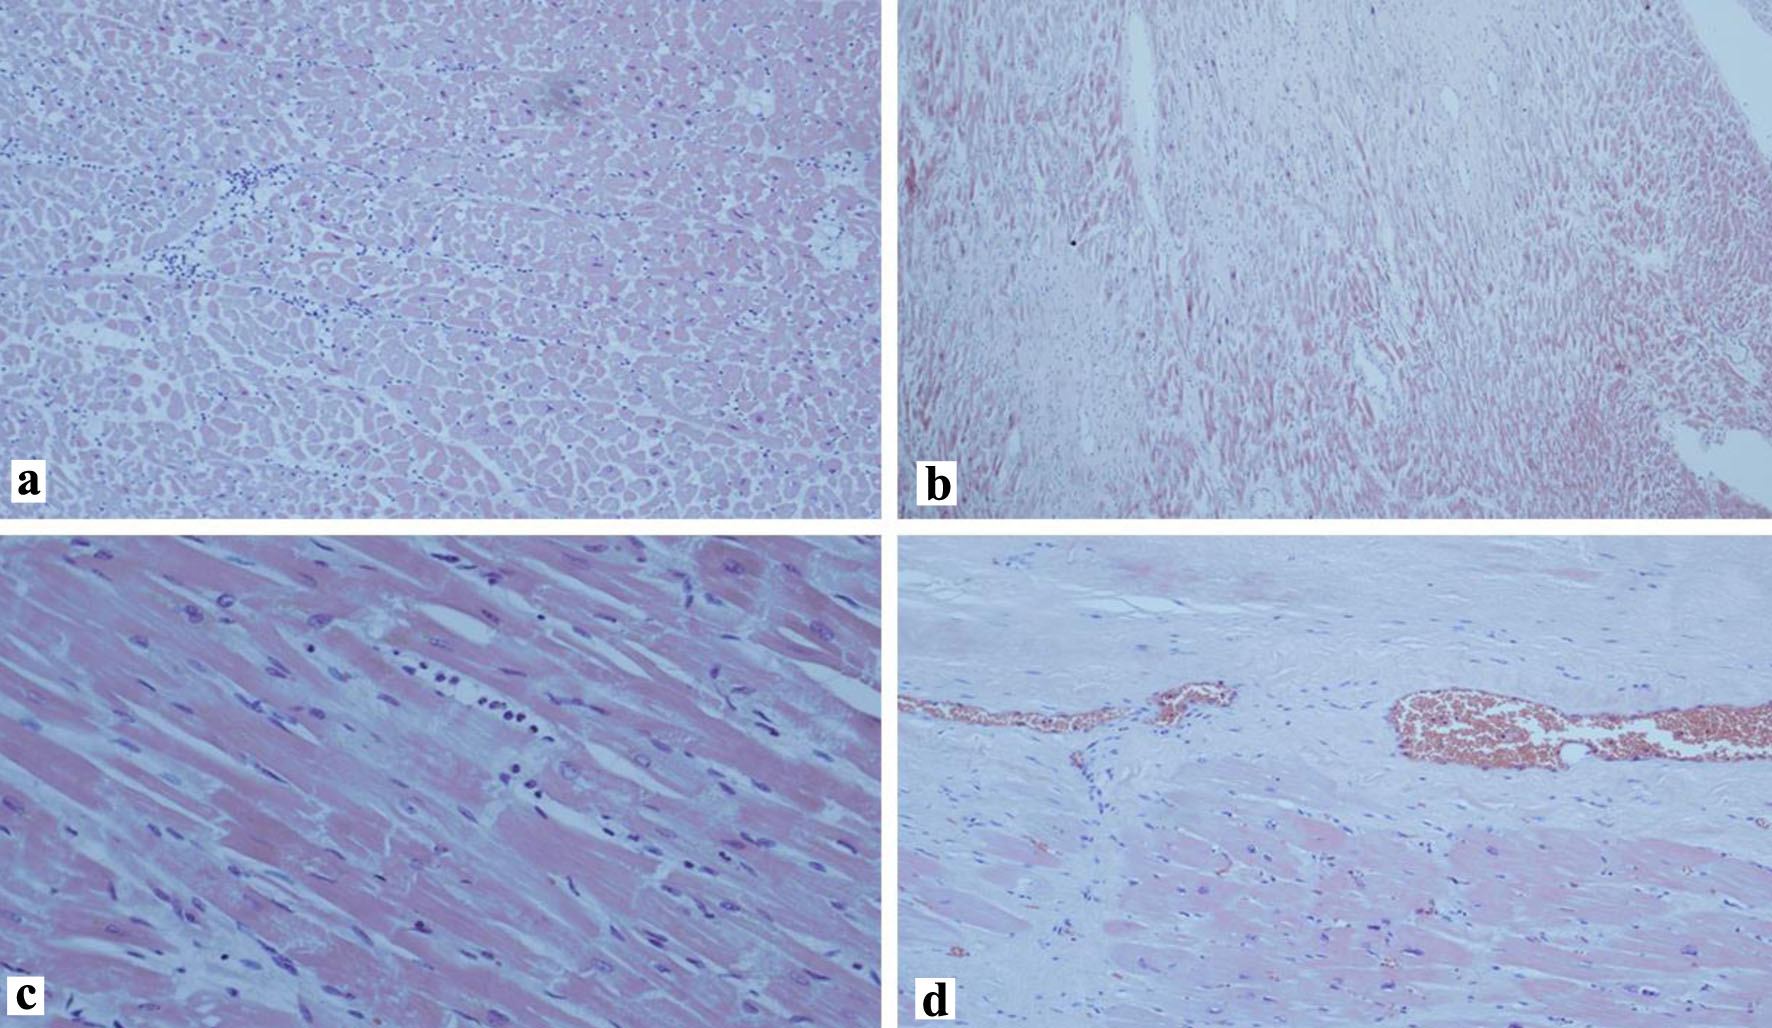
Figure 3. Diffuse spread of induced immobilizing interstitial cardiac fibrosis in a 68-year-old male patient. (a-c) Early stages (approximately 1 month). (d) Extravascular compression of coronary arterioles, areas of scarring (hematoxylin and eosin stain, a: × 100, b: × 80, c, d: × 40).
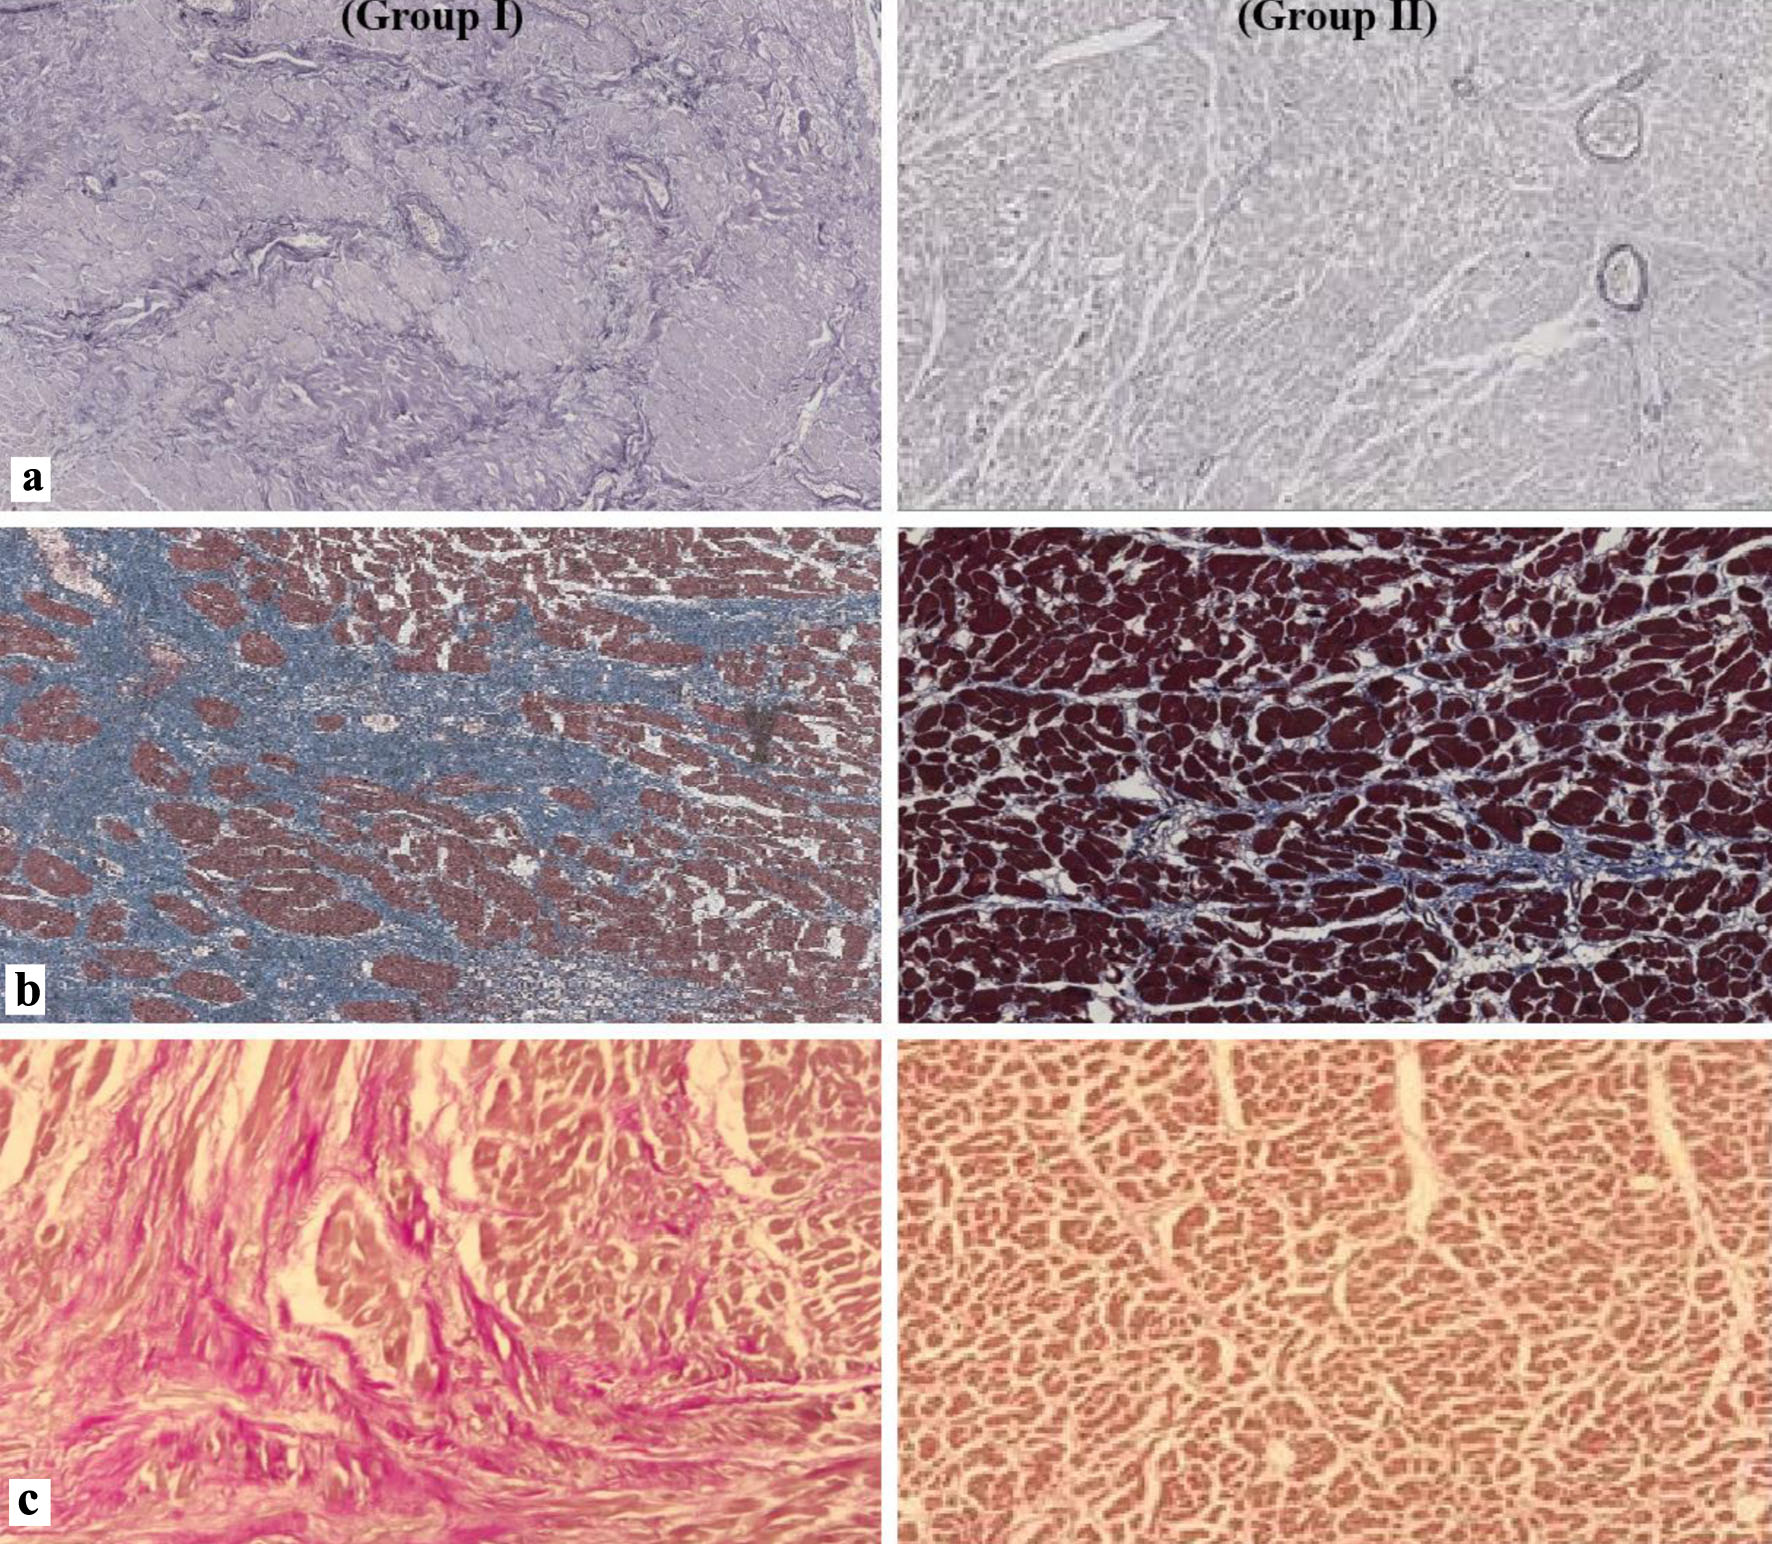
Figure 4. Histological preparations of the myocardium showing a significant increase in the volume of connective tissue in group I patients. (a) Weigert’s stain, × 100. (b) Masson’s stain, × 200. (c) Van Gieson’s stain, × 200.
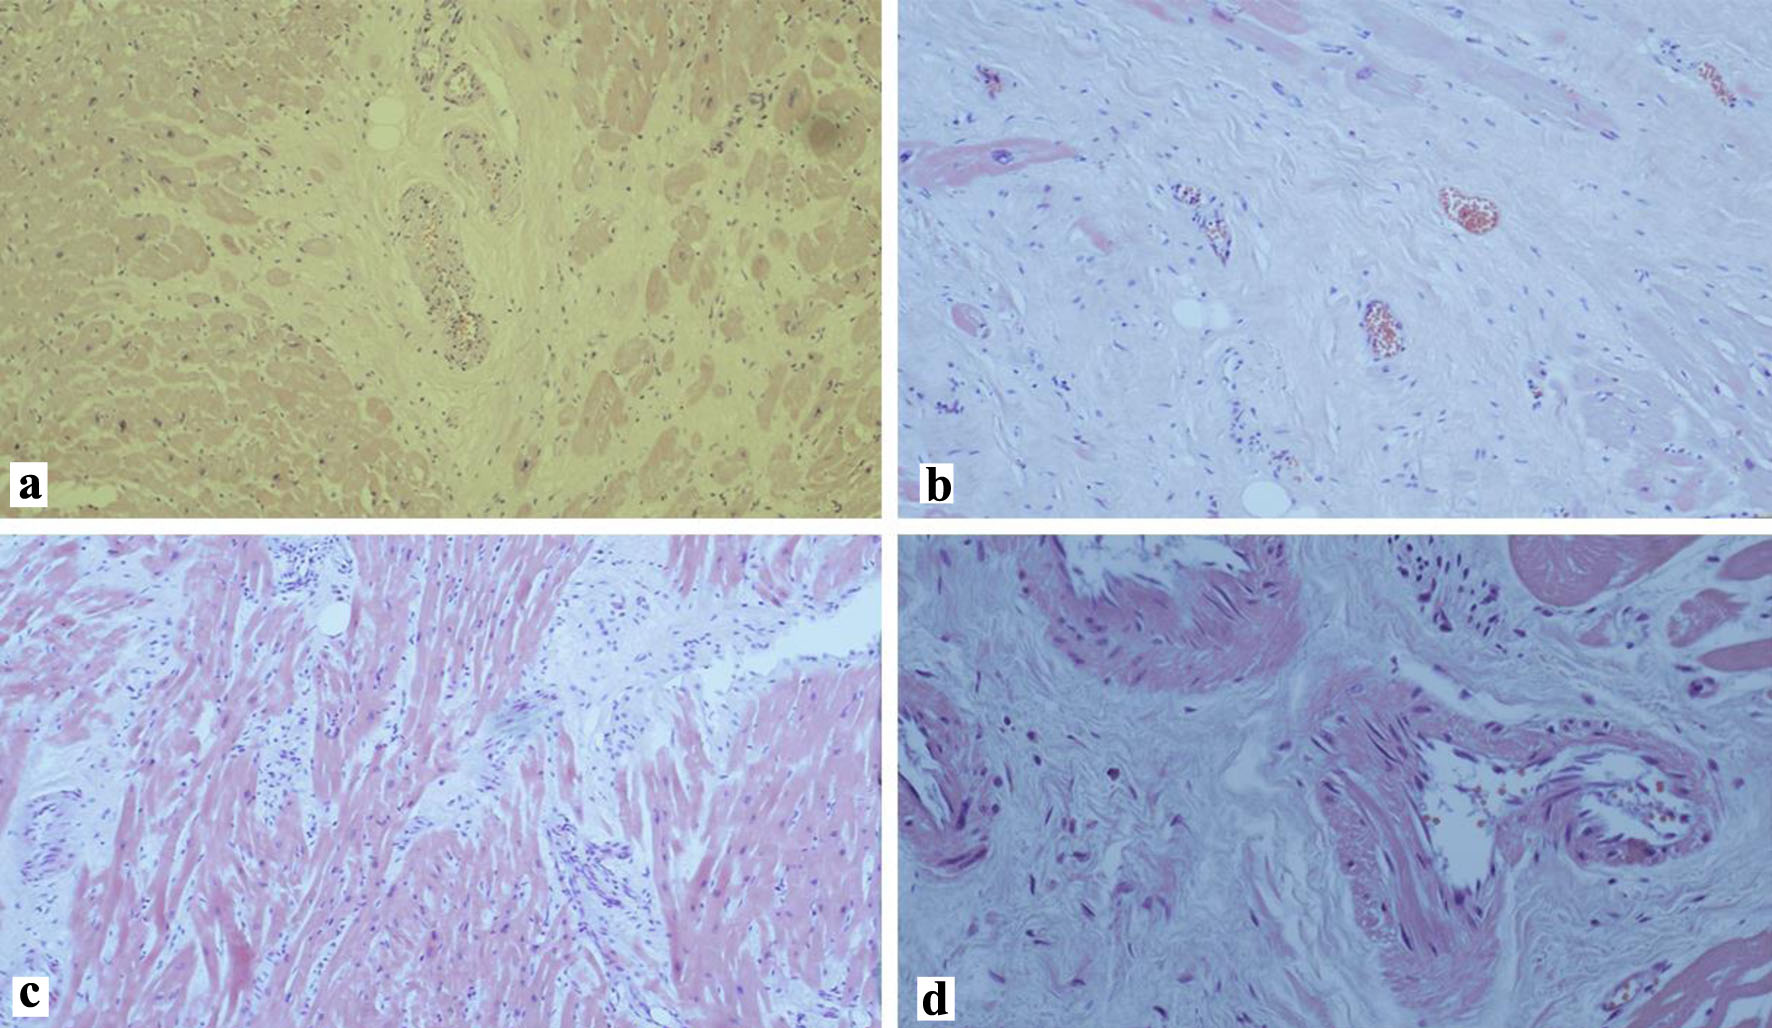
Figure 5. The stage of coronary angiopathy (in group I) is an extremely severe degree of fibrosis with constriction of the peripheral coronary bed (hematoxylin and eosin stain, a-c: × 200, d: × 400).
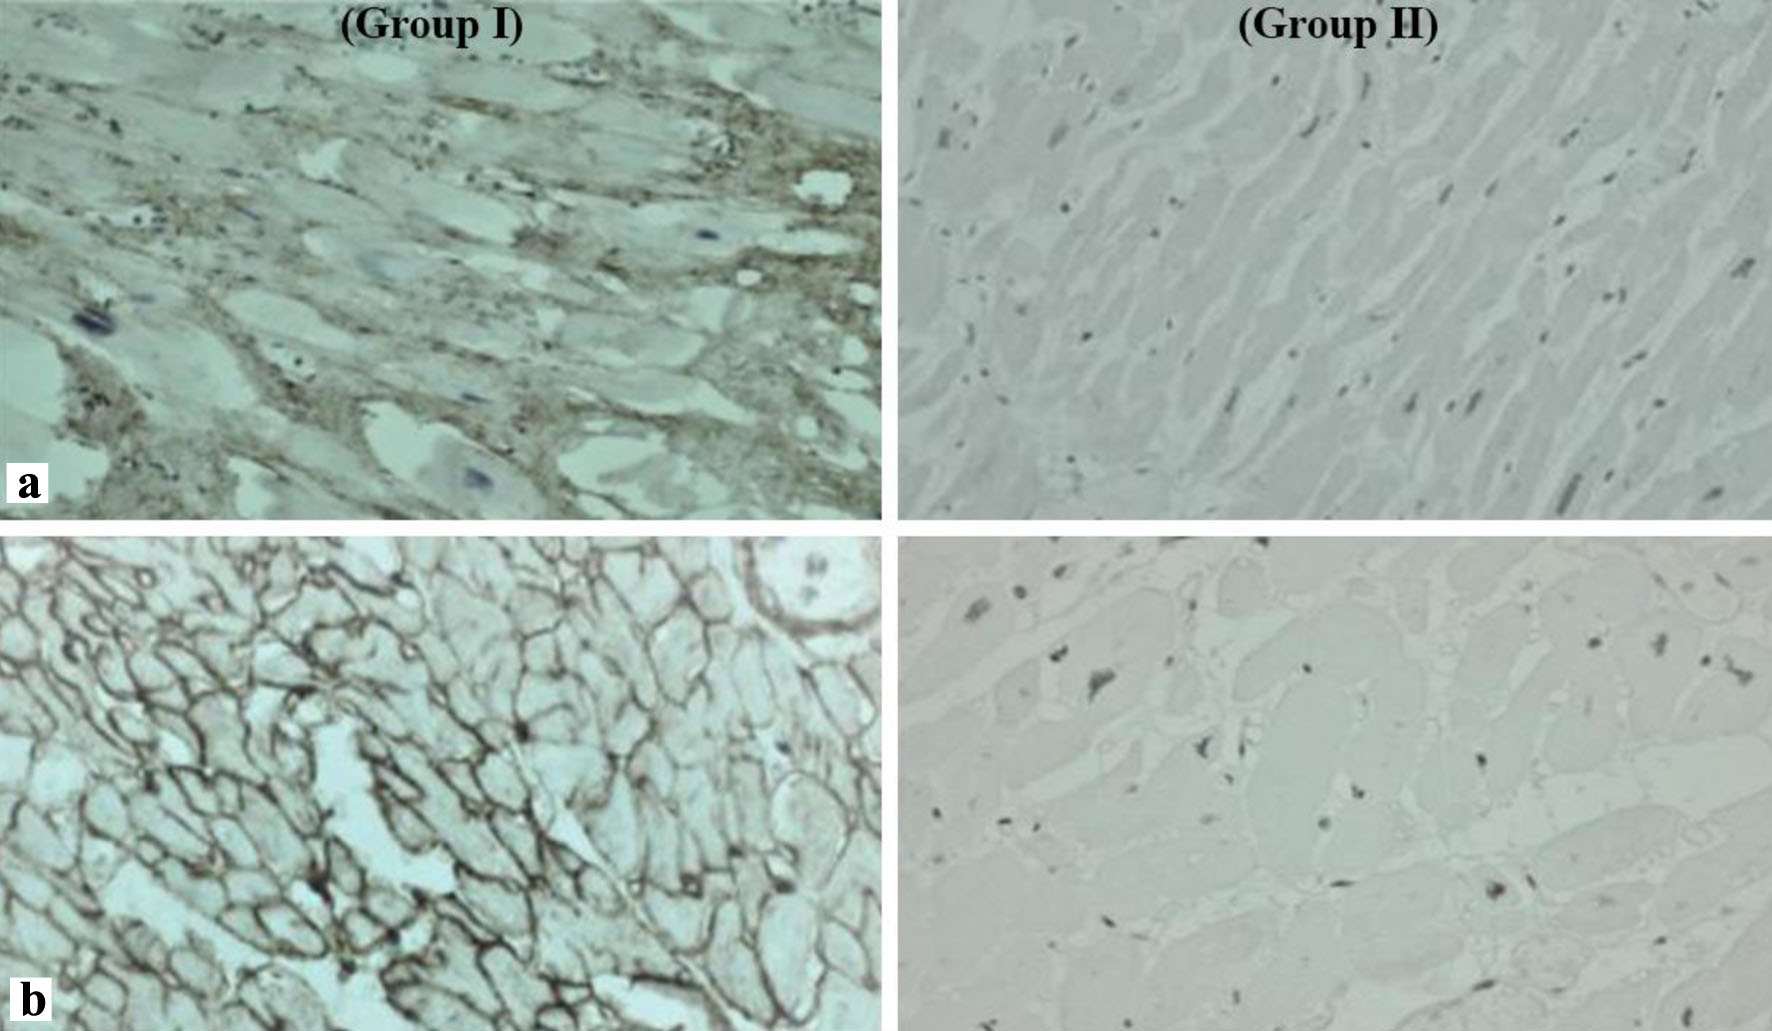
Figure 6. (a) Type I collagen fibers in group I chaotic intersection of bundles forming closed spaces around individual cardiomyocytes; in group II ordered arrangement of collagen fibers. (b) Type III collagen fibers in group I disordered arrangement, without clearly distinguishable spatial structures; in group II rare bundles of collagen fibers (Weigert’s stain, × 400).
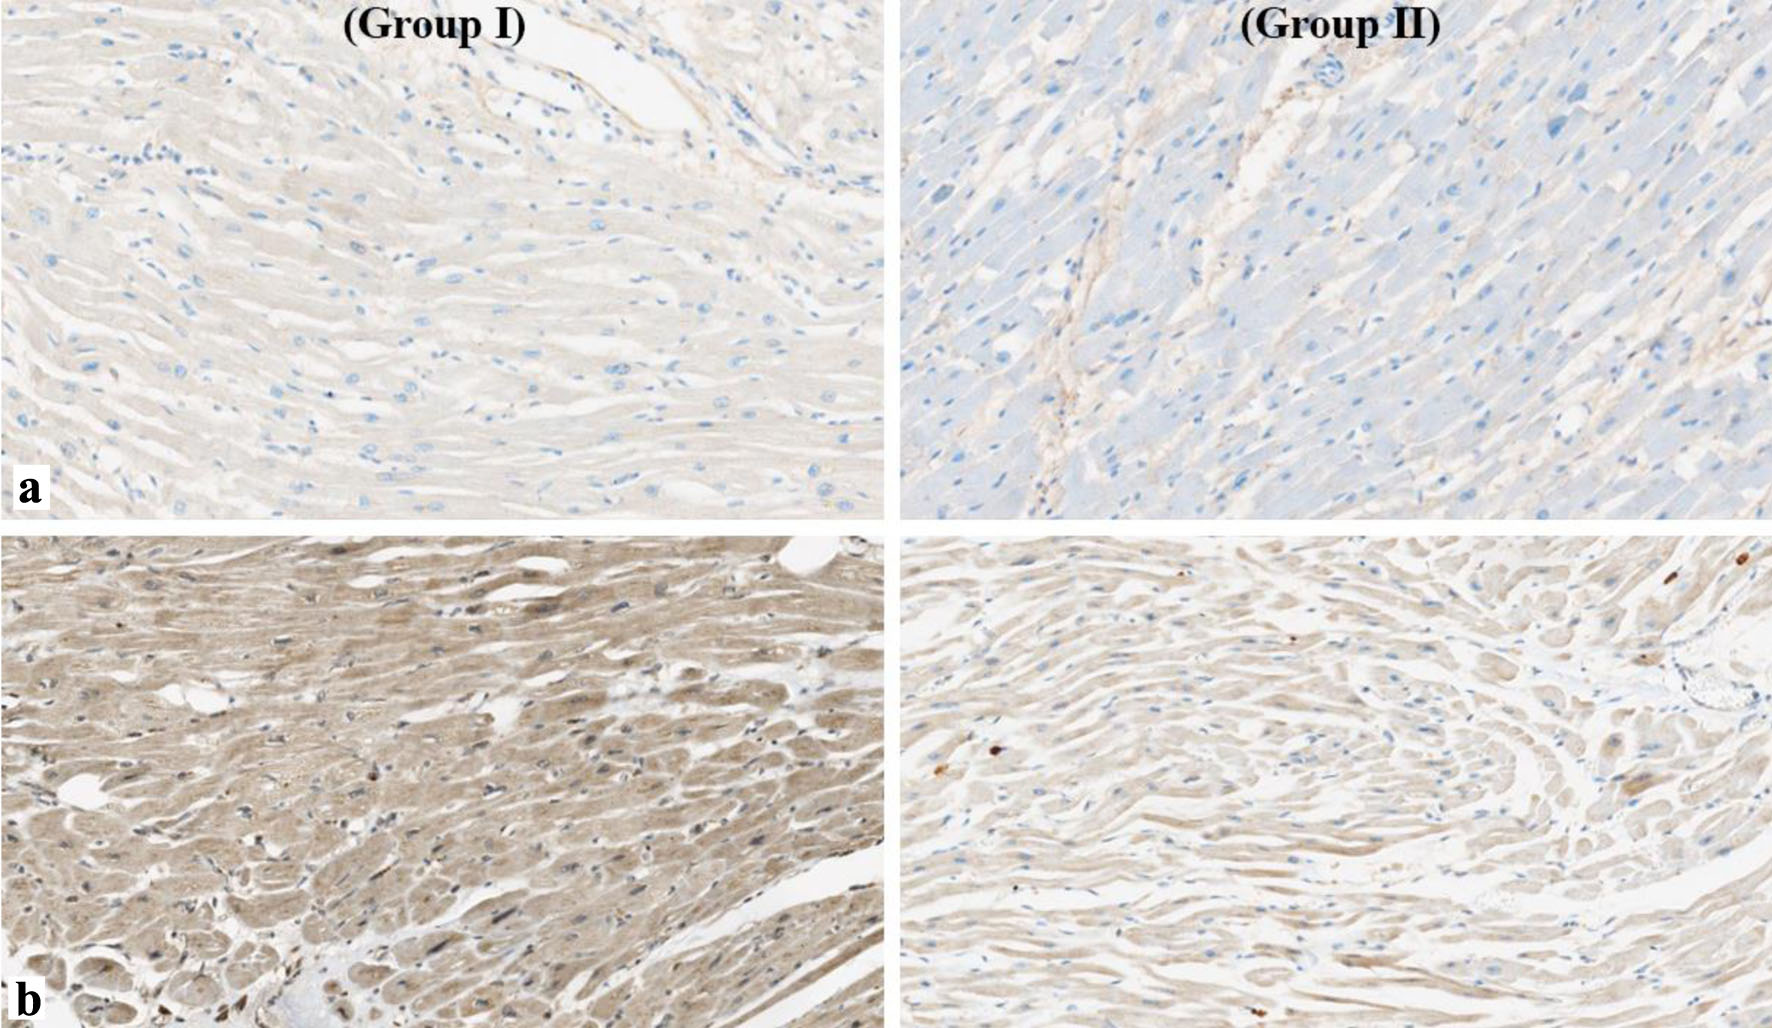
Figure 7. Metalloproteinase expression: (a) MMP-2 (immunohistochemical study, × 200 increase); (b) MMP-9 (immunohistochemical stain, × 200). MMP: matrix metalloproteinase.
Tables
Table 1. Clinical and Demographic Characteristics of Patients
| Indicator | Group I (n = 32) | Group II (n = 37) | P |
|---|
| SD: standard deviation. |
| Sex, n (%) | | | |
| Male | 22 (69%) | 26 (70%) | 0.89 |
| Female | 10 (31%) | 11 (30%) | 0.78 |
| Age, years (mean ± SD) | 60.25 ± 7.9 | 69.5 ± 5.4 | 0.62 |
| Body mass index, kg/m2 (mean ± SD) | 28.5 ± 6.8 | 27.3 ± 5.4 | 0.75 |
| Heart weight, g (mean ± SD) | 479 ± 152 | 319 ± 54 | 0.069 |
| Heart failure, n (%) | 32 (100%) | 16 (43%) | < 0.001 |
| Hypertension, n (%) | 20 (62.5%) | 21 (56.7%) | 0.63 |
| Dyslipidemia, n (%) | 15 (46.8%) | 11 (29.7%) | 0.14 |
| Smoking, n (%) | 7 (21.9%) | 10 (27%) | 0.78 |
| Ejection fraction (echocardiography), % (mean ± SD) | 40.3±4.5% | 60.7±5.1% | < 0.001 |
Table 2. Concomitant Diseases in Patients
| Concomitant diseases | Group I (n = 32), n (%) | Group II (n = 37), n (%) | OR (95% CI) | P |
|---|
| CI: confidence interval; OR: odds ratio; SARS-CoV-2: severe acute respiratory syndrome coronavirus 2. |
| Type 2 diabetes mellitus | 15 (47%) | 3 (8%) | 10.0 (2.54 - 39.34) | < 0.001 |
| Myocardial infarction | 5 (16%) | 4 (11%) | 1.53 (0.37 - 6.26) | 0.723 |
| Systemic connective tissue diseases | 25 (78%) | 2 (5%) | 62.5 (11.9 - 326.5) | < 0.001 |
| Viral pneumonia (SARS-CoV-2) within 12 months | 17 (53%) | 7 (19%) | 4.86 (1.66 - 14.25) | 0.003 |
| Tuberculosis | 3 (9%) | 0 (0%) | - | 0.095 |
| Bacterial infections within 12 months | 10 (31%) | 4 (11%) | 3.75 (1.04 - 13.47) | 0.069 |
| Oncological diseases (radiation therapy) | 6 (19%) | 0 (0%) | - | 0.008 |
| Heart rhythm disturbances | 28 (88%) | 7 (19%) | 30.0 (7.918 - 113.7) | < 0.001 |
| Chronic kidney disease | 8 (25%) | 3 (8%) | 3.8 (0.9 - 15.7) | 0.097 |
| Chronic obstructive pulmonary disease | 2 (6%) | 3 (8%) | 0.76 (0.12 - 4.83) | 1.0 |