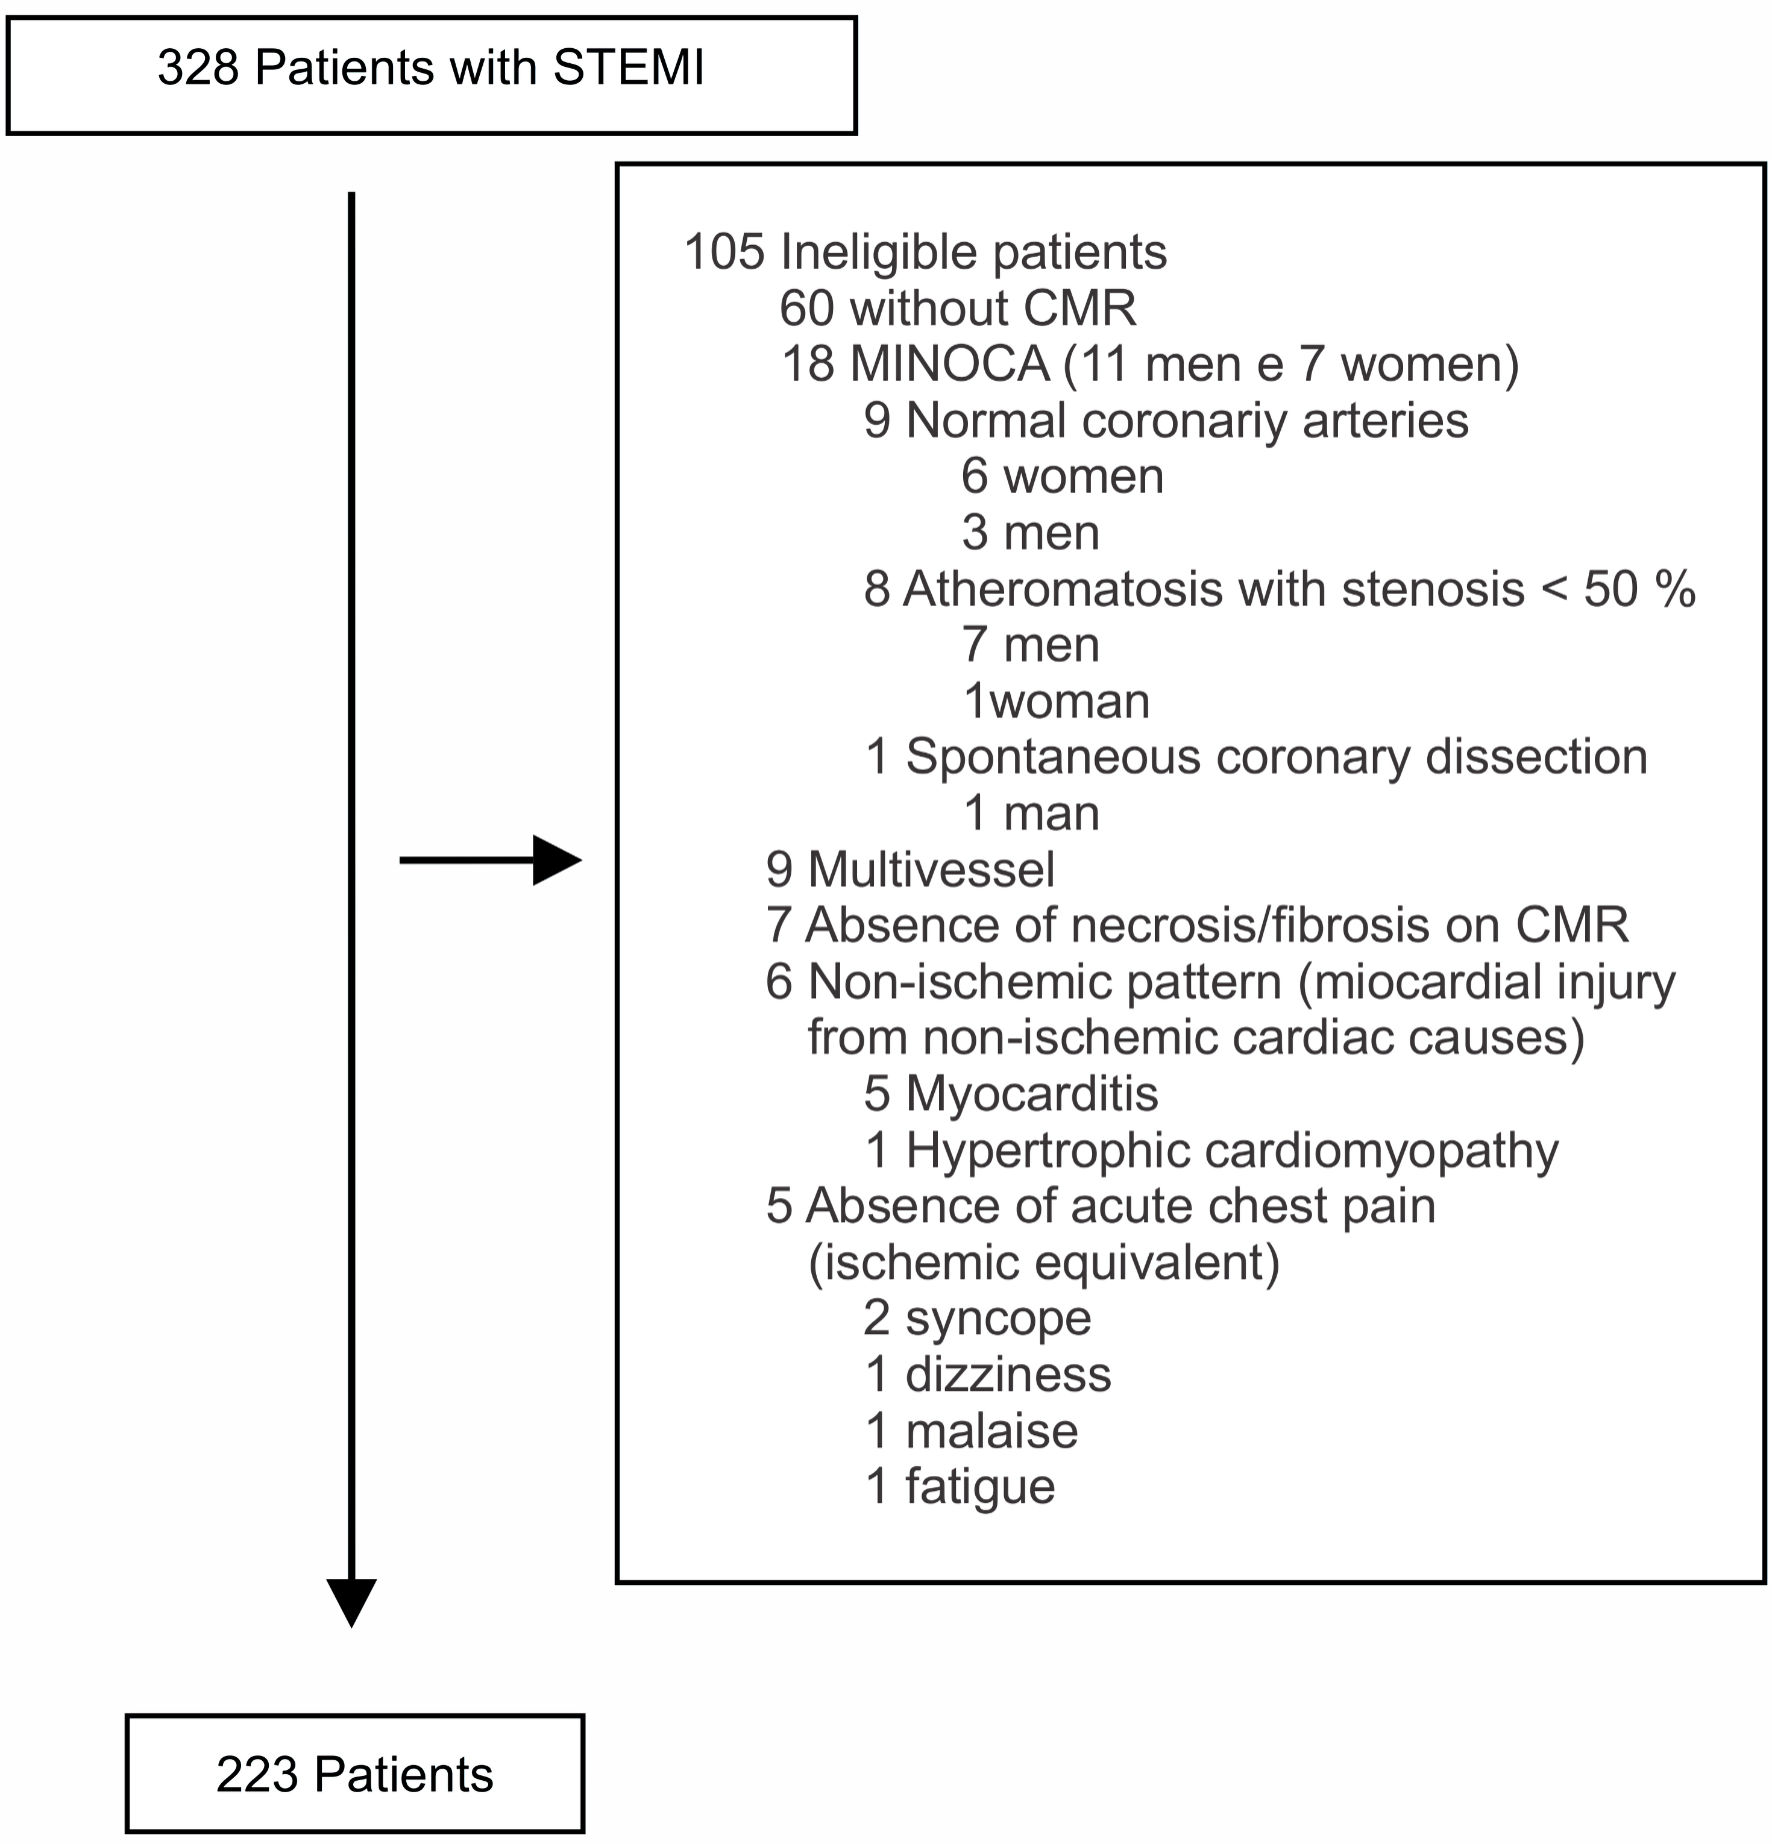
Figure 1. Distribution of causes of ineligibility for the study. STEMI: ST-segment elevation myocardial infarction; CMR: cardiac magnetic resonance; MINOCA: myocardial infarction with non-obstructive coronary arteries.
| Cardiology Research, ISSN 1923-2829 print, 1923-2837 online, Open Access |
| Article copyright, the authors; Journal compilation copyright, Cardiol Res and Elmer Press Inc |
| Journal website https://www.cardiologyres.org |
Original Article
Volume 14, Number 2, April 2023, pages 97-105
Chest Pain in Acute Myocardial Infarction and Its Association With the Culprit Artery and Fibrotic Segment Identified by Cardiac Magnetic Resonance
Figures
Tables
| Variables | N = 223 |
|---|---|
| SD: standard deviation; CMR: cardiac magnetic resonance; min: minimum; max: maximum. | |
| Age (years) | |
| Mean ± SD | 57.2 ± 8.2 |
| Median (min, max) | 58 (35, 74) |
| Male sex, n (%) | 161 (72.2) |
| Hypertension, n (%) | 124 (55.6) |
| Diabetes mellitus, n (%) | 67 (30.0) |
| Total cholesterol (mg/dL) | |
| Mean ± SD | 208.9 ± 47.4 |
| Median (min, max) | 201.50 (98, 361) |
| Low-density lipoprotein (mg/dL) | |
| Mean ± SD | 136.6 ± 40.3 |
| Median (min, max) | 132.00 (51, 258) |
| High-density lipoprotein (mg/dL) | |
| Mean ± SD | 42.32 ± 12.29 |
| Median (min, max) | 41.00 (18, 99) |
| Triglycerides (mg/dL) | |
| Mean ± SD | 164.66 ± 114.35 |
| Median (min, max) | 133.00 (42, 853) |
| Creatinine (mg/dL) | |
| Mean ± SD | 0.90 ± 0.22 |
| Median (min, max) | 0.87 (0.48, 1.72) |
| Hemoglobin (g/dL) | |
| Mean ± SD | 15.01 ± 1.67 |
| Median (min, max) | 15.00 (10.50, 20.80) |
| High-sensitivity cardiac troponin (pg/mL) | |
| Mean ± SD | 7,244.84 ± 5,852.58 |
| Median (min, max) | 5,695.00 (38, 32,287) |
| Left ventricular ejection fraction by CMR (%) | |
| Mean ± SD | 48.25 ± 11.24 |
| Median (min, max) | 48.00 (19.10, 71.90) |
| Viriables | N (%) |
|---|---|
| Localization | |
| Precordial | 85 (38.1) |
| Retrosternal | 90 (40.4) |
| Right upper limb | 2 (0.9) |
| Both upper limbs | 3 (1.3) |
| Left upper limb | 15 (6.7) |
| Epigastric | 22 (9.9) |
| Neck/mandible | 6 (2.7) |
| Irradiation | |
| Without irradiation | 79 (35.4) |
| Right upper limb | 7 (3.1) |
| Both upper limbs | 21 (9.4) |
| Right upper limb and neck/mandible | 1 (0.4) |
| Right upper limb and retrosternal | 1 (0.4) |
| Both upper limbs and neck/mandible | 2 (0.9) |
| Left upper limb | 62 (27.8) |
| Left upper limb and neck/mandible | 12 (5.4) |
| Left upper limb and epigastric | 1 (0.4) |
| Left upper limb and precordial | 1 (0.4) |
| Left upper limb and retrosternal | 1 (0.4) |
| Left upper limb, epigastric and precordial | 1 (0.4) |
| Neck/mandible | 7 (3.1) |
| Neck/mandible and precordial | 2 (0.9) |
| Neck/mandible and retrosternal | 1 (0.4) |
| Epigastric | 7 (3.1) |
| Precordial | 11 (4.9) |
| Retrosternal | 6 (2.7) |
| Localization | Artery | ||
|---|---|---|---|
| RCA (n = 88) | LCX (n = 25) | LAD (n = 110) | |
| N (%) | N (%) | N (%) | |
| Likelihood ratio Chi-square test: P = 0.237. RCA: right coronary artery; LCX: left circumflex; LAD: left anterior descending. | |||
| Precordial | 40 (45.5) | 11 (44.0) | 34 (30.9) |
| Retrosternal | 31 (35.2) | 9 (36.0) | 50 (45.5) |
| Right upper limb | 1 (1.1) | 1 (4.0) | 0 (0.0) |
| Both upper limbs | 0 (0.0) | 0 (0.0) | 3 (2.7) |
| Left upper limb | 4 (4.5) | 2 (8.0) | 9 (8.2) |
| Epigastric | 9 (10.2) | 1 (4.0) | 12 (10.9) |
| Neck/mandible | 3 (3.4) | 1 (4.0) | 2 (1.8) |
| Irradiation | Artery | ||
|---|---|---|---|
| RCA (n = 88) | LCX (n = 25) | LAD (n = 110) | |
| N (%) | N (%) | N (%) | |
| Likelihood ratio Chi-square test: P = 0.473. RCA: right coronary artery; LCX: left circumflex; LAD: left anterior descending. | |||
| Without irradiation | 32 (36.4) | 12 (48.0) | 35 (31.8) |
| Right upper limb | 4 (4.5) | 0 (0.0) | 3 (2.7) |
| Both upper limbs | 7 (8.0) | 4 (16.0) | 10 (9.1) |
| Right upper limb and neck/mandible | 0 (0.0) | 1 (4.0) | 0 (0.0) |
| Right upper limb and retrosternal | 0 (0.0) | 0 (0.0) | 1 (0.9) |
| Both upper limbs and neck/mandible | 1 (1.1) | 0 (0.0) | 1 (0.9) |
| Left upper limb | 25 (28.4) | 4 (16.0) | 33 (30.0) |
| Left upper limb and neck/mandible | 5 (5.7) | 0 (0.0) | 7 (6.4) |
| Left upper limb and epigastric | 0 (0.0) | 0 (0.0) | 1 (0.9) |
| Left upper limb and precordial | 1 (1.1) | 0 (0.0) | 0 (0.0) |
| Left upper limb and retrosternal | 0 (0.0) | 1 (4.0) | 0 (0.0) |
| Left upper limb, epigastric and precordial | 1 (1.1) | 0 (0.0) | 0 (0.0) |
| Neck/mandible | 3 (3.4) | 1 (4.0) | 3 (2.7) |
| Neck/mandible and precordial | 1 (1.1) | 0 (0.0) | 1 (0.9) |
| Neck/mandible and retrosternal | 0 (0.0) | 0 (0.0) | 1 (0.9) |
| Epigastric | 4 (4.5) | 1 (4.0) | 2 (1.8) |
| Precordial | 3 (3.4) | 0 (0.0) | 8 (7.3) |
| Retrosternal | 1 (1.1) | 1 (4.0) | 4 (3.6) |
| Local | Precordial | Retrosternal | Right upper limb | Both upper limbs | Left upper limb | Epigastric | Neck/mandible | P* |
|---|---|---|---|---|---|---|---|---|
| *Descriptive level of probability of Fisher’s exact test. | ||||||||
| Basal short axis | ||||||||
| Anterior, n (%) | 5 (5.9) | 6 (6.7) | 0 (0.0) | 0 (0.0) | 2 (13.3) | 2 (9.1) | 1 (16.7) | 0.616 |
| Anteroseptal, n (%) | 9 (10.6) | 14 (15.6) | 0 (0.0) | 0 (0.0) | 1 (6.7) | 2 (9.1) | 0 (0.0) | 0.902 |
| Inferoseptal, n (%) | 24 (28.2) | 10 (11.1) | 0 (0.0) | 0 (0.0) | 2 (13.3) | 5 (22.7) | 2 (33.3) | 0.083 |
| Inferior, n (%) | 37 (43.5) | 26 (28.9) | 1 (50.0) | 0 (0.0) | 3 (20.0) | 6 (27.3) | 2 (33.3) | 0.230 |
| Inferolateral, n (%) | 22 (25.9) | 19 (21.1) | 1 (50.0) | 0 (0.0) | 2 (13.3) | 3 (13.6) | 3 (50.0) | 0.346 |
| Anterolateral, n (%) | 3 (3.5) | 6 (6.7) | 1 (50.0) | 0 (0.0) | 1 (6.7) | 2 (9.1) | 0 (0.0) | 0.264 |
| Mid short axis | ||||||||
| Anterior, n (%) | 26 (30.6) | 34 (37.8) | 0 (0.0) | 0 (0.0) | 7 (46.7) | 9 (40.9) | 0 (0.0) | 0.266 |
| Anteroseptal, n (%) | 29 (34.1) | 35 (38.9) | 0 (0.0) | 1 (33.3) | 8 (53.3) | 10 (45.5) | 1 (16.7) | 0.605 |
| Inferoseptal, n (%) | 28 (32.9) | 17 (18.9) | 0 (0.0) | 0 (0.0) | 3 (20.0) | 5 (22.7) | 2 (33.3) | 0.380 |
| Inferior, n (%) | 41 (48.2) | 31 (34.4) | 1 (50.0) | 0 (0.0) | 1 (6.7) | 6 (27.3) | 3 (50.0) | 0.015 |
| Inferolateral, n (%) | 24 (28.2) | 20 (22.2) | 1 (50.0) | 1 (33.3) | 4 (26.7) | 5 (22.7) | 3 (50.0) | 0.608 |
| Anterolateral, n (%) | 14 (16.5) | 12 (13.3) | 1 (50.0) | 0 (0.0) | 2 (13.3) | 3 (13.6) | 1 (16.7) | 0.771 |
| Apical short axis | ||||||||
| Anterior, n (%) | 31 (36.5) | 40 (44.4) | 0 (0.0) | 1 (33.3) | 8 (53.3) | 11 (50.0) | 2 (33.3) | 0.680 |
| Septal, n (%) | 36 (42.4) | 41 (45.6) | 0 (0.0) | 0 (0.0) | 8 (53.3) | 13 (59.1) | 2 (33.3) | 0.404 |
| Inferior, n (%) | 46 (54.1) | 29 (32.2) | 1 (50.0) | 2 (66.7) | 5 (33.3) | 12 (54.5) | 3 (50) | 0.051 |
| Lateral, n (%) | 26 (30.6) | 25 (27.8) | 1 (50.0) | 2 (66.7) | 5 (33.3) | 6 (27.3) | 2 (33.3) | 0.785 |
| Long axis | ||||||||
| Apex, n (%) | 19 (22.4) | 19 (21.1) | 0 (0.0) | 0 (0.0) | 6 (40.0) | 9 (40.9) | 2 (33.3) | 0.271 |