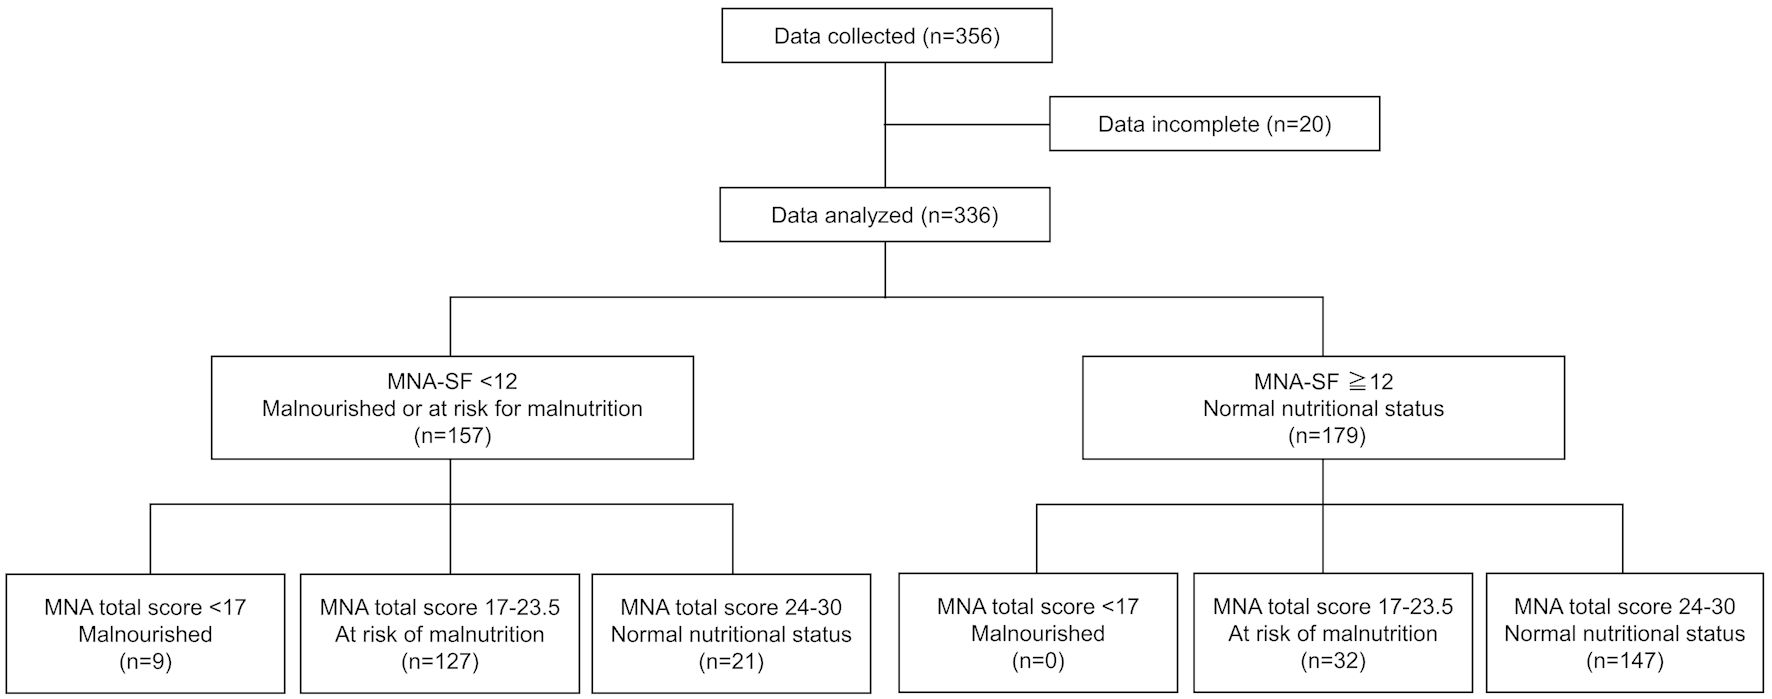
Figure 1. Study flow. CR: cardiac rehabilitation, MNA: Mini Nutritional Assessment; SF: short form.
| Cardiology Research, ISSN 1923-2829 print, 1923-2837 online, Open Access |
| Article copyright, the authors; Journal compilation copyright, Cardiol Res and Elmer Press Inc |
| Journal website https://www.cardiologyres.org |
Original Article
Volume 14, Number 2, April 2023, pages 133-141
Nutritional Status in Patients Undergoing Phase II Cardiac Rehabilitation by Mini Nutritional Assessment
Figures
Tables
| Total (N = 336) | MNA-SF < 12 (N = 157) | MNA-SF ≥ 12 (N = 179) | P | |
|---|---|---|---|---|
| P: Wilcoxon rank sum test or χ2 test. CR: cardiac rehabilitation; BMI: body mass index; CVD: cardiovascular disease; eGFR: estimated glomerular filtration rate; HDL-C: high-density lipoprotein cholesterol; LDL-C: low-density lipoprotein cholesterol; MNA: Mini Nutritional Assessment; SF: short form; TG: triglyceride; CRP: C-reactive protein; HbA1c: hemoglobin A1c; SD: standard deviation. | ||||
| Age (years), mean ± SD | 70.1 ± 11.4 | 70.3 ± 11.9 | 70.0 ± 11.0 | 0.44 |
| Sex (male), n (%) | 209 (62.2%) | 97 (61.8%) | 112 (62.6%) | 0.88 |
| CVD at the beginning for CR, n (%) | ||||
| Open heart surgery | 151 (44.9%) | 67 (42.7%) | 84 (46.9%) | 0.06 |
| Chronic heart failure | 119 (35.4%) | 65 (41.4%) | 54 (30.2%) | |
| Other | 66 (19.6%) | 25 (15.9%) | 41 (22.9%) | |
| Acute coronary syndrome, n (%) | 33 (9.8%) | 19 (12.1%) | 14 (7.8%) | 0.18 |
| BMI, mean ± SD | 23.1 ± 4.1 | 21.5 ± 3.9 | 24.4 ± 3.7 | < 0.05 |
| Hemoglobin (g/dL), mean ± SD | 12.8 ± 1.9 | 12.3 ± 1.9 | 13.2 ± 1.8 | < 0.05 |
| Creatinine (mg/dL), mean ± SD | 1.3 ± 1.8 | 1.4 ± 1.9 | 1.2 ± 1.6 | 0.07 |
| eGFR (mL/min/1.73 m2), mean ± SD | 60.8 ± 23.5 | 58.0 ± 24.8 | 63.2 ± 22.0 | 0.06 |
| TG (mg/dL), mean ± SD | 115.0 ± 56.5 | 116.2 ± 59.1 | 114 ± 54.7 | 0.88 |
| LDL-C (mg/dL), mean ± SD | 98.0 ± 28.7 | 97.9 ± 30.4 | 98.2 ± 27.3 | 0.65 |
| HDL-C (mg/dL), mean ± SD | 52.6 ± 15.8 | 50.8 ± 15.4 | 54.2 ± 16.1 | 0.07 |
| HbA1c (%), mean ± SD | 6.0 ± 0.8 | 6.0 ± 0.9 | 6.0 ± 0.6 | 0.19 |
| CRP (mg/dL), mean ± SD | 0.6 ± 1.6 | 0.6 ± 1.7 | 0.5 ± 1.4 | 0.75 |
| Number | Total (N = 336) | MNA-SF < 12 (N = 157) | MNA-SF ≥ 12 (N = 179) | P |
|---|---|---|---|---|
| P: Wilcoxon rank sum test or χ2 test. MNA: mini nutritional assessment; SF: short form. | ||||
| MNA | ||||
| Screening items: MNA-SF | ||||
| A. Has food intake declined over the past 3 months due to loss of appetite, digestive problems, chewing or swallowing difficulties? | 1.8 ± 0.5 | 1.7 ± 0.6 | 1.9 ± 0.3 | < 0.05 |
| B. Weight loss during the last 3 months? | 2.1 ± 1.1 | 1.5 ± 1.2 | 2.7 ± 0.6 | < 0.05 |
| C. Mobility | 1.9 ± 0.3 | 1.9 ± 0.3 | 2.0 ± 0.2 | < 0.05 |
| D. Has suffered psychological stress or acute disease in the past 3 months? | 1.4 ± 0.9 | 0.9 ± 1.0 | 1.8 ± 0.6 | < 0.05 |
| E. Neuropsychological problems | 2.0 ± 0.2 | 1.9 ± 0.3 | 2.0 ± 0.0 | < 0.05 |
| F. BMI | 2.1 ± 1.1 | 1.5 ± 1.1 | 2.6 ± 0.7 | < 0.05 |
| MNA-SF category | ||||
| Normal nutritional status: 12 - 14 points | 179 (53.3%) | 0 (0%) | 179 (100%) | < 0.05 |
| At risk of malnutrition: 8 - 11 points | 136 (40.5%) | 136 (86.6%) | 0 (0%) | |
| Malnourished: 0 - 7 points | 21 (6.3%) | 21 (13.4%) | 0 (0%) | |
| MNA assessment items | ||||
| G. Lives independently | 0.9 ± 0.4 | 0.9 ± 0.4 | 0.8 ± 0.4 | 0.93 |
| H. Takes more than four prescription drugs per day | 0.2 ± 0.4 | 0.1 ± 0.4 | 0.2 ± 0.4 | 0.11 |
| I. Pressure sores or skin ulcers | 0.7 ± 0.5 | 0.6 ± 0.5 | 0.7 ± 0.5 | 0.24 |
| J. How many full meals does the patient eat daily? | 1.9 ± 0.3 | 2.0 ± 0.2 | 1.9 ± 0.3 | < 0.05 |
| K. Selected consumption markers for protein intake | 0.8 ± 0.3 | 0.7 ± 0.3 | 0.8 ± 0.3 | < 0.05 |
| L. Consumes two or more servings of fruit or vegetables | 0.8 ± 0.4 | 0.8 ± 0.4 | 0.9 ± 0.4 | 0.4 |
| M. How much fluid is consumed per day? | 0.7 ± 0.3 | 0.7 ± 0.3 | 0.8 ± 0.3 | < 0.05 |
| N. Mode of feeding | 1.9 ± 0.3 | 1.9 ± 0.3 | 2.0 ± 0.3 | 0.59 |
| O. Self-assessment of nutritional status | 1.7 ± 0.5 | 1.6 ± 0.6 | 1.8 ± 0.4 | < 0.05 |
| P. In comparison with other people of the same age, how does the patient consider his/her health status? | 0.9 ± 0.7 | 0.8 ± 0.7 | 0.9 ± 0.7 | < 0.05 |
| Q. Mid-arm circumference in cm | 0.9 ± 0.3 | 0.8 ± 0.4 | 1.0 ± 0.1 | < 0.05 |
| R. Calf circumference in cm | 0.8 ± 0.4 | 0.7 ± 0.5 | 0.9 ± 0.3 | < 0.05 |
| MNA total score categories | ||||
| Normal nutritional status: 24 - 30 points | 168 (50.0%) | 21 (13.4%) | 147 (82.1%) | < 0.05 |
| At risk of malnutrition: 17 - 23.5 points | 159 (47.3%) | 127 (80.9%) | 32 (17.9%) | |
| Malnourished: < 17 points | 9 (2.7%) | 9 (5.7%) | 0 (0%) | |
| MNA-SF < 12 | P | MNA-SF ≥ 12 | P | |||
|---|---|---|---|---|---|---|
| MNA-total score < 24 | MNA-total score ≥ 24 | MNA-total score < 24 | MNA-total score ≥ 24 | |||
| CR: cardiac rehabilitation; CVD: cardiovascular disease; eGFR: estimated glomerular filtration rate; MNA: Mini Nutritional Assessment; SF: short form; BMI: body mass index; HDL-C: high-density lipoprotein cholesterol; LDL-C: low-density lipoprotein cholesterol; TG: triglyceride; CRP: C-reactive protein; HbA1c: hemoglobin A1c; SD: standard deviation. | ||||||
| Number | 136 | 21 | 32 | 147 | ||
| Age (years), mean ± SD | 70.1 ± 11.9 | 71.5 ± 11.8 | 0.48 | 69.3 ± 9.4 | 70.1 ± 11.4 | 0.30 |
| Sex (male), n (%) | 80 (58.8%) | 17 (81.0%) | < 0.05 | 17 (53.1%) | 95 (64.6%) | 0.22 |
| CVD at beginning of CR, n (%) | ||||||
| Open heart surgery | 57 (41.9%) | 10 (47.6%) | 0.36 | 16 (50.0%) | 68 (46.3%) | 0.81 |
| Chronic heart failure | 59 (43.4%) | 6 (28.6%) | 10 (31.3%) | 44 (29.9%) | ||
| Other | 20 (14.7%) | 5 (23.8%) | 6 (18.8%) | 35 (23.8%) | ||
| BMI, mean ± SD | 21.4 ± 4.1 | 22.0 ± 2.2 | 0.14 | 24.2 ± 6.0 | 24.5 ± 3.0 | < 0.05 |
| Hemoglobin (g/dL), mean ± SD | 12.1 ± 2.0 | 13.4 ± 1.3 | < 0.05 | 13.0 ± 1.9 | 13.2 ± 1.7 | 0.52 |
| Creatinine (mg/dL), mean ± SD | 1.45 ± 2.07 | 1.00 ± 0.66 | 0.61 | 1.47 ± 1.93 | 1.12 ± 1.51 | 0.36 |
| eGFR (mL/min/1.73 m2), mean ± SD | 57.3 ± 25.8 | 62.7 ± 16.3 | 0.35 | 57.7 ± 26.8 | 64.4 ± 20.8 | 0.17 |
| TG (mg/dL), mean ± SD | 120.5 ± 60.4 | 86.4 ± 40.7 | 0.10 | 129.3 ± 56.3 | 112.0 ± 54.6 | 0.32 |
| LDL-C (mg/dL), mean ± SD | 97.5 ± 31.0 | 100.2 ± 27.5 | 0.54 | 95.3 ± 25.4 | 98.7 ± 27.7 | 0.77 |
| HDL-C (mg/dL), mean ± SD | 49.9 ± 15.0 | 56.3 ± 16.7 | 0.14 | 55.3 ± 18.4 | 54.0 ± 15.7 | 0.88 |
| HbA1c (%), mean ± SD | 6.1 ± 1.0 | 5.8 ± 0.5 | 0.14 | 6.0 ± 0.7 | 6.0 ± 0.6 | 0.86 |
| CRP (mg/dL), mean ± SD | 0.72 ± 1.85 | 0.19 ± 0.32 | < 0.05 | 0.23 ± 0.41 | 0.59 ± 1.56 | 0.52 |
| MNA-assessment | ||||||
| G. Lives independently | 0.8 ± 0.4 | 0.9 ± 0.3 | 0.46 | 0.7 ± 0.5 | 0.9 ± 0.3 | < 0.05 |
| H. Takes more than four prescription drugs per day | 0.1 ± 0.3 | 0.3 ± 0.5 | 0.05 | 0.1 ± 0.3 | 0.2 ± 0.4 | 0.07 |
| I. Pressure sores or skin ulcers | 0.6 ± 0.5 | 0.8 ± 0.4 | 0.10 | 0.5 ± 0.5 | 0.8 ± 0.4 | < 0.05 |
| J. How many full meals does the patient eat daily? | 2.0 ± 0.2 | 2.0 ± 0.0 | 0.42 | 1.8 ± 0.4 | 1.9 ± 0.3 | 0.38 |
| K. Selected consumption markers for protein intake | 0.7 ± 0.4 | 0.9 ± 0.2 | < 0.05 | 0.5 ± 0.4 | 0.9 ± 0.3 | < 0.05 |
| L. Consumes two or more servings of fruit or vegetables | 0.8 ± 0.4 | 1.0 ± 0.0 | < 0.05 | 0.6 ± 0.5 | 0.9 ± 0.3 | < 0.05 |
| M. How much fluid is consumed per day? | 0.6 ± 0.3 | 0.9 ± 0.2 | < 0.05 | 0.6 ± 0.4 | 0.8 ± 0.3 | < 0.05 |
| N. Mode of feeding | 1.9 ± 0.4 | 2.0 ± 0.0 | 0.32 | 1.8 ± 0.6 | 2.0 ± 0.1 | < 0.05 |
| O. Self-assessment of nutritional status | 1.6 ± 0.6 | 2.0 ± 0.2 | < 0.05 | 1.4 ± 0.6 | 1.9 ± 0.3 | < 0.05 |
| P. In comparison with other people of the same age, how does the patient consider his/her health status? | 1.6 ± 0.6 | 2.0 ± 0.2 | < 0.05 | 0.4 ± 0.4 | 1.1 ± 0.7 | < 0.05 |
| Q. Mid-arm circumference in cm | 0.8 ± 0.4 | 0.9 ± 0.2 | 0.06 | 0.9 ± 0.3 | 1.0 ± 0.1 | 0.38 |
| R. Calf circumference in cm | 0.7 ± 0.5 | 0.9 ± 0.4 | 0.11 | 0.8 ± 0.4 | 0.9 ± 0.2 | < 0.05 |