Figures
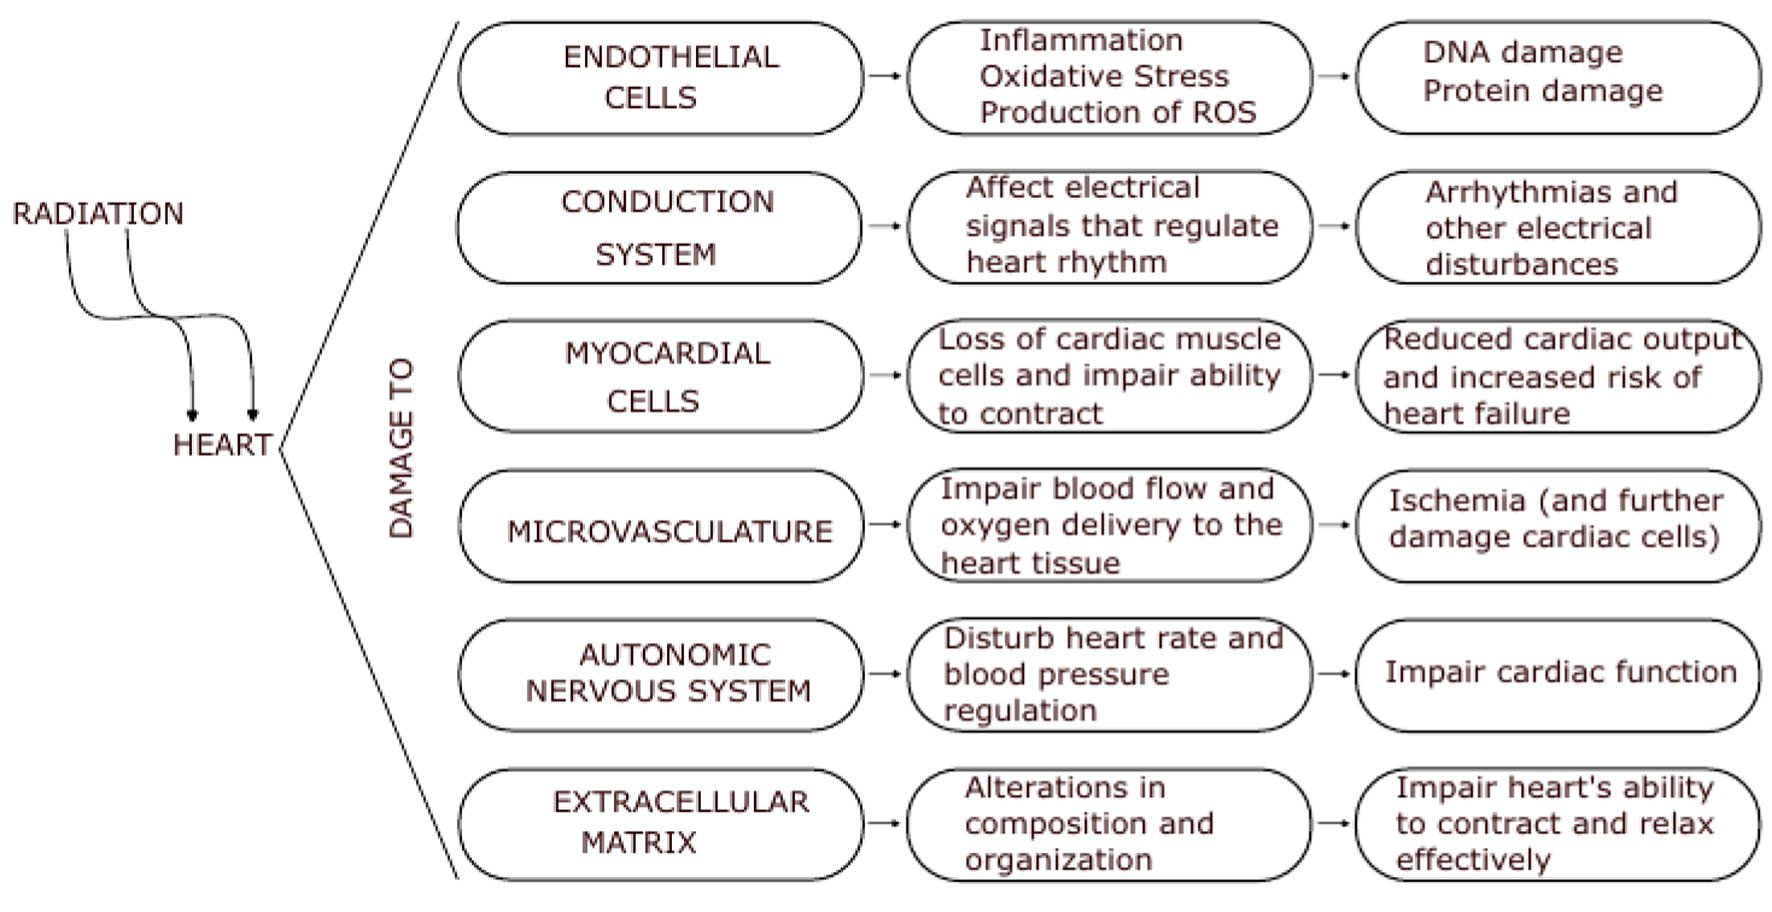
Figure 1. Effect of radiation on the heart. The physiopathology of radiation damage on the heart is complex and multifactorial, involving damage to the endothelial cells, conduction system, and myocardial cells themselves. The severity of radiation-induced cardiotoxicity depends on a variety of factors, including the dose and duration of radiation exposure, as well as individual patient factors such as age and underlying cardiovascular health.
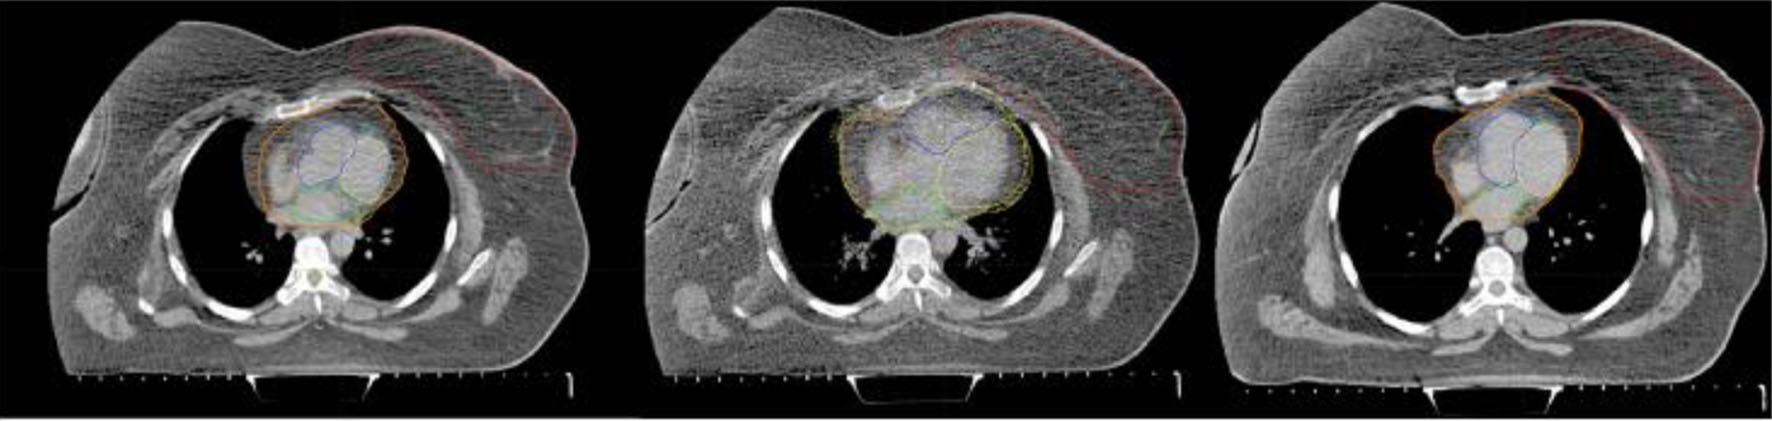
Figure 2. Example of the set of images acquired for one patient: free breathing CT (left); paCT (middle); and DIBH CT (right). Red contours correspond to the target, while yellow, blue, green and orange contoured substructures in the heart correspond to left and right ventricles and left and right atria, respectively. Blurred heart and cardia substructures can be seen in the central image due to movement. CT: computed tomography; DIBH: deep inspiration breath-hold; paCT: phase-average CT.
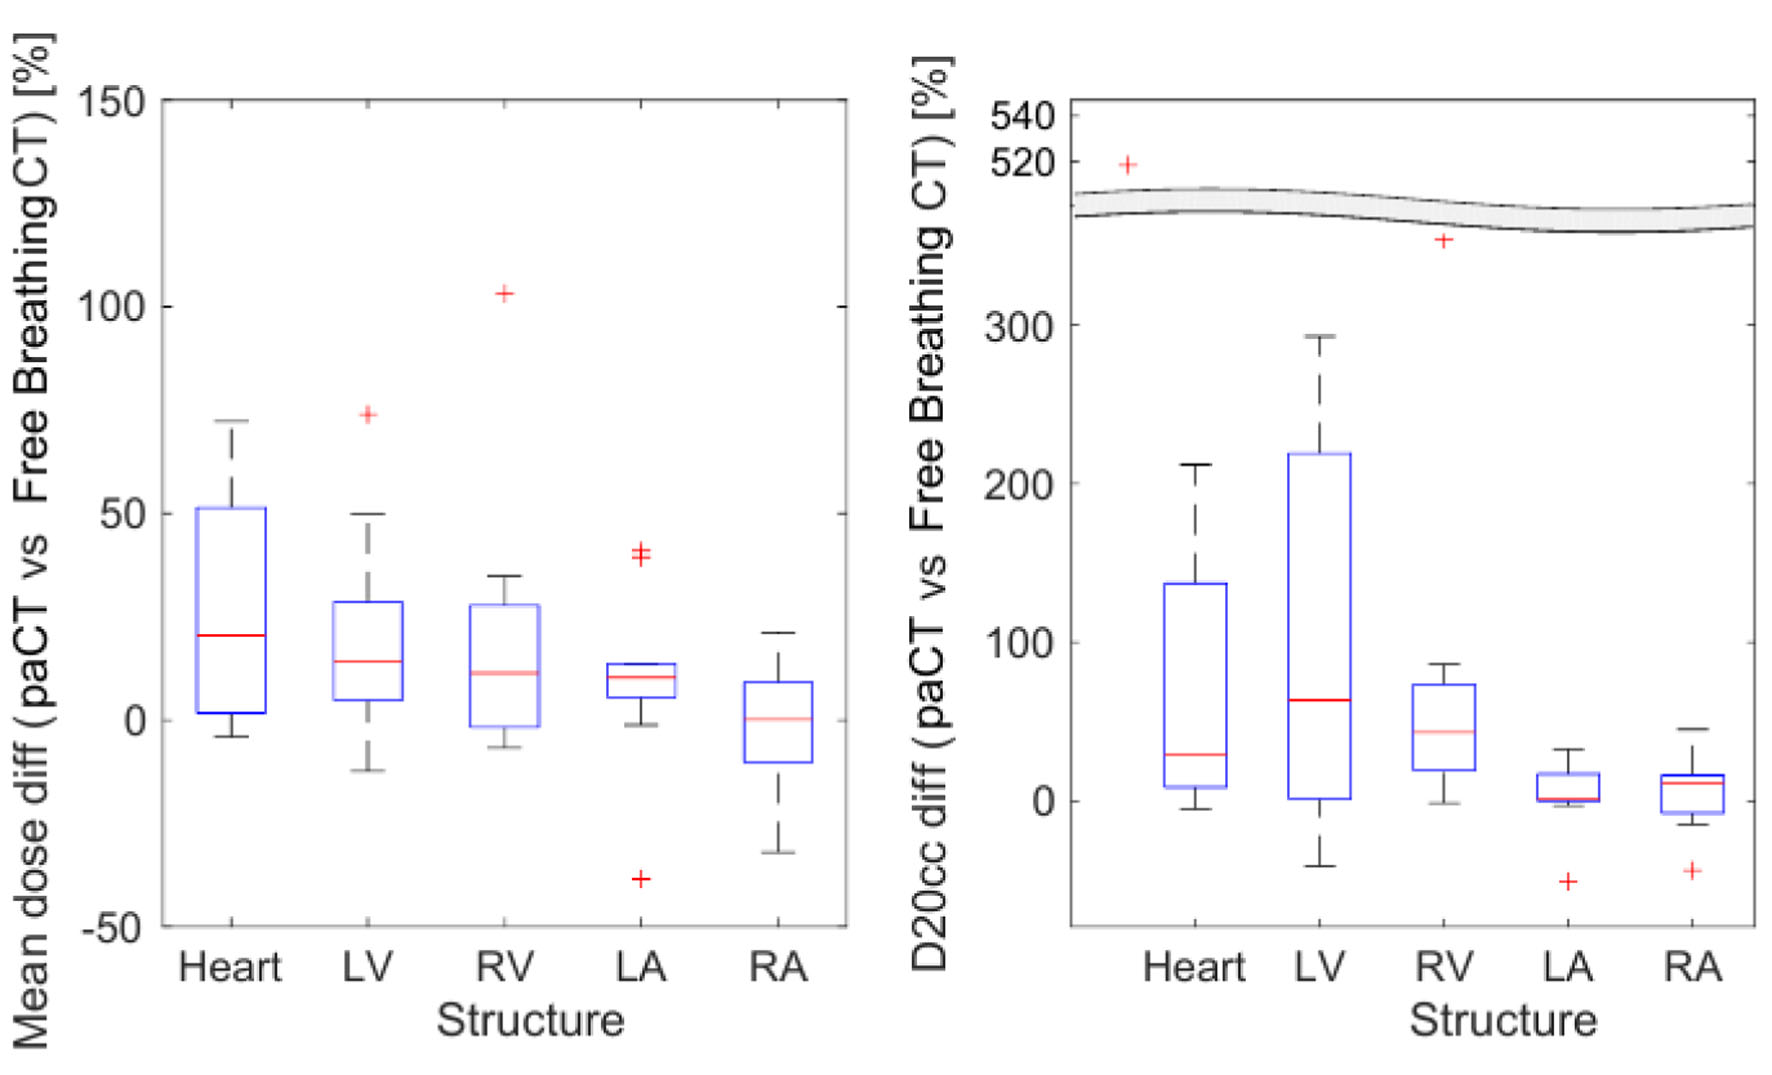
Figure 3. Difference between patients’ doses calculated using paCT and FB CT images. Mean dose (left) and D20cc (right) for each structure. CT: computed tomography; D20cc: minimum dose to the 20 most irradiated cubic centimeters of volume; FB: free breathing; paCT: phase-average CT.
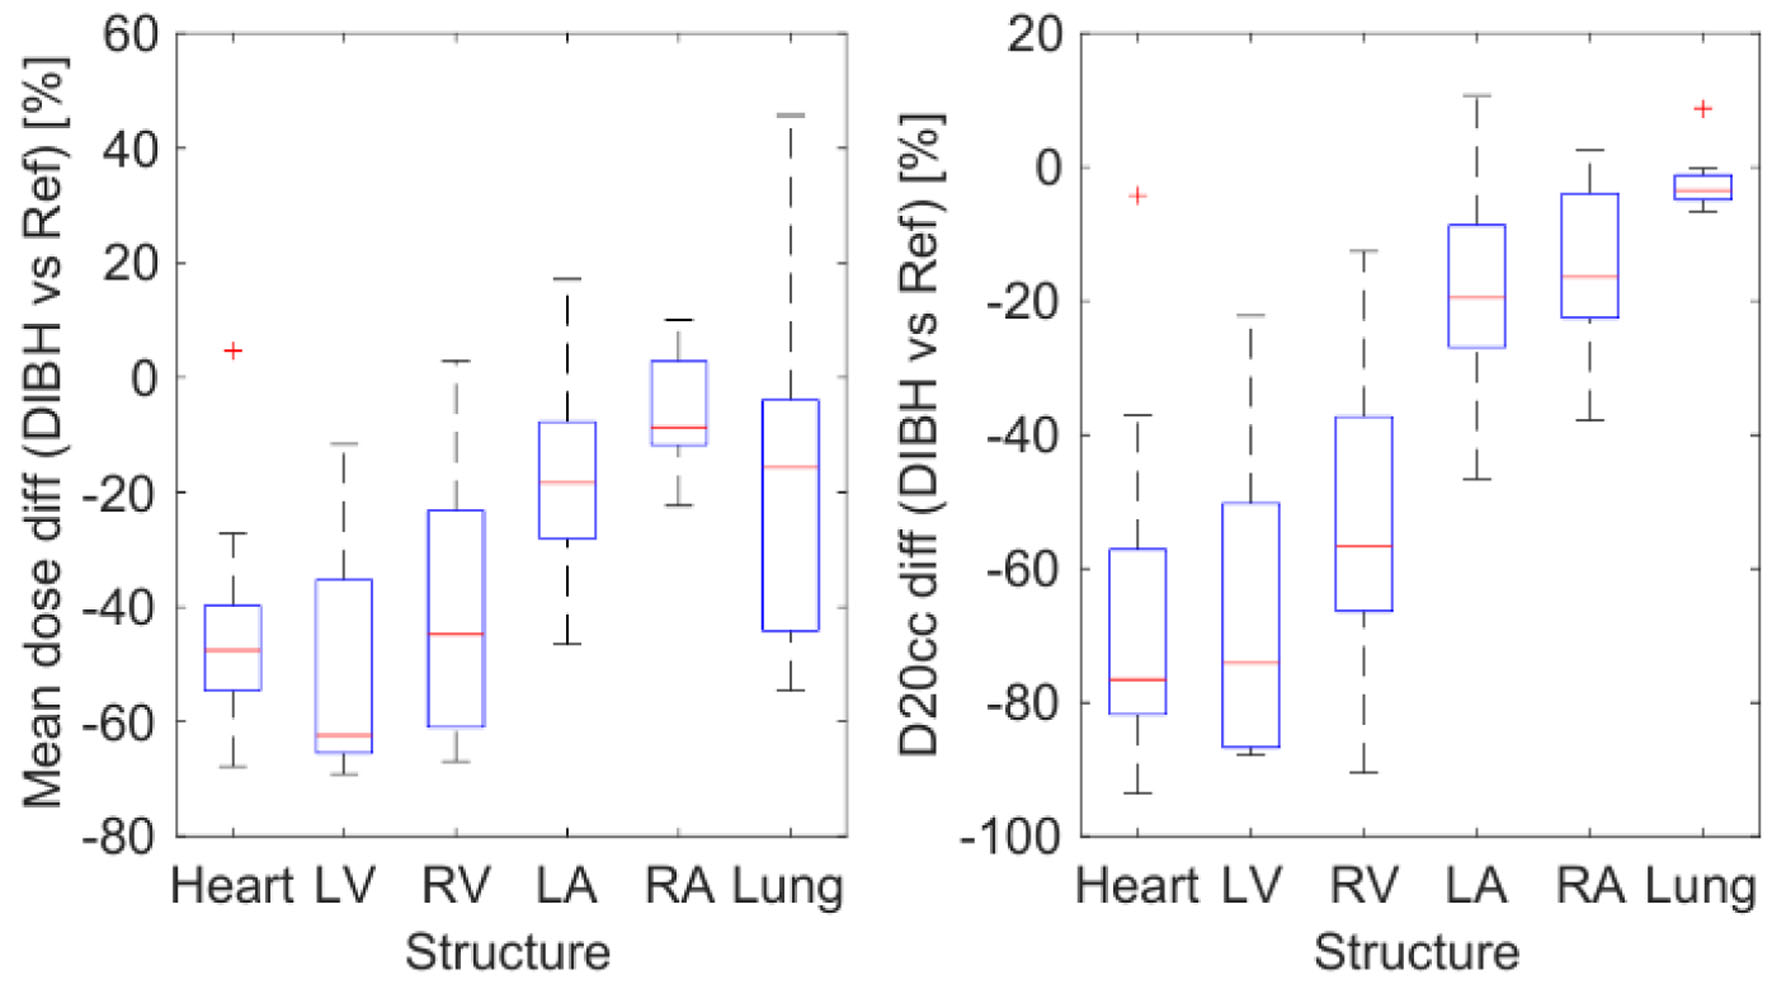
Figure 4. Difference of mean dose (left) and D20cc (right) on each structure for the 10 patients, calculated for the DIBH plan vs. the reference plan. DIBH: deep inspiration breath-hold; D20cc: minimum dose to the 20 most irradiated cubic centimeters of volume.
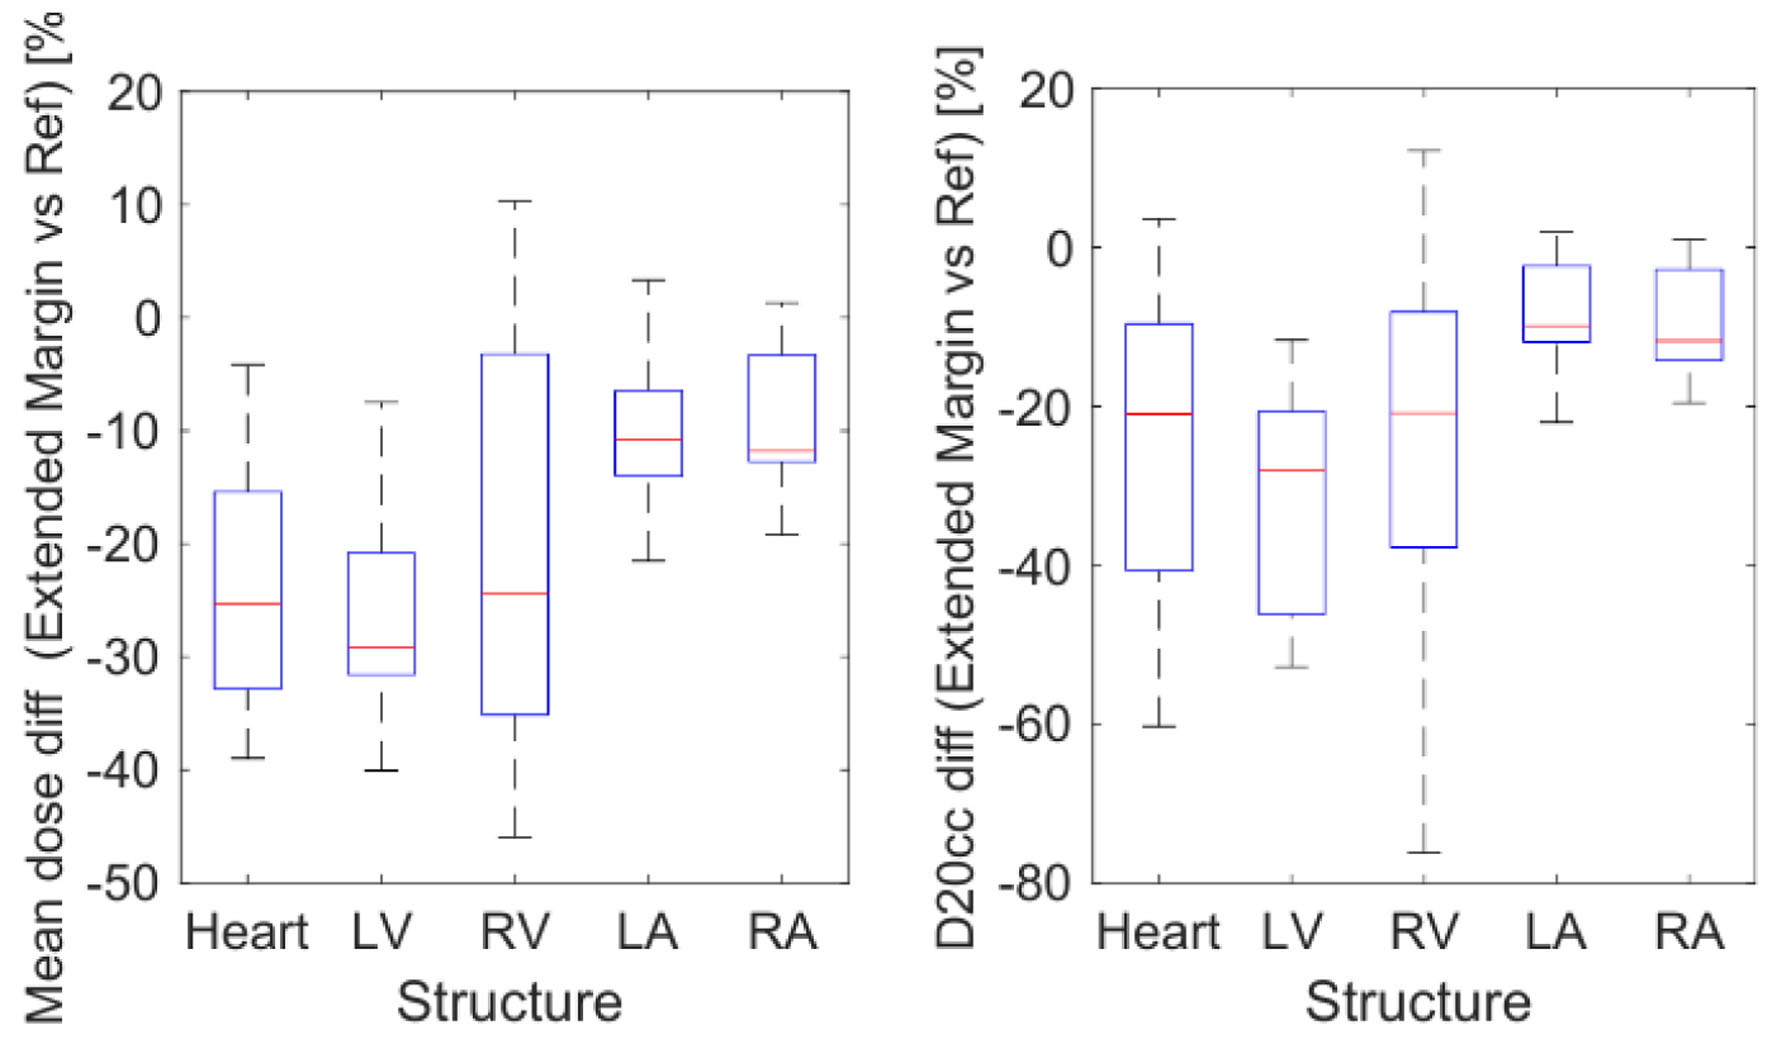
Figure 5. Difference of mean dose (left) and D20cc (right) on each structure for the 10 patients, calculated for the extended margin plan vs. the reference plan. D20cc: minimum dose to the 20 most irradiated cubic centimeters of volume.
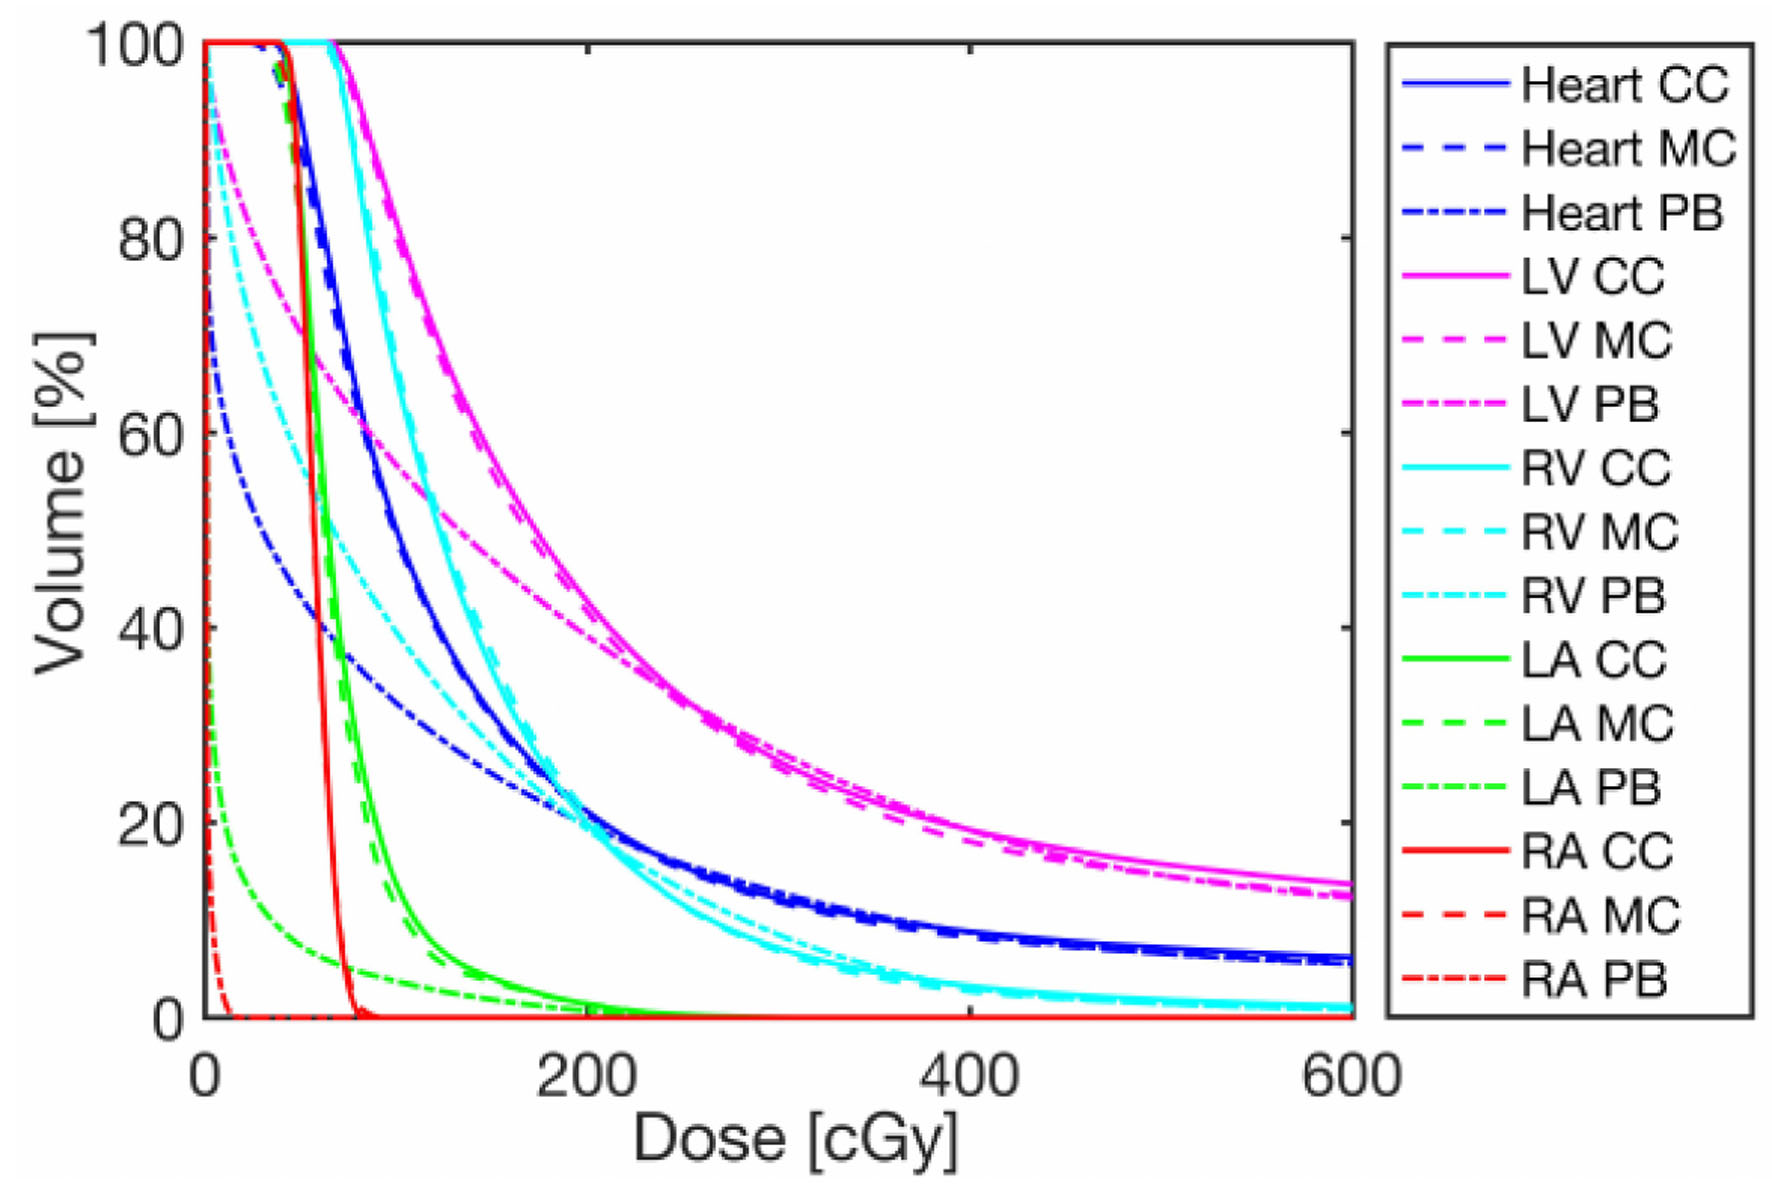
Figure 6. Representative DVH of one patient for the heart and cardiac substructures calculated with the three algorithms: PB, CC and MC. DVHs for the target, heart and its substructures. CC: collapsed cone; DVH: dose volume histogram; MC: Monte Carlo; PB: pencil beam.
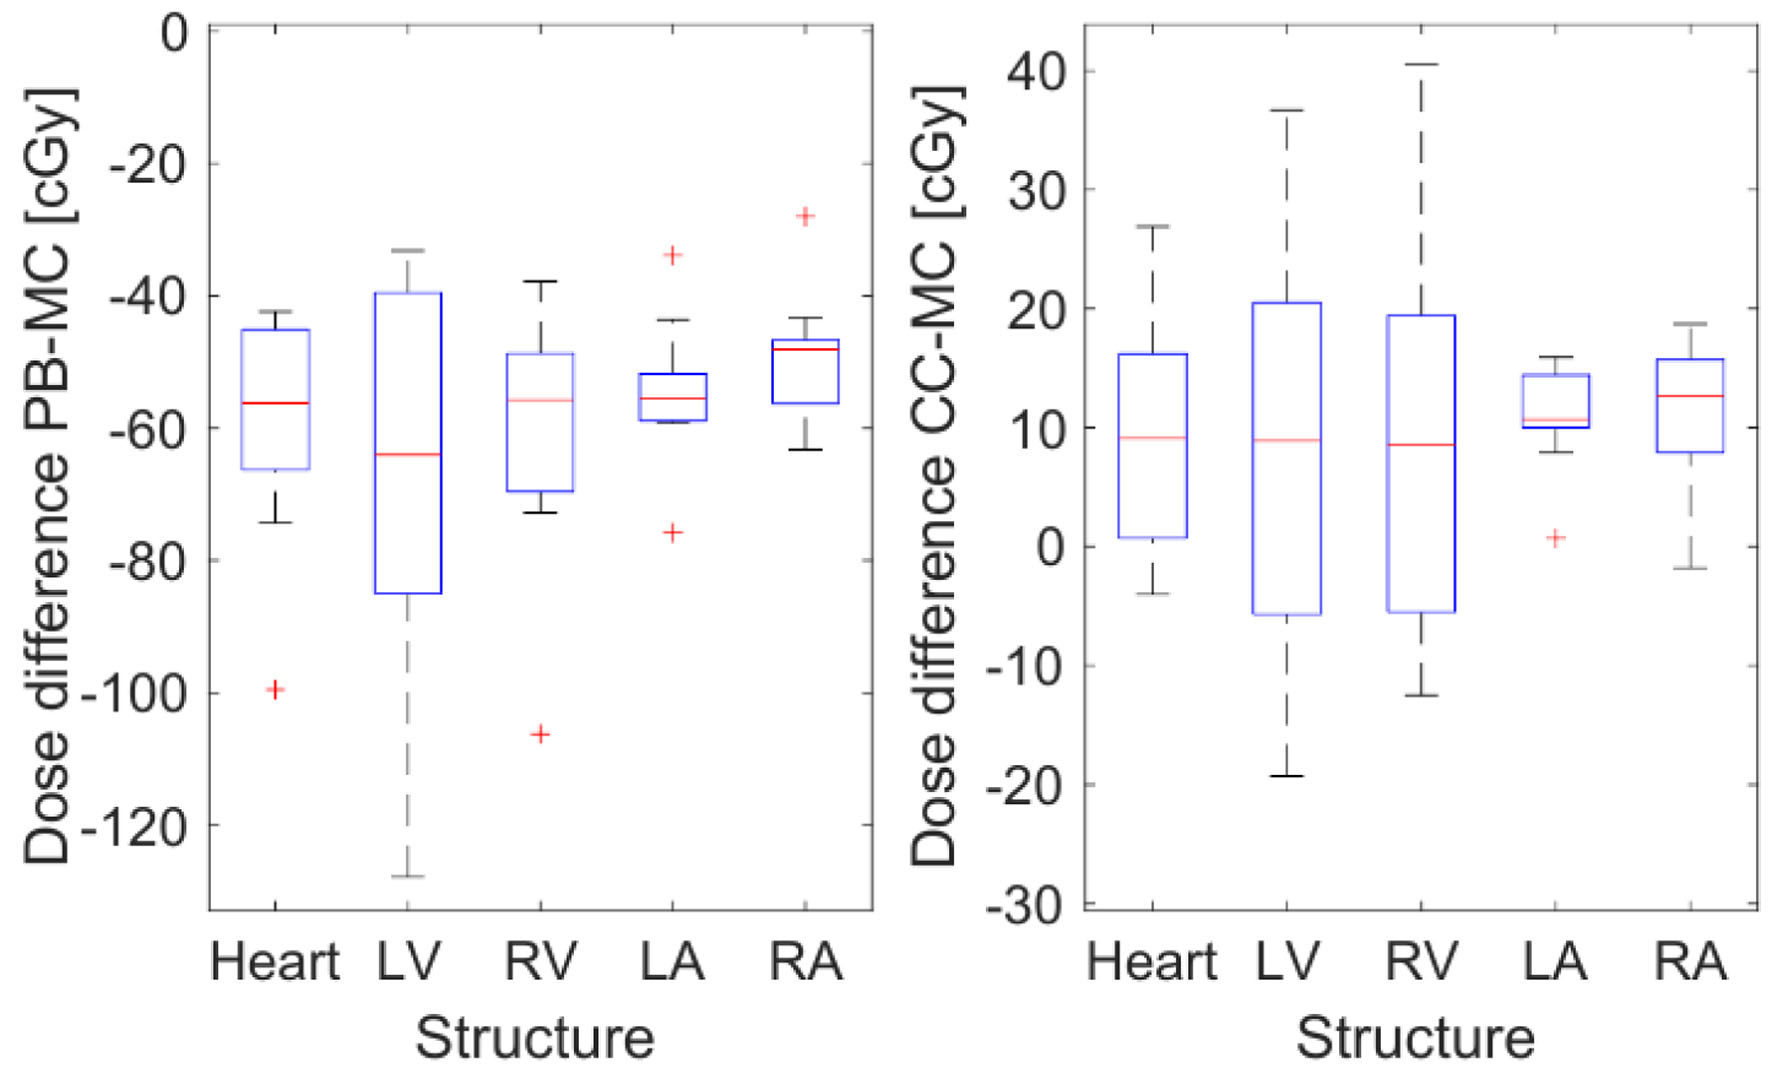
Figure 7. Mean difference in cGy between patient mean doses calculated for different structures with PB, CC and MC in Monaco. The dose calculated with Monte Carlo is used as a reference. CC: collapsed cone; MC: Monte Carlo; PB: pencil beam.
Tables
Table 1. Cohort of Patients Along With Their Respective Medical History and Treatment Plan
| Patient 1 | Patient 2 | Patient 3 | Patient 4 | Patient 5 | Patient 6 | Patient 7 | Patient 8 | Patient 9 | Patient 10 |
|---|
| AHT: arterial hypertension; BMI: body mass index; DLP: dyslipidemia; DM2: diabetes mellitus type 2; RT: radiotherapy. |
| Age | 45 | 42 | 75 | 49 | 59 | 43 | 69 | 63 | 67 | 61 |
| Previous RT | No | No | Yes | No | No | No | No | No | No | Yes |
| Total Gy | 52.5 | 50 | 40 | 40 | 40 | 40 | 40 | 40 | 42.5 | 66 |
| Fractions | 20 | 20 | 15 | 15 | 15 | 15 | 15 | 15 | 16 | 33 |
| Boost | Yes | Yes | No | No | No | No | No | No | No | Yes |
| Height (cm) | - | 165 | - | 157 | 154 | 164 | 156 | 163 | 152 | 163 |
| Weight (kg) | 67 | 106 | 66 | 55 | 68 | 60 | 57 | 79.5 | 80 | 104 |
| BMI | - | 38.9 | - | 22.3 | 28.6 | 22.3 | 23.4 | 29.9 | 34.6 | 39.1 |
| Smoker | Yes | Yes | Yes | Yes | Yes | No | Yes | Yes | No | Yes |
| DM2 | No | Yes | No | No | Yes | No | No | Yes | No | No |
| AHT | No | No | No | No | Yes | No | Yes | No | Yes | No |
| DLP | No | Yes | No | No | No | No | No | Yes | No | Yes |
Table 2. Volume and Dose Parameter Values (Mean Dose and D20cc) for the Heart and Its Substructures on FB and Volume Increments due to Movement
| FB CT volume (cc) | FB CT mean dose (cGy) | FB CT D20cc (cGy) | paCT volume increment (%) |
|---|
| CT: computed tomography; FB: free breathing; LA: left atrium; LV: left ventricle; RA: right atrium; RV: right ventricle; paCT: phase-average CT. |
| Heart | 679 ± 46 | 236 ± 29 | 1,650 ± 430 | 19.9 ± 8.1 |
| LV | 171.4 ± 3.9 | 381 ± 64 | 830 ± 200 | 35 ± 11 |
| RV | 106.0 ± 6.8 | 256 ± 57 | 293 ± 56 | 36 ± 14 |
| LA | 78 ± 13 | 74.2 ± 3.3 | 82.3 ± 4.4 | 0.8 ± 6.4 |
| RA | 67.7 ± 6.2 | 65.6 ± 3.7 | 70.1 ± 3.2 | 42 ± 14 |
Table 3. Comparison of V2 and V5 Values Calculated on FB CT and paCT Image Sets for the Reference Plan
| | | Heart | LV | RV | LA |
|---|
| As reference, parameter values are also shown as a percentage of the corresponding substructure volume. Right atrium’s parameters were excluded from this table as all values were equal to zero within uncertainties. CT: computed tomography; FB: free breathing; LA: left atrium; LV: left ventricle; RV: right ventricle; paCT: phase-average CT. |
| FB CT | V2 | (cc) | 129 ± 17 | 61.2 ± 7.8 | 29.5 ± 5.8 | 0.14 ± 0.11 |
| | (%) | 18.9 ± 2.0 | 36.0 ± 4.8 | 27.1 ± 4.9 | 0.22 ± 0.18 |
| V5 | (cc) | 46.0 ± 7.6 | 23.2 ± 4.1 | 7.8 ± 2.9 | 0 ± 0 |
| | (%) | 6.8 ± 1.0 | 13.7 ± 2.5 | 7.1 ± 2.6 | 0 ± 0 |
| paCT | V2 | (cc) | 180 ± 25 | 85 ± 13 | 40.0 ± 6.0 | 2.1 ± 1.1 |
| | (%) | 22.0 ± 2.3 | 36.5 ± 4.7 | 29.3 ± 4.0 | 3.0 ± 1.5 |
| V5 | (cc) | 75 ± 12 | 37.1 ± 7.1 | 13.0 ± 4.0 | 0.24 ± 0.16 |
| | (%) | 9.1 ± 1.3 | 15.8 ± 2.7 | 9.2 ± 2.6 | 0.32 ± 0.22 |
Table 4. Comparison of V2 and V5 Values for the Reference, Extended Margin and DIBH Plans
| | | Heart | LV | RV | LA |
|---|
| As reference, parameter values as a percentage of the corresponding substructure volume are also shown. Right atrium’s parameters were excluded from this table as all values were equal to zero within uncertainties. DIBH: deep inspiration breath-hold; LA: left atrium; LV: left ventricle; RV: right ventricle. |
| Reference | V2 | (cc) | 180 ± 25 | 85 ± 13 | 40.0 ± 6.0 | 2.1 ± 1.1 |
| | (%) | 22.0 ± 2.3 | 36.5 ± 4.7 | 29.3 ± 4.0 | 3.0 ± 1.5 |
| V5 | (cc) | 75 ± 12 | 37.1 ± 7.1 | 13.0 ± 4.0 | 0.24 ± 0.16 |
| | (%) | 9.1 ± 1.3 | 15.8 ± 2.7 | 9.2 ± 2.6 | 0.32 ± 0.22 |
| Extended margin | V2 | (cc) | 152 ± 26 | 73 ± 13 | 31.4 ± 7.1 | 1.44 ± 0.73 |
| | (%) | 18.1 ± 2.6 | 30.8 ± 4.7 | 21.9 ± 4.3 | 2.0 ± 1.0 |
| V5 | (cc) | 59 ± 13 | 29.2 ± 6.6 | 8.9 ± 4.0 | 0.104 ± 0.074 |
| | (%) | 6.9 ± 1.4 | 12.1 ± 2.6 | 5.8 ± 2.5 | 0.14 ± 0.10 |
| DIBH | V2 | (cc) | 98 ± 24 | 44 ± 10 | 15.7 ± 5.2 | 0.27 ± 0.19 |
| | (%) | 14.8 ± 3.5 | 24.8 ± 5.5 | 17.1 ± 5.5 | 0.62 ± 0.48 |
| V5 | (cc) | 27.9 ± 8.3 | 12.4 ± 3.9 | 2.5 ± 1.4 | 0 ± 0 |
| | (%) | 4.2 ± 1.2 | 7.0 ± 2.0 | 2.5 ± 1.4 | 0 ± 0 |
Table 5. Mean Dose to the Target Calculated With the Different Algorithms, and Their Difference in Percentage in Respect to MC
| Mean dose to the target (cGy) | Comparison to MC (%) |
|---|
| CC: collapsed cone; MC: Monte Carlo; PB: pencil beam. |
| MC | 4558,67 | 0 |
| PB | 4490,21 | -1,35 |
| CC | 4565,27 | 0,21 |
Table 6. Mean EQD2 and Mean Relative Increase of Ischemic Heart Disease Risk Corresponding to the Dosimetric Scenarios Analyzed: Conventional (Reference) Treatment Calculated on FB CT or paCT, Extended Margin and DIBH Plans
| Mean EQD2 (Gy) | Relative risk increment (%) |
|---|
| The reported risk uncertainties only consider dose variations within the cohort. CT: computed tomography; DIBH: deep inspiration breath-hold; EQD2: equivalent dose in 2 Gy fractions; FB: free breathing; paCT: phase-average CT. |
| Base plan (FB CT) | 1.75 ± 0.30 | 14.7 ± 2.5 |
| Reference (paCT) | 2.46 ± 0.43 | 20.7 ± 3.6 |
| Extended margin | 1.88 ± 0.37 | 15.8 ± 3.1 |
| DIBH | 1.17 ± 0.24 | 9.8 ± 2.0 |