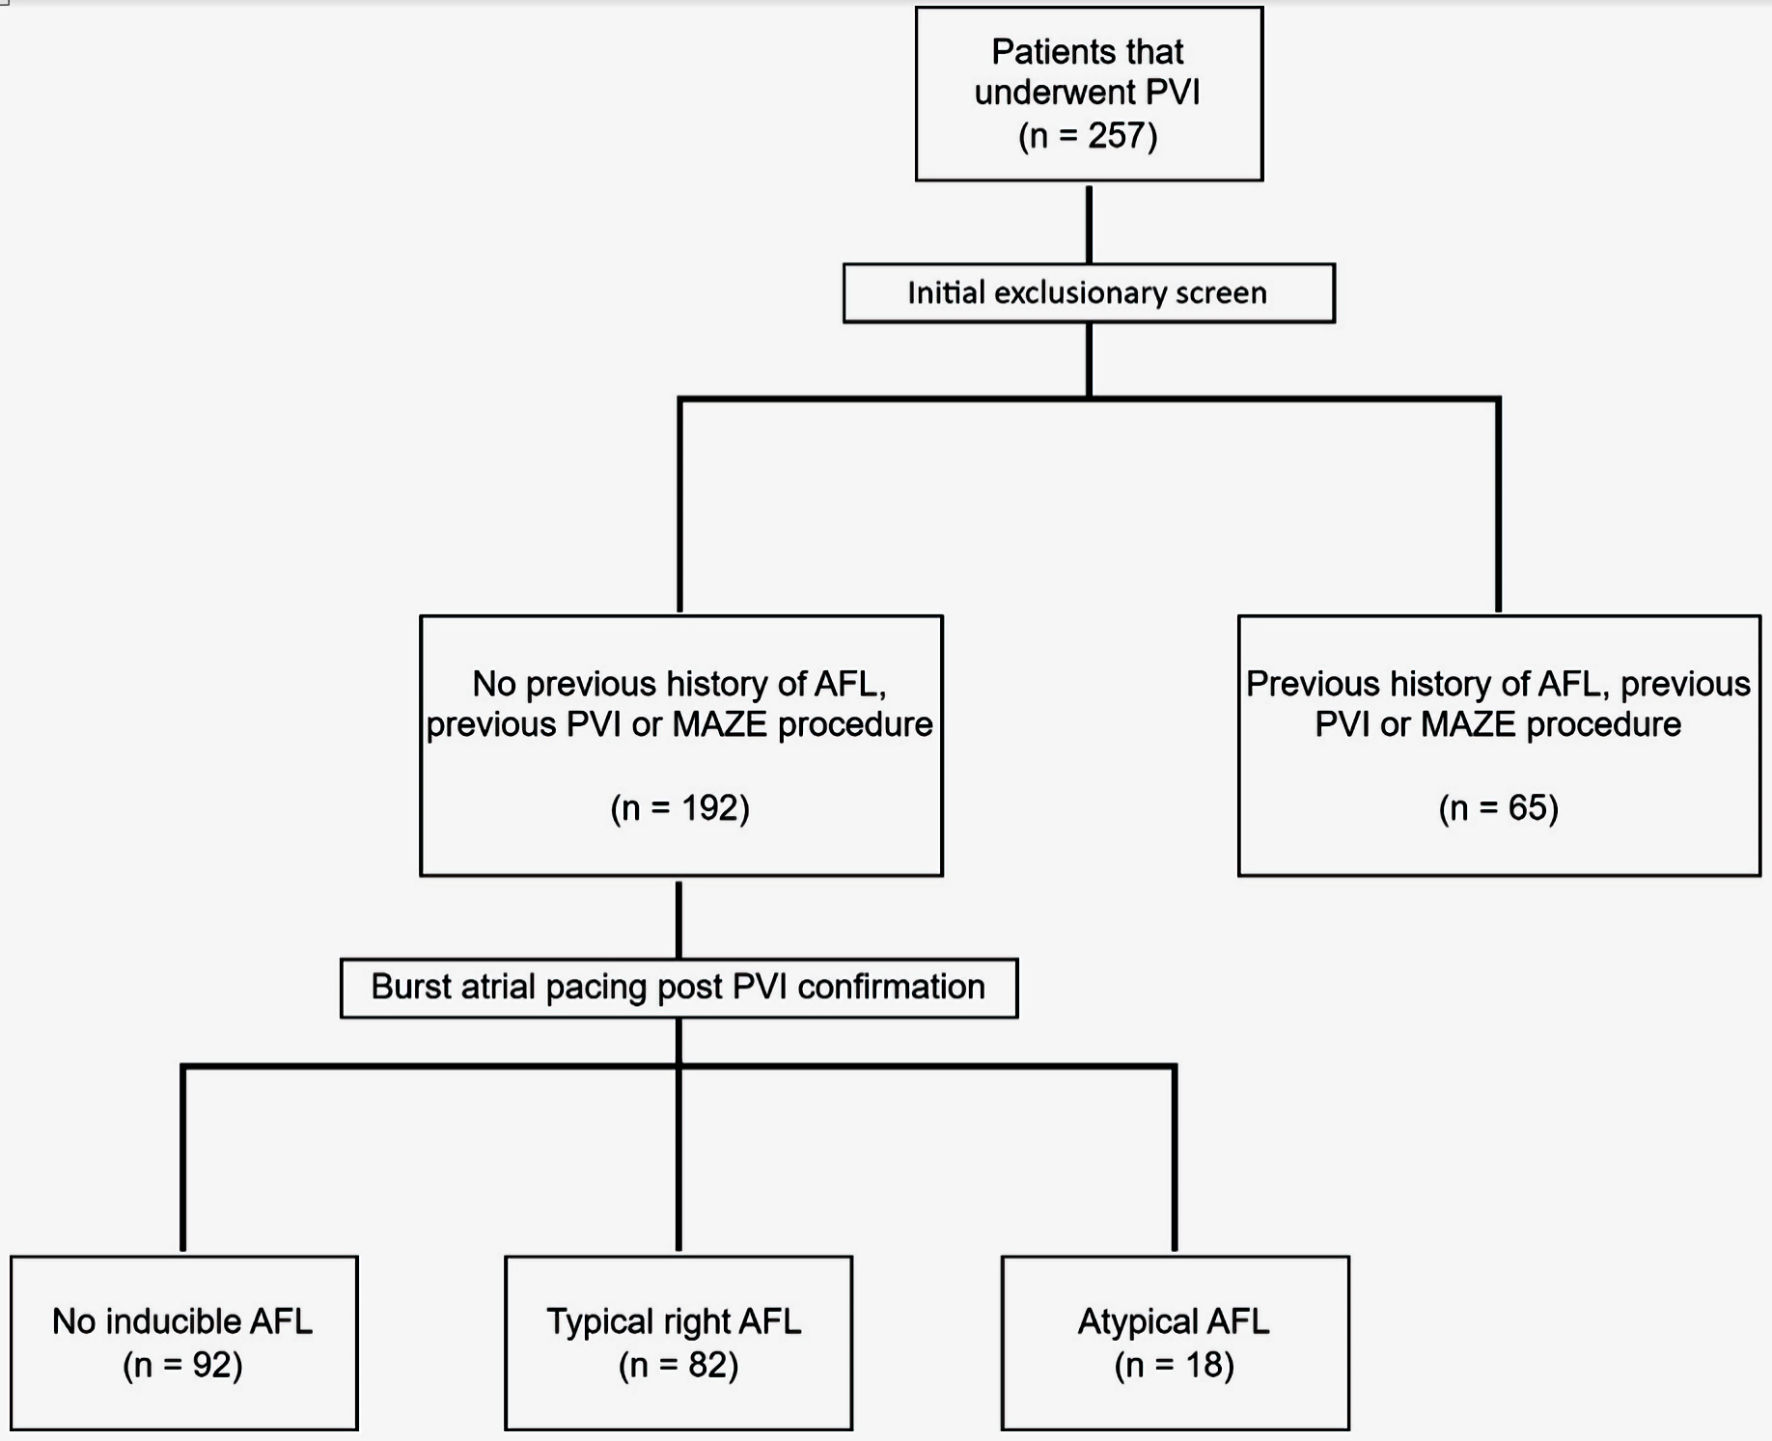
Figure 1. Flow diagram illustrating patient selection. AFL: atrial flutter; PVI: pulmonary vein isolation; Maze: Cox maze procedure.
| Cardiology Research, ISSN 1923-2829 print, 1923-2837 online, Open Access |
| Article copyright, the authors; Journal compilation copyright, Cardiol Res and Elmer Press Inc |
| Journal website https://www.cardiologyres.org |
Original Article
Volume 14, Number 3, June 2023, pages 183-191
Obstructive Sleep Apnea as a Predictor of Inducible Atrial Flutter During Pulmonary Vein Isolation in Patients With Atrial Fibrillation: Clinical Significance and Follow-Up Outcomes
Figures
Tables
| Characteristics | All patients (n =192) |
|---|---|
| Data for continuous variables (Age and BMI) are expressed as median and range. Data for categorical variables is expressed as mean ± standard deviation or proportion (percentages). AF: atrial fibrillation; BMI: body mass index; COPD: chronic obstructive pulmonary disease; OSA: obstructive sleep apnea. | |
| Age (years) | 66 (49 -71) |
| Sex | |
| Male | 122 (63.5%) |
| Female | 70 (36.5%) |
| BMI | 32 (28 - 37) |
| Medical history | |
| OSA | 92 (47.9%) |
| COPD | 12 (6.3%) |
| Asthma | 10 (5.2%) |
| Hypertension | 153 (79.7%) |
| Hyperlipidemia | 132 (68.8%) |
| Diabetes mellitus | 50 (26%) |
| Coronary artery disease | 58 (30.2%) |
| Failed previous antiarrhythmic | 86 (44.8%) |
| Procedural indication | |
| Paroxysmal AF | 90 (46.9%) |
| Persistent AF | 102 (53.1%) |
| Drugs | All patients (n = 192) | Any inducible atrial flutter (n = 100) | P value | Typical right atrial flutter (n = 82) | P value | Atypical atrial flutter (n = 18) | P value |
|---|---|---|---|---|---|---|---|
| Data are expressed as mean ± standard deviation or proportion (percentages). *P < 0.05 indicates the difference between the two groups is statistically significant. ACEI: angiotensin-converting enzyme inhibitors; ARB: angiotensin receptor blockers; SGLT2-I: sodium-glucose cotransporter-2 inhibitors; DOAC: direct oral anticoagulants; non-DHP CCB: non-dihydropyridine calcium channel blockers. | |||||||
| Home medications | |||||||
| Beta blocker | 103 (53.6%) | 63 (63%) | 0.01* | 52 (63.4%) | 0.01* | 11 (61.1%) | 0.20 |
| Non-DHP CCB | 50 (26.0%) | 21 (21%) | 0.10 | 16 (19.5%) | 0.07 | 5 (27.8%) | 0.75 |
| ACEI | 49 (25.5%) | 30 (30%) | 0.19 | 27 (32.9%) | 0.10 | 3 (16.7%) | 0.76 |
| ARBs | 36 (18.8%) | 15 (15%) | 0.17 | 13 (15.9%) | 0.25 | 2 (11.1%) | 0.26 |
| Sacubitril/valsartan | 7 (3.6%) | 3 (3%) | 0.62 | 3 (3.7%) | 1.0 | 0 (0%) | 1.0 |
| SGLT2-I | 3 (1.6%) | 0 (0%) | 0.11 | 0 (0%) | 0.25 | 0 (0%) | 1.0 |
| Spironolactone | 19 (9.9%) | 12 (12%) | 0.31 | 12 (14.6%) | 0.14 | 0 (0%) | 0.60 |
| Thiazide | 19 (9.9%) | 11 (11%) | 0.58 | 10 (12.2%) | 0.43 | 1 (5.6%) | 1.0 |
| Digoxin | 2 (1.0%) | 1 (1%) | 1.0 | 1 (1.2%) | 1.0 | 0 (0%) | 1.0 |
| Loop diuretic | 39 (20.3%) | 26 (26%) | 0.07 | 23 (28%) | 0.04* | 3 (16.7%) | 1.0 |
| Statin | 101 (52.6%) | 56 (56%) | 0.41 | 47 (57.3%) | 0.33 | 9 (50%) | 1.0 |
| Aspirin | 46 (24%) | 22 (22%) | 0.41 | 18 (21.9%) | 0.43 | 4 (22.2%) | 0.78 |
| DOAC | 162 (84.4%) | 86 (86%) | 0.66 | 72 (87.8%) | 0.44 | 14 (77.8%) | 0.54 |
| Warfarin | 13 (6.8%) | 9 (9%) | 0.26 | 5 (6.1%) | 0.74 | 4 (22.2%) | 0.02* |
| Current antiarrhythmic therapy | |||||||
| Amiodarone | 105 (54.7%) | 59 (59%) | 0.53 | 51 (62.2%) | 0.32 | 8 (44.4%) | 0.42 |
| Dronedarone | 8 (4.2%) | 2 (2%) | 0.21 | 1 (1.2%) | 0.19 | 1 (5.6%) | 0.24 |
| Sotalol | 6 (3.1%) | 3 (3%) | 0.75 | 3 (3.7%) | 0.74 | 0 (0%) | 0.71 |
| Dofetilide | 5 (2.6%) | 1 (1%) | 0.34 | 1 (1.2%) | 0.44 | 0 (0%) | 0.60 |
| Flecainide | 24 (12.5%) | 12 (12%) | 0.95 | 8 (9.8%) | 0.79 | 4 (22.2%) | 0.47 |
| Propafenone | 2 (1.0%) | 2 (2%) | 0.09 | 2 (2.4%) | 0.11 | 0 (0%) | 0.59 |
| Previous/failed antiarrhythmic therapy | |||||||
| Amiodarone | 20 (10.4%) | 10 (10%) | 0.53 | 6 (7.3%) | 0.32 | 4 (22.2%) | 0.42 |
| Dronedarone | 21 (10.9%) | 13 (13%) | 0.21 | 9 (10.9%) | 0.19 | 4 (22.2%) | 0.24 |
| Sotalol | 20 (10.4%) | 12 (12%) | 0.75 | 10 (12.2%) | 0.74 | 2 (11.1%) | 0.71 |
| Dofetilide | 6 (3.1%) | 3 (3%) | 0.34 | 2 (2.4%) | 0.44 | 1 (5.6%) | 0.60 |
| Flecainide | 35 (18.2%) | 19 (19%) | 0.95 | 15 (18.3%) | 0.79 | 4 (22.2%) | 0.47 |
| Propafenone | 6 (3.1%) | 1 (1%) | 0.09 | 1 (1.2%) | 0.11 | 0 (0%) | 0.59 |
| Characteristics | All patients (n = 192) |
|---|---|
| Data for ejection fraction are expressed as median (range). Data for categorical variables are expressed as mean ± standard deviation or proportion (percentages). PVI: pulmonary vein isolation. | |
| Ejection fraction (%) | 55 (25 - 75) |
| Left atrial dilation | |
| Mild | 43 (22.4%) |
| Moderate | 19 (9.8%) |
| Severe | 0 (0%) |
| Right atrial dilation | |
| Mild | 17 (8.9%) |
| Moderate | 4 (2.1%) |
| Severe | 0 (0%) |
| Mitral regurgitation | |
| Mild | 150 (78.1%) |
| Moderate | 20 (10.4%) |
| Severe | 0 (0%) |
| Tricuspid regurgitation | |
| Mild | 125 (65.1%) |
| Moderate | 3 (1.6%) |
| Severe | 1 (0.52%) |
| Variable | Any inducible atrial flutter | P value | Typical right atrial flutter | P value | Atypical atrial flutter | P value |
|---|---|---|---|---|---|---|
| Data are expressed as mean ± standard deviation or proportion (percentages). *P < 0.05 indicates the difference between the two groups is statistically significant. AF: atrial fibrillation; COPD: chronic obstructive pulmonary disease; OSA: obstructive sleep apnea. | ||||||
| Female | 39 (56%) | 0.45 | 26 (46%) | 0.78 | 13 (30%) | 0.002* |
| Persistent AF | 60 (59%) | 0.047* | 50 (54%) | 0.043* | 10 (19%) | 0.44 |
| OSA | 55 (60%) | 0.04* | 46 (55%) | 0.04* | 9 (20%) | 0.44 |
| COPD | 6 (50%) | 0.88 | 5 (46%) | 0.91 | 1 (14%) | 0.88 |
| Asthma | 5 (50%) | 0.89 | 4 (44%) | 0.87 | 1 (17%) | 1.0 |
| Hypertension | 84 (55%) | 0.12 | 69 (50%) | 0.14 | 15 (18%) | 0.45 |
| Hyperlipidemia | 71 (54%) | 0.48 | 60 (50%) | 0.33 | 11 (15%) | 0.67 |
| Diabetes mellitus | 29 (58%) | 0.33 | 24 (53%) | 0.33 | 5 (19%) | 0.65 |
| Coronary artery disease | 26 (45%) | 0.19 | 21 (40%) | 0.19 | 5 (14%) | 0.57 |
| Failed previous antiarrhythmic | 46 (55%) | 0.56 | 36 (49%) | 0.78 | 10 (21%) | 0.28 |
| Outcome | Variable | Outcome - yes | Outcome - no | P value |
|---|---|---|---|---|
| Data are expressed as median (interquartile range). *P < 0.05 indicates the difference between the two groups is statistically significant. BMI: body mass index; EF: ejection fraction; MR: mitral regurgitation; TR: tricuspid regurgitation. | ||||
| Any inducible atrial flutter | ||||
| Age | 66.0 (61.5 - 72.5) | 65.0 (58.5 - 71.0) | 0.28 | |
| BMI | 33.3 (29.6 - 38.1) | 31.4 (28.2 - 34.5) | 0.02* | |
| EF | 55.0 (50.0 - 55.0) | 55.0 (50.0 - 55.0) | 0.97 | |
| Left atrial size | 0.0 (0.0 - 1.0) | 0.0 (0.0 - 0.5) | 0.03* | |
| Right atrial size | 0.0 (0.0 - 0.0) | 0.0 (0.0 - 0.0) | 0.33 | |
| TR severity | 1.0 (0.0 - 1.0) | 1.0 (0.0 - 1.0) | 0.47 | |
| MR severity | 1.0 (1.0 - 1.0) | 1.0 (1.0 - 1.0) | 0.54 | |
| Typical right atrial flutter | ||||
| Age | 66.0 (62.0 - 70.0) | 65.0 (58.5 - 71.0) | 0.48 | |
| BMI | 33.3 (29.8 - 38.1) | 31.4 (28.2 - 34.5) | 0.02* | |
| EF | 55.0 (50.0 - 55.0) | 55.0 (50.0 - 55.0) | 0.54 | |
| Left atrial size | 0.0 (0.0 - 1.0) | 0.0 (0.0 - 0.5) | 0.02* | |
| Right atrial size | 0.0 (0.0 - 0.0) | 0.0 (0.0 - 0.0) | 0.22 | |
| TR severity | 1.0 (0.0 - 1.0) | 1.0 (0.0 - 1.0) | 0.42 | |
| MR severity | 1.0 (1.0 - 1.0) | 1.0 (1.0 - 1.0) | 0.63 | |
| Atypical atrial flutter | ||||
| Age | 70.0 (61.0 - 73.0) | 65.0 (58.5 - 71.0) | 0.14 | |
| BMI | 32.9 (28.0 - 36.6) | 31.4 (28.2 - 34.5) | 0.30 | |
| EF | 55.0 (50.0 - 55.0) | 55.0 (50.0 - 55.0) | 0.05 | |
| Left atrial size | 0.0 (0.0 - 1.0) | 0.0 (0.0 - 0.5) | 0.42 | |
| Right atrial size | 0.0 (0.0 - 0.0) | 0.0 (0.0 - 0.0) | 0.70 | |
| TR severity | 1.0 (0.0 - 1.0) | 1.0 (0.0 - 1.0) | 0.95 | |
| MR severity | 1.0 (1.0 - 1.0) | 1.0 (1.0 - 1.0) | 0.53 | |
| Parameter | AOR (95% CI) | P value |
|---|---|---|
| Values are expressed as AOR (95% CI). *P < 0.05, statistically significant finding. AOR: adjusted odds ratio; CI: confidence interval; BMI: body mass index; MR: mitral regurgitation; OSA: obstructive sleep apnea; TR: tricuspid regurgitation. | ||
| Constant | 0.75 (-) | 0.59 |
| Gender (female) | 0.63 (0.33 - 1.21) | 0.17 |
| Type of atrial fibrillation (persistent) | 1.62 (0.88 - 2.96) | 0.12 |
| BMI | 1.22 (0.63 - 2.36) | 0.55 |
| OSA | 1.92 (1.03 - 3.69) | 0.049* |
| Failed at least one antiarrhythmic | 0.97 (0.53 - 1.79) | 0.92 |
| Left atrial size | 1.68 (0.96 - 2.95) | 0.07 |
| Right atrial size | 1.14 (0.45 - 2.90) | 0.78 |
| TR severity | 1.22 (0.66 - 2.26) | 0.53 |
| MR severity | 0.68 (0.35 - 1.34) | 0.26 |
| Group | Atrial fibrillation | P value | Atrial flutter | P value | Either | P value |
|---|---|---|---|---|---|---|
| Data are expressed as mean ± standard deviation or proportion (percentages). *P < 0.05 indicates the difference between the two groups is statistically significant. | ||||||
| Inducible (n = 100) | 30 (30%) | 0.7 | 14 (14%) | 0.09 | 40 (40%) | 0.46 |
| Inducible + ablated (n = 89) | 27 (30%) | 0.8 | 12 (13%) | 0.20 | 36 (40%) | 0.43 |
| Inducible + not ablated (n = 11) | 3 (27%) | 1 | 2 (18%) | 0.32 | 4 (36%) | 1 |