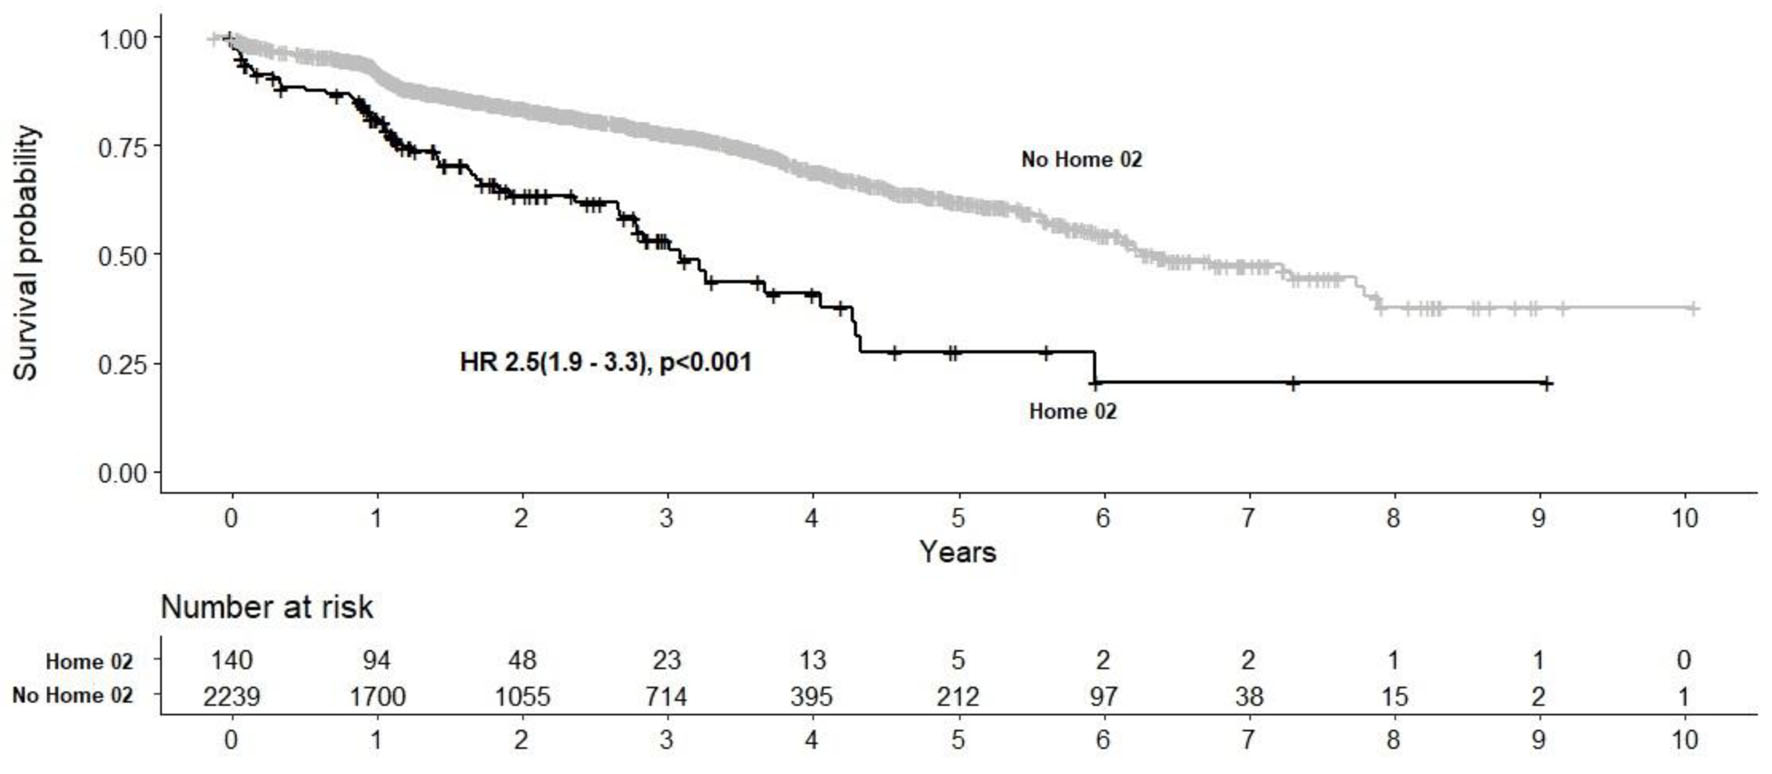
Figure 1. Kaplan-Meier survival analysis post-TAVR in home O2 and non-home O2 cohorts. TAVR: transcatheter aortic valve replacement.
| Cardiology Research, ISSN 1923-2829 print, 1923-2837 online, Open Access |
| Article copyright, the authors; Journal compilation copyright, Cardiol Res and Elmer Press Inc |
| Journal website https://www.cardiologyres.org |
Original Article
Volume 14, Number 3, June 2023, pages 228-236
In-Hospital and One-Year Outcomes of Transcatheter Aortic Valve Replacement in Patients Requiring Supplemental Home Oxygen Use
Figure
Tables
| Variable | Home O2 (n = 150) | Non-home O2 (n = 2,313) | P-value |
|---|---|---|---|
| Results are reported as mean ± SD or n (%). BMI: body mass index; BSA: body surface area; CABG: coronary artery bypass grafting; KCCQ-12: Kansas City Cardiomyopathy Questionnaire 12; MI: myocardial infarction; PCI: percutaneous coronary intervention; PROM: predicted risk of mortality; SAVR: surgical aortic valve replacement; SD: standard deviation; STS: Society of Thoracic Surgeons; TIA: transient ischemic attack. | |||
| Demographics | |||
| Age (years) | 78.9 ± 9.2 | 81.5 ± 8.3 | < 0.001 |
| Female | 79 (52.7) | 1,051 (45.4) | 0.085 |
| BSA (m2) | 1.95 ± 0.32 | 1.89 ± 0.27 | 0.012 |
| BMI (kg/m2) | 29.4 ± 16.1 | 28.9 ± 16.5 | 0.406 |
| Race (White) | 147 (98.0) | 2,227 (96.3) | 0.144 |
| Cardiovascular risk factors | |||
| Hypertension | 132 (88.0) | 2,083 (90.1) | 0.417 |
| Diabetes mellitus | 64 (42.7) | 772 (33.4) | 0.020 |
| Smoker (current or within 1 year) | 27 (18.0) | 323 (14.0) | 0.170 |
| Prior cardiac history | |||
| Previous MI | 40 (26.7) | 541 (23.4) | 0.360 |
| Previous PCI | 39 (26.0) | 645 (27.9) | 0.617 |
| Previous CABG | 16 (10.7) | 431 (18.6) | 0.014 |
| Previous SAVR | 11 (7.3) | 72 (3.1) | 0.666 |
| Previous surgical mitral valve repair/replacement | 0 (0.0) | 21 (0.9) | 0.241 |
| Previous carotid artery stenting/endarterectomy | 19 (12.7) | 269 (11.6) | 0.301 |
| Comorbidities | |||
| Atrial fibrillation/flutter | |||
| Paroxysmal | 24 (16.0) | 451 (19.5) | 0.428 |
| Persistent | 26 (17.3) | 439 (19.0) | 0.428 |
| Previous stroke | 10 (6.6) | 246 (10.6) | 0.123 |
| Previous TIA | 7 (4.7) | 148 (6.4) | 0.397 |
| Chronic obstructive lung disease | 134 (89.3) | 956 (41.3) | < 0.001 |
| Peripheral arterial disease | 43 (28.7) | 514 (22.2) | 0.067 |
| Carotid artery disease | 54 (36.0) | 622 (26.9) | 0.034 |
| End stage renal disease | 3 (2.0) | 63 (2.7) | 0.595 |
| Porcelain aorta | 4 (2.7) | 49 (2.1) | 0.654 |
| STS PROM | |||
| STS risk score (%) | 15.5 ± 10.2 | 9.3 ± 7.0 | < 0.001 |
| Quality of life | |||
| KCCQ-12 score | 32.5 ± 22.2 | 49.1 ± 25.4 | < 0.001 |
| Variable | Home O2 (n = 150) | Non-home O2 (n = 2,313) | P-value |
|---|---|---|---|
| Results are reported as mean ± SD or n (%). AV: aortic valve; CTA: computed tomography angiogram; DLCO: diffusion capacity; FEV1: forced expiratory volume; SD: standard deviation; TAVR: transcatheter aortic valve replacement. | |||
| Baseline echocardiographic data | |||
| Left ventricular ejection fraction (%) | 55.6 ± 14.6 | 55.7 ± 13.8 | 0.942 |
| AV mean gradient (mm Hg) | 41.5 ± 14.4 | 41.8 ± 14.2 | 0.846 |
| AV peak velocity (m/s) | 4.1 ± 0.7 | 4.1 ± 0.7 | 0.569 |
| AV area (cm2) | 0.8 ± 0.2 | 0.7 ± 0.2 | 0.080 |
| Aortic regurgitation | 0.185 | ||
| None | 31 (20.6) | 546 (23.6) | |
| Trace/trivial | 27 (18.0) | 437 (18.9) | |
| Mild | 73 (48.6) | 950 (41.1) | |
| Moderate | 13 (8.7) | 296 (12.8) | |
| Severe | 1 (0.7) | 53 (2.3) | |
| Baseline cardiac catheterization data | |||
| Number of narrowed coronary arteries | 0.117 | ||
| None | 32 (21.3) | 467 (20.2) | |
| 1 | 20 (13.3) | 372 (16.1) | |
| 2 | 17 (11.3) | 401 (17.3) | |
| 3 | 64 (42.7) | 801 (34.6) | |
| CTA data | |||
| AV annulus size (mm) | 23.7 ± 3.2 | 23.3 ± 3.1 | 0.160 |
| Pulmonary function testing | |||
| FEV1 | 50.3 ± 21.1 | 75.0 ± 24.7 | < 0.001 |
| DLCO | 48.6 ± 19.2 | 74.6 ± 22.4 | < 0.001 |
| Variable | Home O2 (n = 150) | Non-home O2 (n = 2,313) | P-value |
|---|---|---|---|
| Results are reported as mean ± SD or n (%). SD: standard deviation. | |||
| Use of anesthesia | < 0.001 | ||
| General anesthesia | 83 (55.3) | 1,017 (44.0) | |
| Conscious sedation | 67 (44.7) | 1,298 (56.1) | |
| Valve type | 0.119 | ||
| Sapien | 7 (4.7) | 107 (4.6) | |
| Sapien XT | 8 (5.3) | 74 (3.2) | |
| Sapien 3 (Ultra) | 84 (56.0) | 1,257 (54.3) | |
| CoreValve | 9 (6.0) | 91 (3.9) | |
| Evolut R | 23 (15.3) | 281 (12.1) | |
| Evolut PRO | 7 (4.7) | 196 (8.5) | |
| Evolut PRO Plus | 12 (8.0) | 307 (13.3) | |
| Access site | 0.001 | ||
| Femoral | 116 (77.3) | 2,043 (88.3) | |
| Transcarotid | 21 (14.0) | 115 (5.0) | |
| Subclavian | 7 (4.7) | 70 (3.0) | |
| Direct aortic | 4 (2.7) | 34 (1.5) | |
| Transapical | 1 (0.7) | 36 (1.6) | |
| Other | 1 (0.7) | 15 (0.6) | |
| Contrast volume (mL) | 92.4 ± 49.3 | 91.7 ± 58.1 | 0.879 |
| Fluoroscopy time (min) | 21.9 ±10.2 | 21.2 ± 14.2 | 0.543 |
| Outcome | Home O2 (n = 150) | Non-home O2 (n = 2,313) | P-value |
|---|---|---|---|
| Results are reported as mean ± SD or n (%). SD: standard deviation. | |||
| Length of stay | |||
| Total (days) | 7.9 ± 8.1 | 5.2 ± 6.3 | < 0.001 |
| Post-procedure (days) | 5.1 ± 5.7 | 3.3 ± 4.00 | < 0.001 |
| Surgical complications | |||
| All-cause mortality | 8 (5.3) | 36 (1.6) | 0.001 |
| Conversion to open heart surgery | 2 (1.3) | 4 (0.9) | 0.554 |
| Procedural cardiac arrest | 7 (4.7) | 23 (1.0) | < 0.001 |
| Transient ischemic attack | 0 (0.0) | 14 (0.6) | 0.330 |
| Ischemic stroke | 5 (3.3) | 50 (2.2) | 0.388 |
| New-onset atrial fibrillation | 6 (4.0) | 34 (1.5) | 0.013 |
| Major vascular complication | 4 (2.7) | 42 (1.8) | 0.411 |
| Minor vascular complication | 9 (6.0) | 88 (3.8) | 0.146 |
| Composite bleeding | 9 (6.0) | 78 (3.4) | 0.091 |
| New requirement for dialysis | 1 (0.7) | 5 (0.2) | 0.295 |
| Permanent pacemaker | 20 (13.3) | 293 (12.7) | 0.678 |
| Outcome | Home O2 (n = 150) | Non-home O2 (n = 2,313) | P-value |
|---|---|---|---|
| Results are reported as mean ± SD or n (%). KCCQ-12: Kansas City Cardiomyopathy Questionnaire; SD: standard deviation. | |||
| All-cause mortality | 26 (17.3) | 173 (7.5) | < 0.001 |
| Hospital readmission | 12 (7.8) | 134 (5.8) | 0.320 |
| KCCQ-12 score | 69.5 ± 23.8 | 82.1 ± 19.4 | < 0.001 |