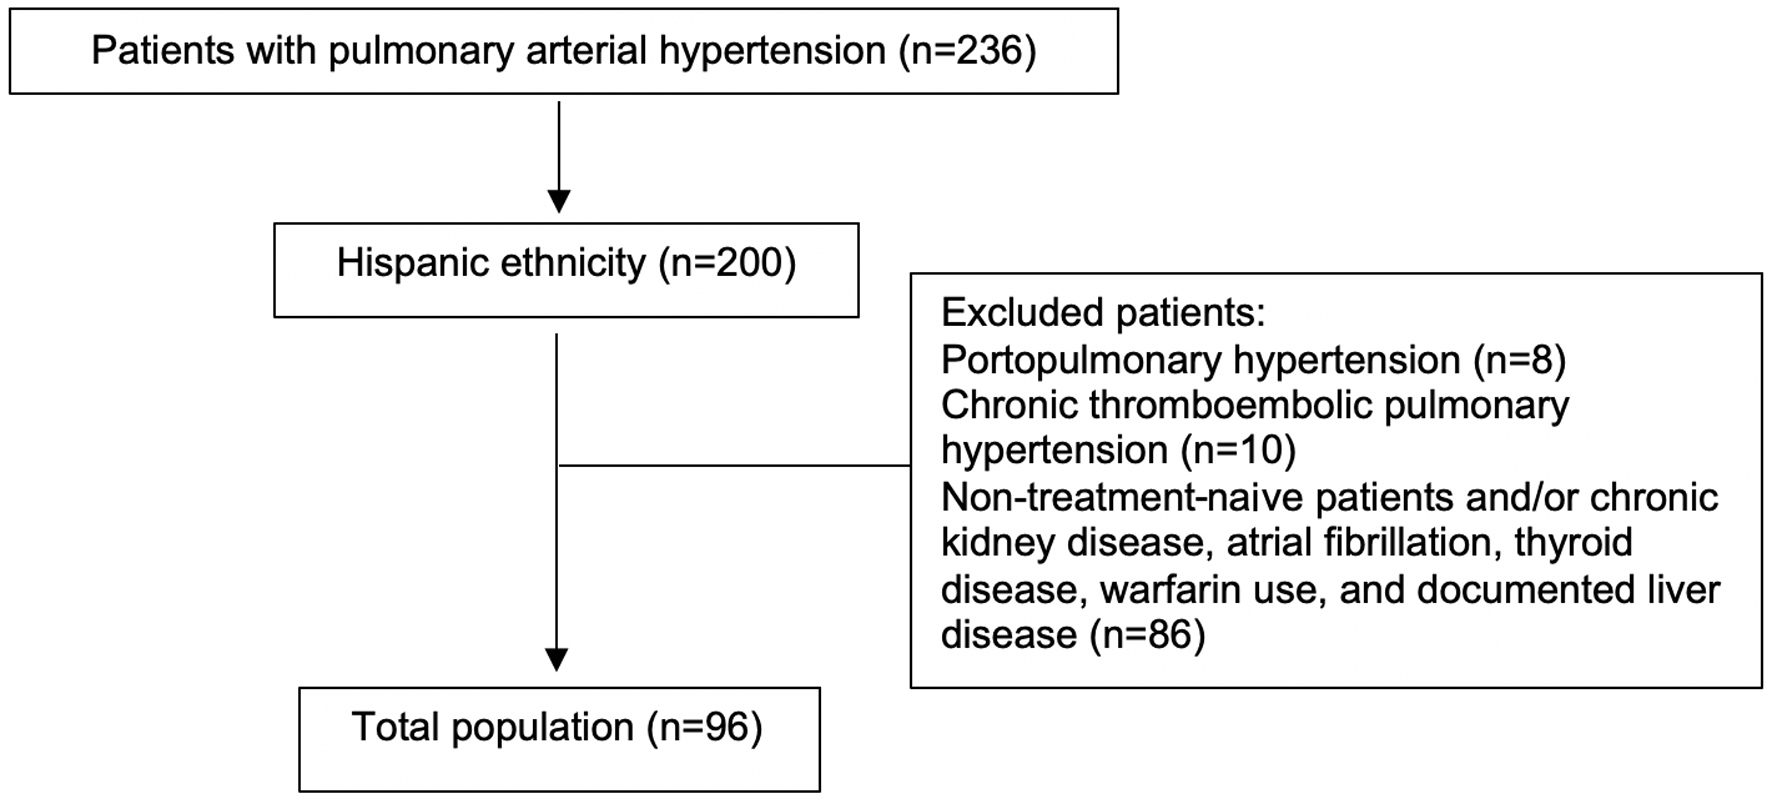
Figure 1. Flow diagram of patient selection.
| Cardiology Research, ISSN 1923-2829 print, 1923-2837 online, Open Access |
| Article copyright, the authors; Journal compilation copyright, Cardiol Res and Elmer Press Inc |
| Journal website https://www.cardiologyres.org |
Original Article
Volume 14, Number 6, December 2023, pages 429-436
The Association Between Non-Clinically Apparent Liver Fibrosis and Pulmonary Arterial Hypertension in Hispanic Patients
Figures
Tables
| All patients (n = 96) | Low NFS (F0-F2) (n = 36) | Indeterminate NFS (n = 33) | Advanced NFS (F3-F4) (n = 27) | P-value (low versus advanced NFS) | |
|---|---|---|---|---|---|
| Data are shown as median (interquartile range (IQR)) except for sex (%) and WHO-FC (mean (standard deviation (SD))). P values between low and advanced NFSs were calculated by Mann-Whitney U test for continuous variables, Chi-square for differences in gender and t-test for WHO-FC. Data are available for all patients, except data on CI are available for 80 patients in the entire cohort, 30 patients in the low NFS group and 19 patients in the advanced NFS group. Data on 6MWD are available for 84 patients in the entire cohort and 33 patients in the low NFS group. BMI: body mass index; CHD: congenital heart disease; CI: cardiac index; CTD: connective tissue disease; IPAH: idiopathic pulmonary arterial hypertension; mPAP: mean pulmonary artery pressure; mRAP: mean right atrial pressure; NFS: non-alcoholic fatty liver disease fibrosis score; NT-proBNP: N-terminal-pro-B-type natriuretic peptide; PCWP: pulmonary capillary wedge pressure; 6MWD: 6-minute walk distance; WHO-FC: World Health Organization functional class. | |||||
| Age (years) | 49 (15) | 48 (7) | 57.6 (23) | 59 (12) | 0.014 |
| Female (%) | 69 | 86 | 23 | 55 | < 0.05 |
| BMI (kg/m2) | 30.2 (12) | 27.1 (12) | 30.8 (11) | 32.1 (22) | 0.35 |
| WHO-FC (I-IV) | 2.3 (0.9) | 2.4 (0.6) | 2.6 (1) | 2.9 (0.7) | < 0.05 |
| WHO group | 0.781 | ||||
| IPAH | 47 | 18 | 19 | 10 | |
| CTD | 30 | 11 | 8 | 11 | |
| CHD | 19 | 7 | 6 | 6 | |
| mRAP (mm Hg) | 8 (14) | 8 (4) | 9.6 (5) | 11.5 (16) | < 0.05 |
| mPAP (mm Hg) | 42 (12) | 38 (17.1) | 77 (14.5) | 43 (23.2) | 0.19 |
| PCWP (mm Hg) | 9 (5) | 10 (7) | 10.9 (4) | 11 (5) | 0.60 |
| CI (L/min/m2) | 2.4 (0.8) | 2.9 (0.9) | 3.1 (1.7) | 2.7 (1.2) | 0.41 |
| 6MWD (m) | 358 (178) | 399 (178) | 368 (236) | 288 (184) | < 0.05 |
| NT-proBNP (ng/L) | 1,853 (1,856) | 1,050 (1,178) | 1,845 (2,643) | 2,323 (2,773) | < 0.05 |
| NFS | -0.55 (2.5) | -2.6 (1.1) | -0.4 (1.46) | 1.4 (2.5) | < 0.05 |
| Diabetes (%) | 27.1 | 13.9 | 21.1 | 51.9 | 0.001 |
| Systemic hypertension (%) | 17.7 | 16.7 | 12.1 | 25.6 | 0.214 |
| Hyperlipidemia (%) | 11.5 | 8.3 | 9.1 | 18.5 | 0.206 |
| Obesity (%) | 37.5 | 25.0 | 45.5 | 44.4 | 0.397 |
| One or more risk factors for metabolic syndrome (%) | 67.7 | 56.0 | 69.7 | 81.5 | 0.035 |
| Variables | NFS (F0-F4) | P-value |
|---|---|---|
| Correlations between continuous variables were assessed using the Pearson correlation coefficient. Spearman rank correlation was used to assess the correlation for nominal and categorical variables. BMI: body mass index; CI: cardiac index; mPAP: mean pulmonary artery pressure; mRAP: mean right atrial pressure; NFS: non-alcoholic fatty liver disease fibrosis score; NT-proBNP: N-terminal-pro-B-type natriuretic peptide; PCWP: pulmonary capillary wedge pressure; 6MWD: 6-minute walk distance; WHO-FC: World Health Organization functional class. | ||
| Age (years) | 0.342 | 0.041 |
| Gender | 0.355 | 0.009 |
| BMI (kg/m2) | 0.131 | 0.350 |
| WHO-FC (I-IV) | 0.35 | 0.005 |
| mRAP (mm Hg) | 0.273 | 0.031 |
| mPAP (mm Hg) | 0.21 | 0.27 |
| PCWP (mm Hg) | -0.073 | 0.69 |
| CI (L/min/m2) | -0.117 | 0.423 |
| 6MWD (m) | -0.485 | 0.001 |
| NT-proBNP (ng/L) | 0.321 | 0.010 |
| Univariate model | Multivariate model | |||
|---|---|---|---|---|
| HR (95% CI) | P-value | HR (95% CI) | P-value | |
| aAdjusted for gender. bAdjusted for age and gender. Cox regression analysis was used to identify predictors of death during follow-up. CI: confidence interval; HR: hazard ratio; NFS: non-alcoholic fatty liver disease fibrosis score; 6MWD: 6-minute walk distance; NT-proBNP: N-terminal-pro-B-type natriuretic peptide; WHO-FC: World Health Organization functional class. | ||||
| NFSa | 2.4 (1.7 - 3.9) | 0.001 | 2.0 (1.2 - 3.4) | 0.031 |
| NT-proBNPb | 1.1 (1.0 - 1.3) | 0.003 | 1.0 (0.8 - 1.1) | 0.312 |
| 6MWDb | 1.1 (1.0 - 1.1) | 0.023 | 0.97 (0.8 - 1.1) | 0.495 |
| WHO-FCb | 2.8 (1.5 - 4.2) | 0.001 | 1.6 (1.3 - 3.0) | 0.031 |