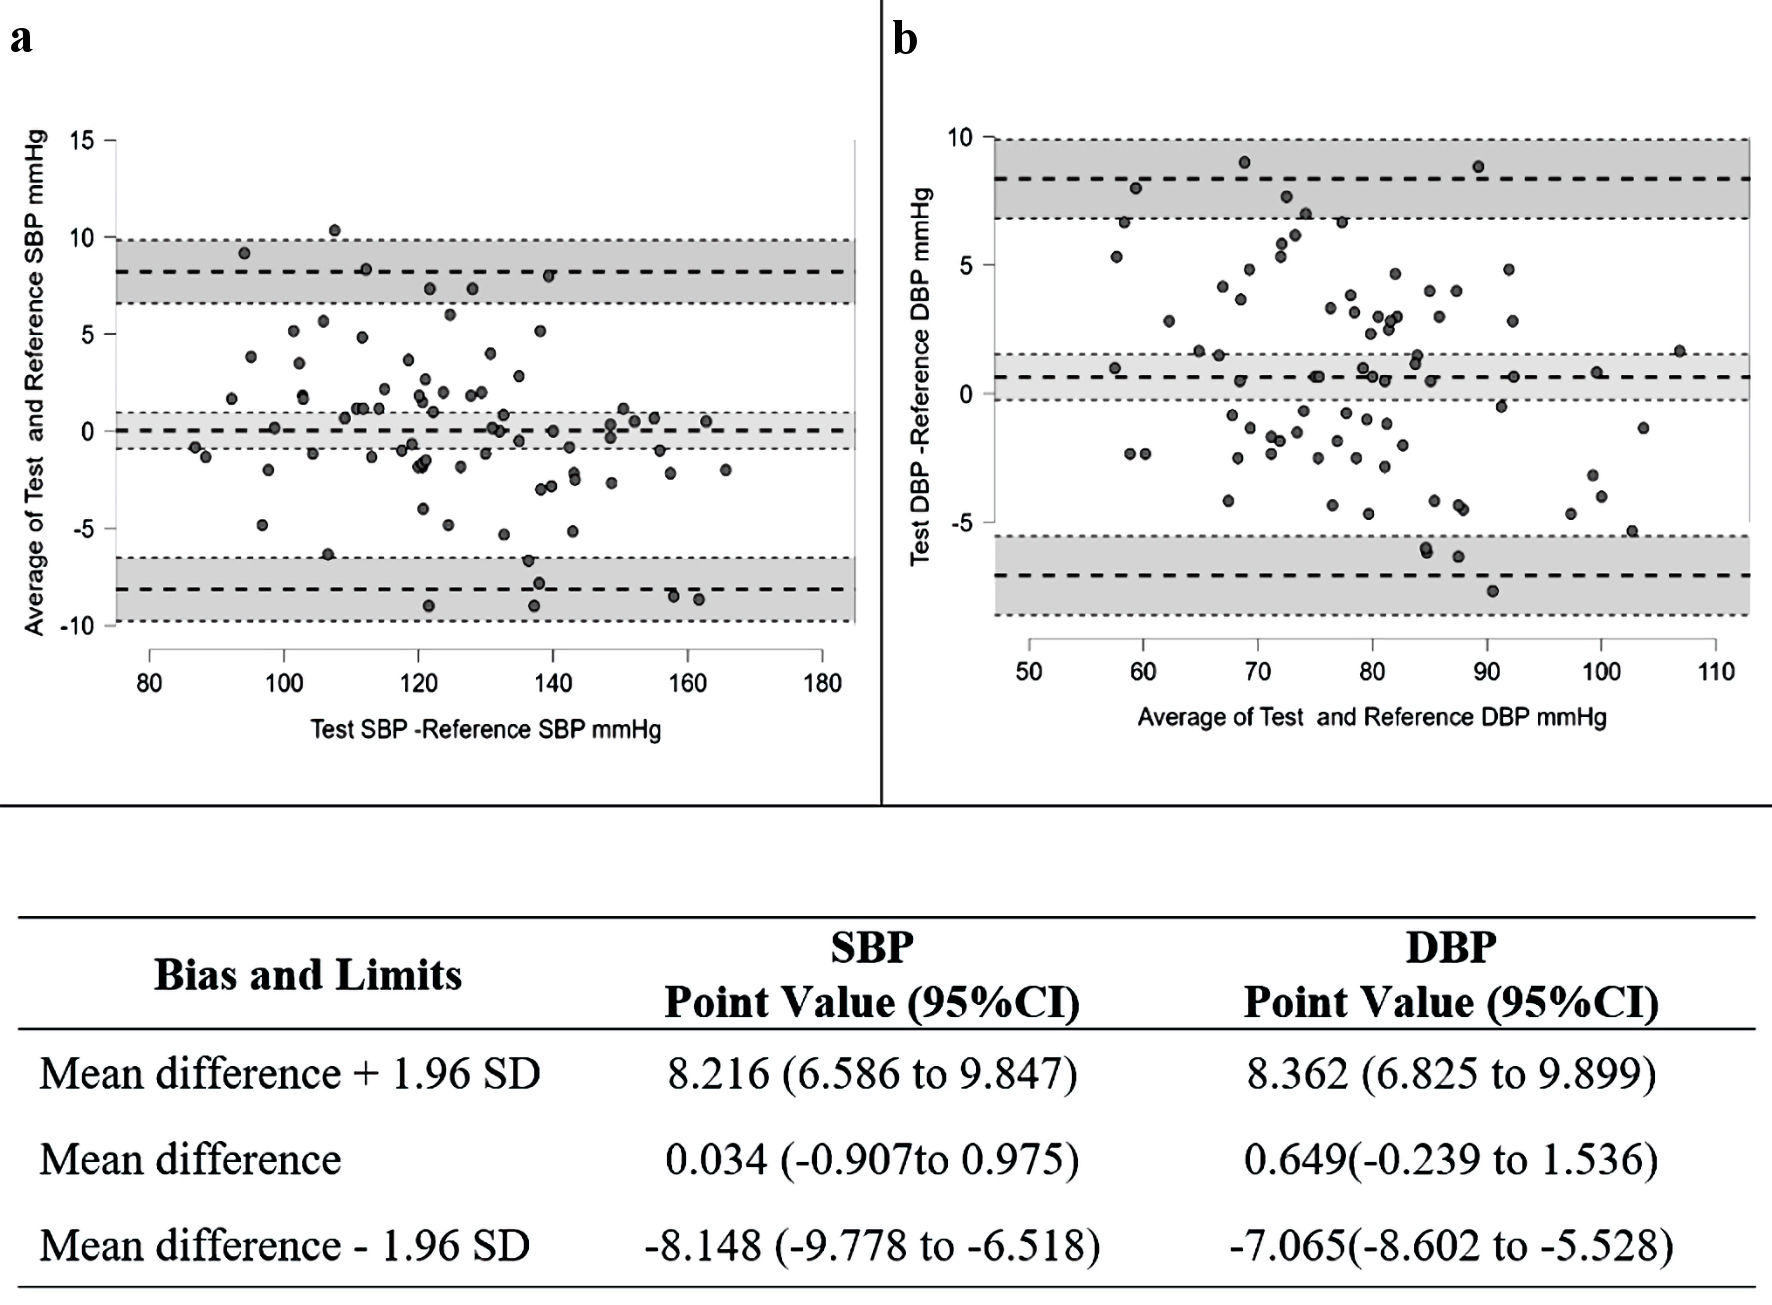
Figure 1. Bland-Altman scatter plots and results of the mean differences between watch device and the reference BPs for the systolic blood pressure (SBP) (a) and diastolic blood pressure (DBP) (b). SD: standard deviation; CI: confidence interval.
| Cardiology Research, ISSN 1923-2829 print, 1923-2837 online, Open Access |
| Article copyright, the authors; Journal compilation copyright, Cardiol Res and Elmer Press Inc |
| Journal website https://www.cardiologyres.org |
Original Article
Volume 14, Number 6, December 2023, pages 437-445
Is the Blood Pressure-Enabled Smartwatch Ready to Drive Precision Medicine? Supporting Findings From a Validation Study
Figures
Tables
| Characteristics | Frequency |
|---|---|
| N (%) | |
| aOther ethnicity (n = 3; 3.8%). bMultiple-response items. SD: standard deviation; SBP: systolic blood pressure; DBP: diastolic blood pressure; MYR: Malaysian Ringgit. | |
| Sex | |
| Male | 41 (52.6%) |
| Female | 37 (47.4%) |
| Major ethnicitya | |
| Malay | 36 (46.2%) |
| Indian | 19 (24.4%) |
| Chinese | 20 (25.6%) |
| Educational level | |
| Up to secondary education | 40 (51.3%) |
| Higher than secondary education | 38 (48.7%) |
| Employment status | |
| Employed | 34 (43.6%) |
| Retired | 25 (32.1%) |
| Not on employment | 19 (24.3%) |
| Monthly household income | |
| < MYR1,000 | 6 (7.7%) |
| MYR1,001 - 4,000 | 29 (37.2%) |
| MYR4,001 - 8,000 | 26 (33.3%) |
| > MYR8,001 | 17 (21.8%) |
| Distribution of SBPs | |
| ≤ 100 mm Hg | 9 (11.5%) |
| 100 - 140 mm Hg | 49 (62.8%) |
| 140 - 160 mm Hg | 16 (20.5%) |
| ≥ 160 mm Hg | 4 (5.1%) |
| Distribution of DBPs | |
| ≤ 60 mm Hg | 5 (6.4%) |
| 60 - 85 mm Hg | 54 (69.2%) |
| 85 - 100 mm Hg | 14 (17.9%) |
| ≥ 100 mm Hg | 5 (6.4%) |
| Comorbiditiesb | |
| Hypertension | 37 (47.4%) |
| Ischemia heart disease | 20 (25.6%) |
| Stroke | 1 (1.3%) |
| Diabetes mellitus | 22 (28.2%) |
| Others | 33 (42.3%) |
| Hair density | |
| Nil | 44 (56.4%) |
| Sparse | 20 (25.6%) |
| Moderate | 10 (12.8%) |
| Dense | 4 (5.2%) |
| Mean age (in years) | 50.06 (SD 15.19) |
| Mean wrist circumference (in cm) | 17.36 (SD 1.68) |
| Mean body mass index (BMI) | 26.11 (SD 5.78) |
| Pass requirement | Achieved BP | ||
|---|---|---|---|
| Systolic | Diastolic | ||
| SD: standard deviation; Sm: standard error of mean; SBP: systolic blood pressure; DBP: diastolic blood pressure; BP: blood pressure. | |||
| Criterion 1 | |||
| Mean BP difference (mm Hg) | ≤ 5.0 | -0.034 | -0.649 |
| SD (mm Hg) | ≤ 8.0 | 5.244 | 4.660 |
| Conclusion | Pass | Pass | |
| Criterion 2 | |||
| Sm (mm Hg) SBP/DBP | ≤ 6.95/≤ 6.91 | 4.175 | 3.935 |
| Conclusion | Pass | Pass | |
| Ethnicity | Bias and limits | SBP | P value | DBP | P value |
|---|---|---|---|---|---|
| Point value (95% CI) | Point value (95% CI) | ||||
| The comparison among three ethnic groups was done using one-way ANOVA for both systolic and diastolic measurement accuracy. ANOVA: analysis of variance; SBP: systolic blood pressure; DBP: diastolic blood pressure; BP: blood pressure; CI: confidence interval. | |||||
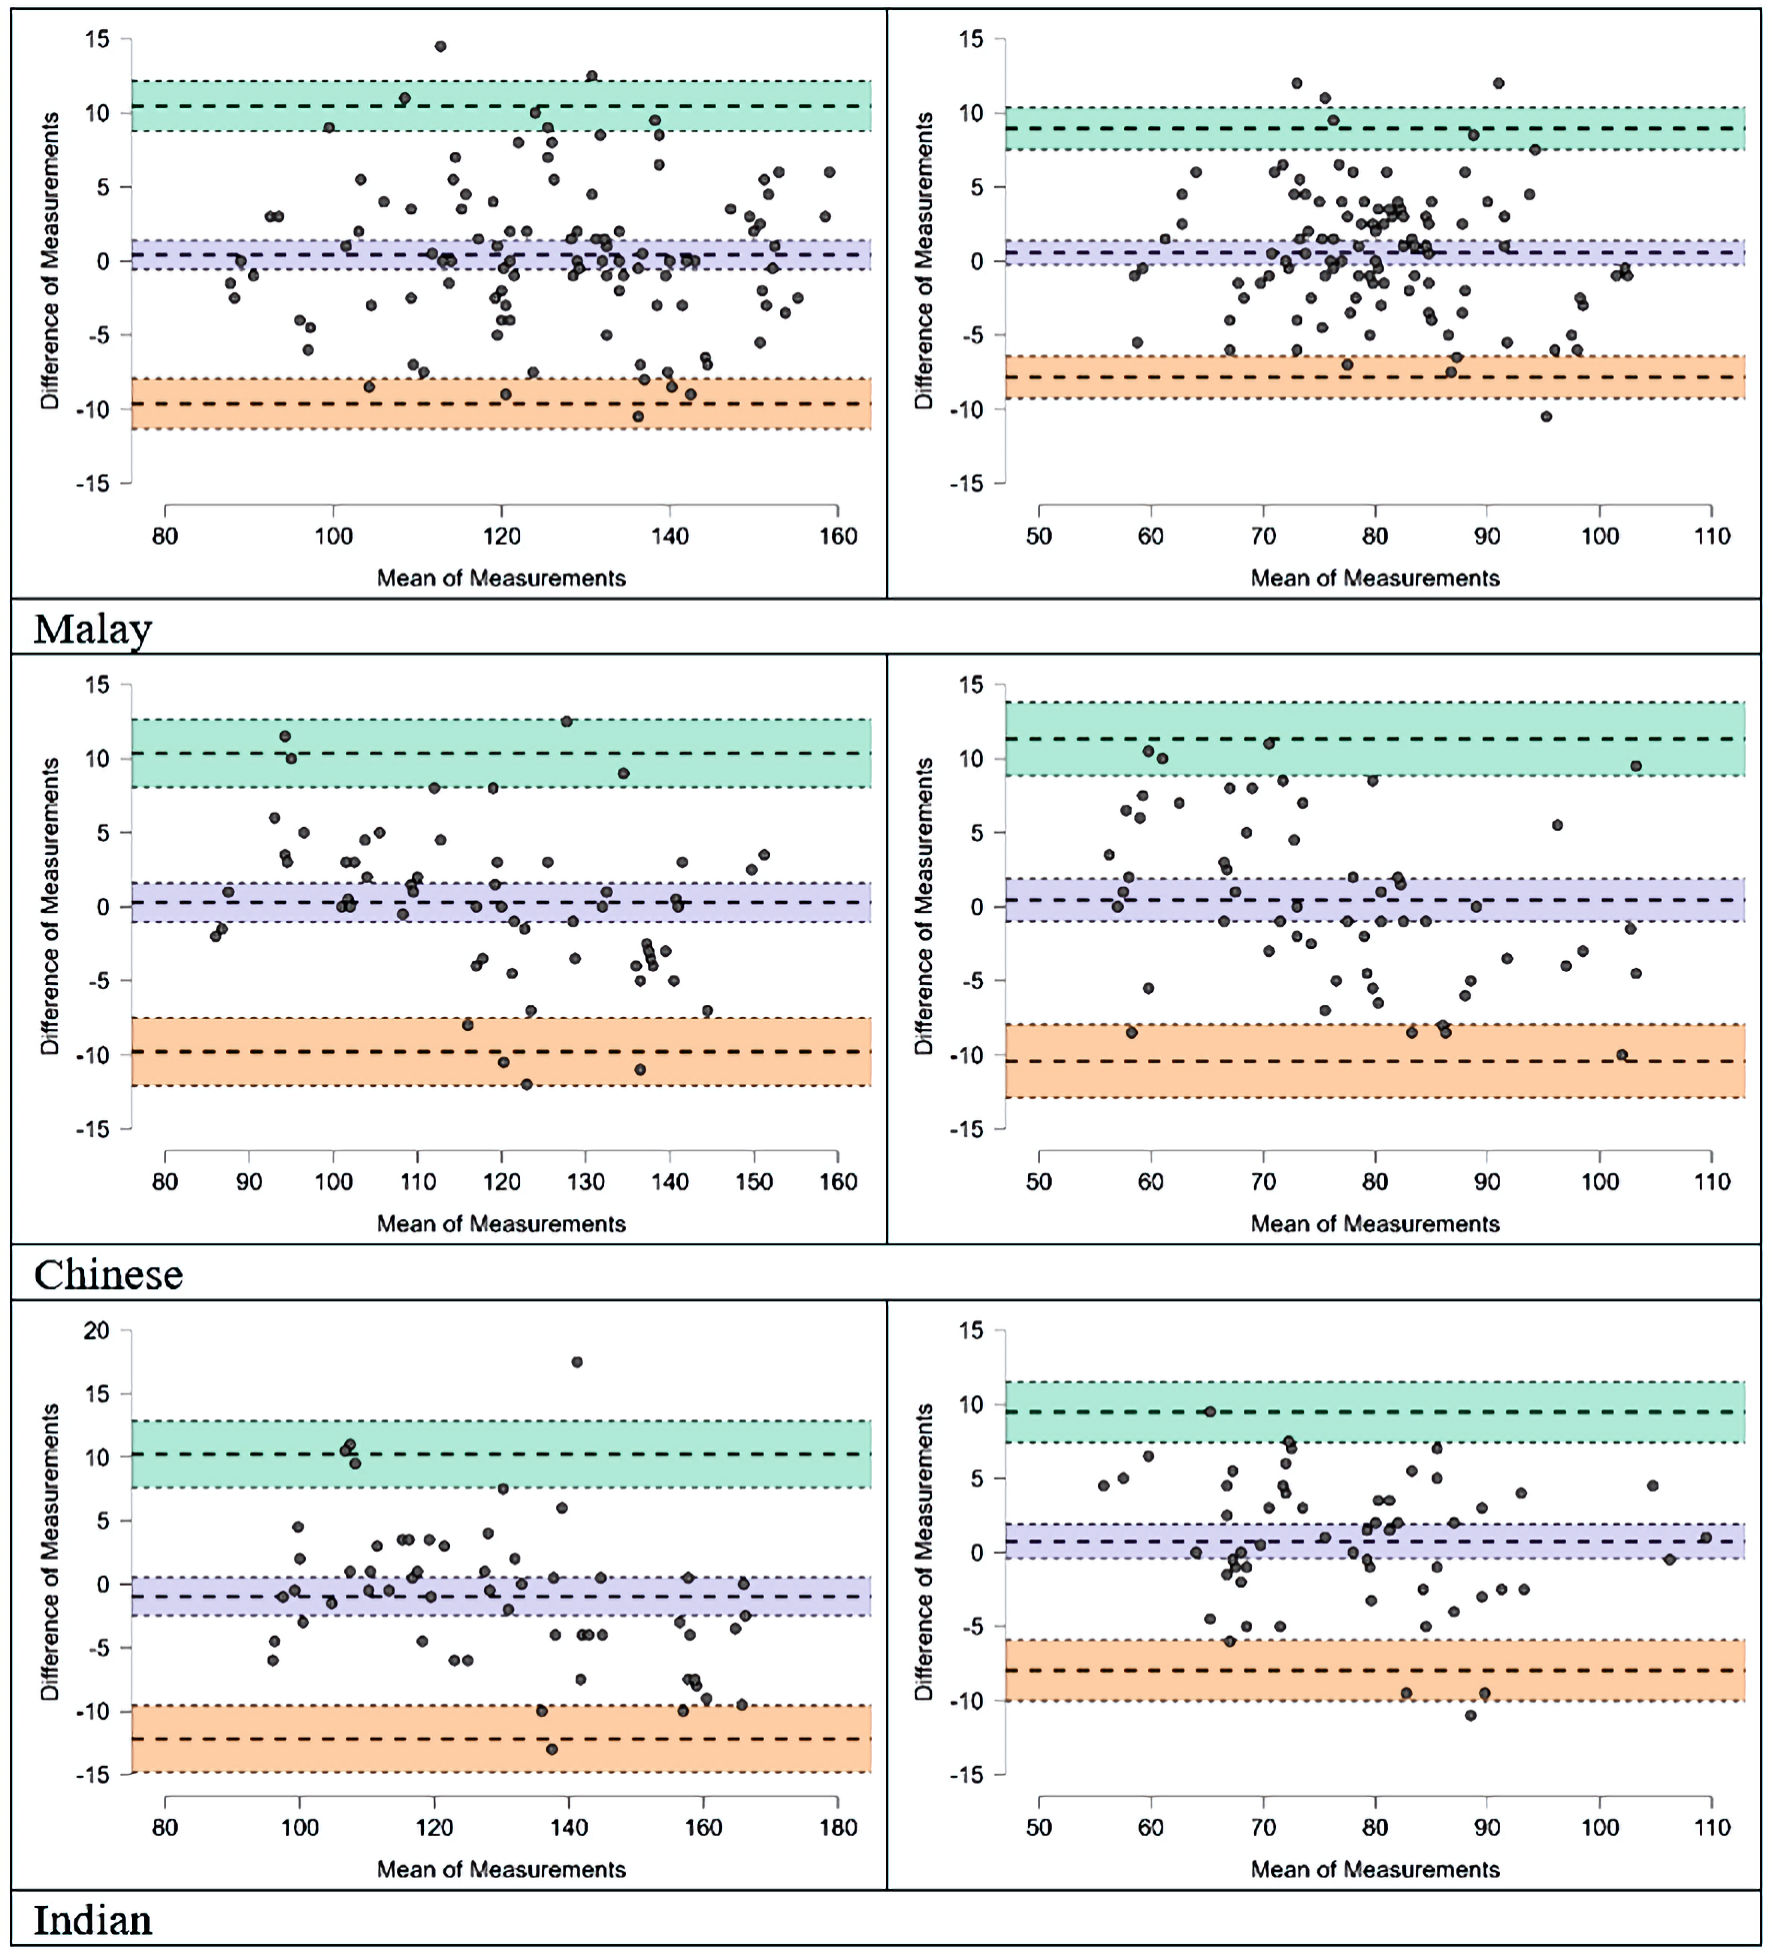
| Malay | Mean difference + 1.96 SD | 10.468 (8.773 - 12.162) | 8.941 (7.528 - 10.355) | ||
| Mean difference | 0.417 (-0.562 - 1.395) | 0.556 (-0.261 - 1.372) | |||
| Mean difference - 1.96 SD | -9.634 (-11.329 to -7.94) | -7.83 (-9.244 to -6.417) | |||
| Chinese | Mean difference + 1.96 SD | 10.349 (8.051 - 12.647) | 11.316 (8.835 - 13.797) | ||
| Mean difference | 0.283 (-1.043 - 1.61) | 0.45 (-0.982 - 1.882) | |||
| Mean difference - 1.96 SD | -9.783 (-12.081 to -7.485) | -10.416 (-12.897 to -7.935) | |||
| Indian | Mean difference + 1.96 SD | 10.241 (7.611 - 12.87) | 9.472 (7.427 - 11.517) | ||
| Mean difference | -0.974 (-2.492 - 0.544) | 0.75 (-0.431 - 1.931) | |||
| Mean difference - 1.96 SD | -12.188 (-14.817 to -9.558) | F = 1.385 | -7.972 (-10.017 to -5.927) | F = 0.620 | |
| P = 0.252 | P = 0.940 | ||||