Cardiology Research, ISSN 1923-2829 print, 1923-2837 online, Open Access
Article copyright, the authors; Journal compilation copyright, Cardiol Res and Elmer Press Inc
Journal website https://www.cardiologyres.org

Original Article

Volume 14, Number 6, December 2023, pages 446-452


The Heart of Rett Syndrome: A Quantitative Analysis of Cardiac Repolarization

Figures

Figure 1.
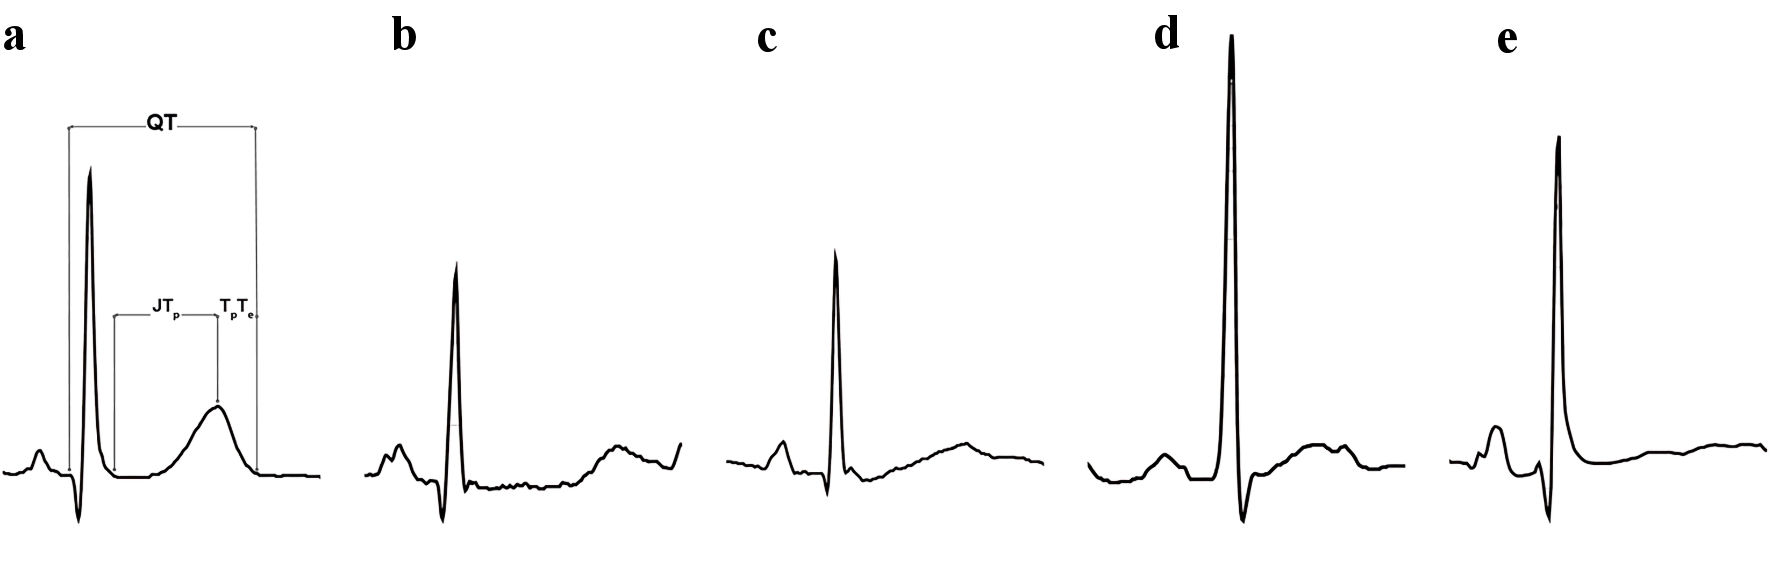
Figure 1. Depiction of the electrocardiographic measurements along with T-wave morphology characteristics seen in the study’s RTT patients. (a) Normal T wave. (b) Prolonged QT with prolonged JTp. (c) Asymmetric T wave. (d) Notched T wave. (e) Flat T wave. This ECG had the highest morphology combination score (MCS). ECG: electrocardiogram; RTT: Rett syndrome; JTp: time from the J point to the peak of the T wave.
Figure 2.
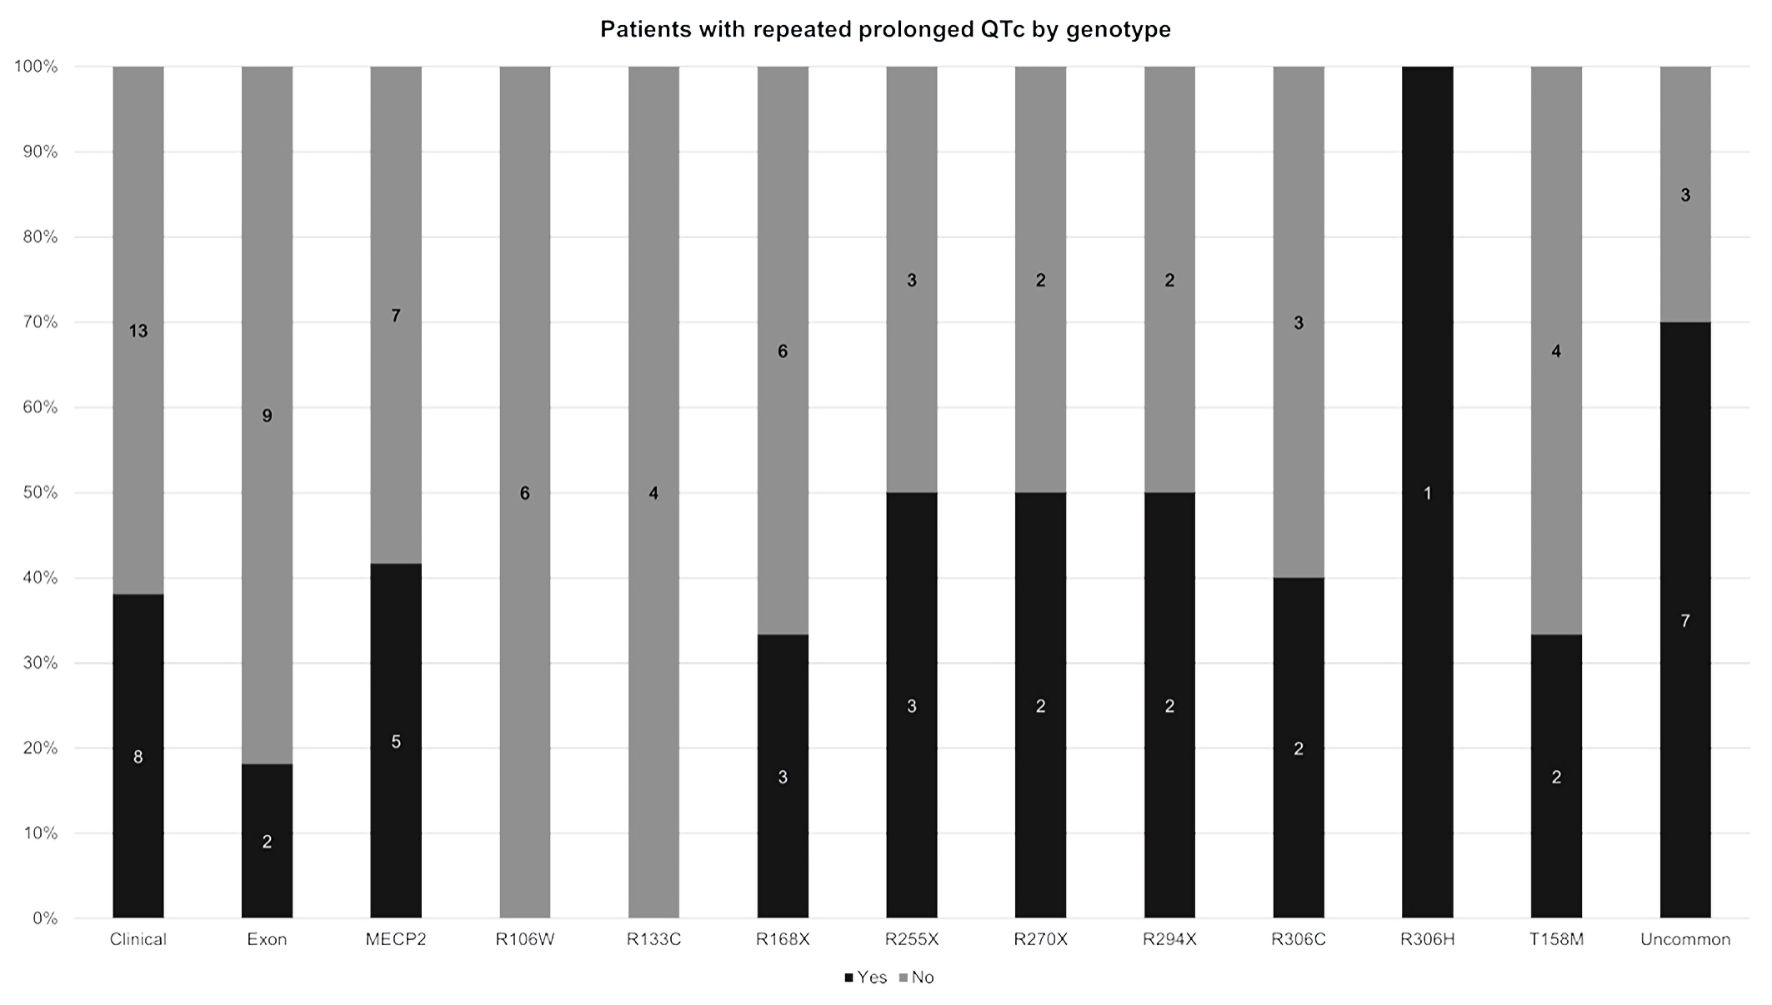
Figure 2. Distribution of patients with and without repeated prolonged QTc on ECG by RTT genotype. The black bar is the percentage of patients with repeated prolonged QTc on ECG. The gray bar is the percentage of patients without repeated prolonged QTc (i.e., patients with only one prolonged QTc on ECG or patients with no prolonged QTc on ECG). For each column, the percentage of patients with repeated prolonged QTc and the percentage of patients without repeated prolonged QTc add up to 100%. Clinical: clinical RTT as defined in the text; Uncommon: identified mutations besides R106W, R133c, R168X, R255X, R270X, R294x, R306C, R306H, T158M; QTc: corrected QT; ECG: electrocardiogram; RTT: Rett syndrome.

Tables

Table 1. Baseline and Electrocardiographic Characteristics
 
Control (n = 124)All RTT (n = 110)MECP2 (n = 78)CDKL5 (n = 8)FOXG1 (n = 3)Clinical RTT (n = 21)P control vs. all RTT
Values are counts (%) or means (SD). QTc: corrected QT; SD: standard deviation; RTT: Rett syndrome; bpm: beats per minute.
Long QT6 (4.8)55 (50)45 (57.6)1 (12.5)0 (0)9 (42.8)< 0.001
Mean age, years9.3 (5.2)11.7 (8.5)10.7 (7.6)5.9 (5.4)4.1 (2.5)18 (9.6)< 0.001
Heart rate, bpm87.1 (24.1)95 (21.8)94 (20.9)110.6 (14.4)123 (14.3)92.6 (24.9)< 0.001
QTc, ms422.8 (19.3)445.6 (31.6)448 .1 (32.8)430.2 (17.6)430.4 (12.8)440.8 (28.8)< 0.001


Table 2. Comparison of T wave Analysis Characteristics
 
Control (n = 124)All RTT (n = 110)MECP2 (n = 78)CDKL5 (n = 8)FOXG1 (n = 3)Clinical RTT (n = 21)P control vs. all RTT
Values are mean (SD). SD: standard deviation; RTT: Rett syndrome; MCS: morphology combination score; PCA-2: principal component analysis ratio; JTp: time from the J point to the peak of the T wave; TpTe: time from the peak of the T wave to the end of the T wave.
Corrected JTp, ms189.6 (30.6)193.3 (37.6)196.3 (36.7)156.7 (18.9)144.5 (13.4)195.1. (38.8)0.169
TpTe, ms91.3 (10.4)96.4 (19.9)96.6 (20.9)89.9 (12)94.8 (11.5)93.3 (17.5)0.343
MCS60.7 (24.6)97.8 (59)106.4 (61.8)55.1 (18.8)50.3 (30.7)78.1 (42)< 0.001
Flatness score27.3 (11.8)35.6 (13.4)37.3 (13.3)23.4 (6.7)19.9 (6.5)33.1 (13.1)0.005
Asymmetry score15.6. (10.8)25.9 (22.6)28.3 (22.9)16.9 (12.8)11.3(10.4)19.6 (22.2)< 0 .001
Notch score0 (0.4)2 (8.1)2.5 (9.3)0 (0)0.38 (1.1)0.2 (1)0.002
PCA-2, %19.2 (9.1)25.5 (13.2)25.2 (13)25.6 (10.3)31.2 (7.3)26.1 (15.2)< 0.001


Table 3. QTc and T-wave Parameters by RTT Mortality
 
RTT living (n = 105)RTT deceased (n = 5)P
Values are mean (SD). QTc: corrected QT; SD: standard deviation; RTT: Rett syndrome; MCS: morphology combination score; PCA-2: principal component analysis ratio; JTp: time from the J point to the peak of the T wave; TpTe: time from the peak of the T wave to the end of the T wave.
QTc, ms446.8. (29.9)432.9 (43.1)0.903
Corrected JTp, ms192 (36.7)206.3 (44)0.029
TpTe, ms96.7 (18.6)93.6 (29.4)0.391
MCS94.8 (56.2)127.3 (75.7)0.001
Flatness score35.2 (12.9)39.4 (17.3)0.038
Asymmetry score24.9 (21.3)35.6 (31.2)< 0.001
Notch score1.8 (8.11)3.3 (8.3)0.028
PCA-2, %25.3 (12.6)27 (18.3)0.043


Table 4. QTc and T-Wave Parameters Between Control With QTc < 460 ms and RTT With QTc < 460 ms
 
Control (n = 118)RTT (n = 55)P
Values are means (SD). QTc: corrected QT; SD: standard deviation; RTT: Rett syndrome; MCS: morphology combination score; PCA-2: principal component analysis ratio; JTp: time from the J point to the peak of the T wave; TpTe: time from the peak of the T wave to the end of the T wave.
QTc, ms420.55 (16.82)431.31 (19.82)< 0.001
Corrected JTp, ms189.14 (30.39)188.12 (36.43)0.117
TpTe, ms90.91 (10.31)95.37 (18.91)0.186
MCS59.86 (24.34)89.61 (54.29)< 0.001
Flatness score27.03 (11.80)33.71 (13.39)0.007
Asymmetry score15.11 (10.57)23.72 (21.95)< 0.001
Notch score0.04 (0.42)1.32 (6.23)0.004
PCA-2, %18.65 (8.36)25.37 (13.35)< 0.001