Figures
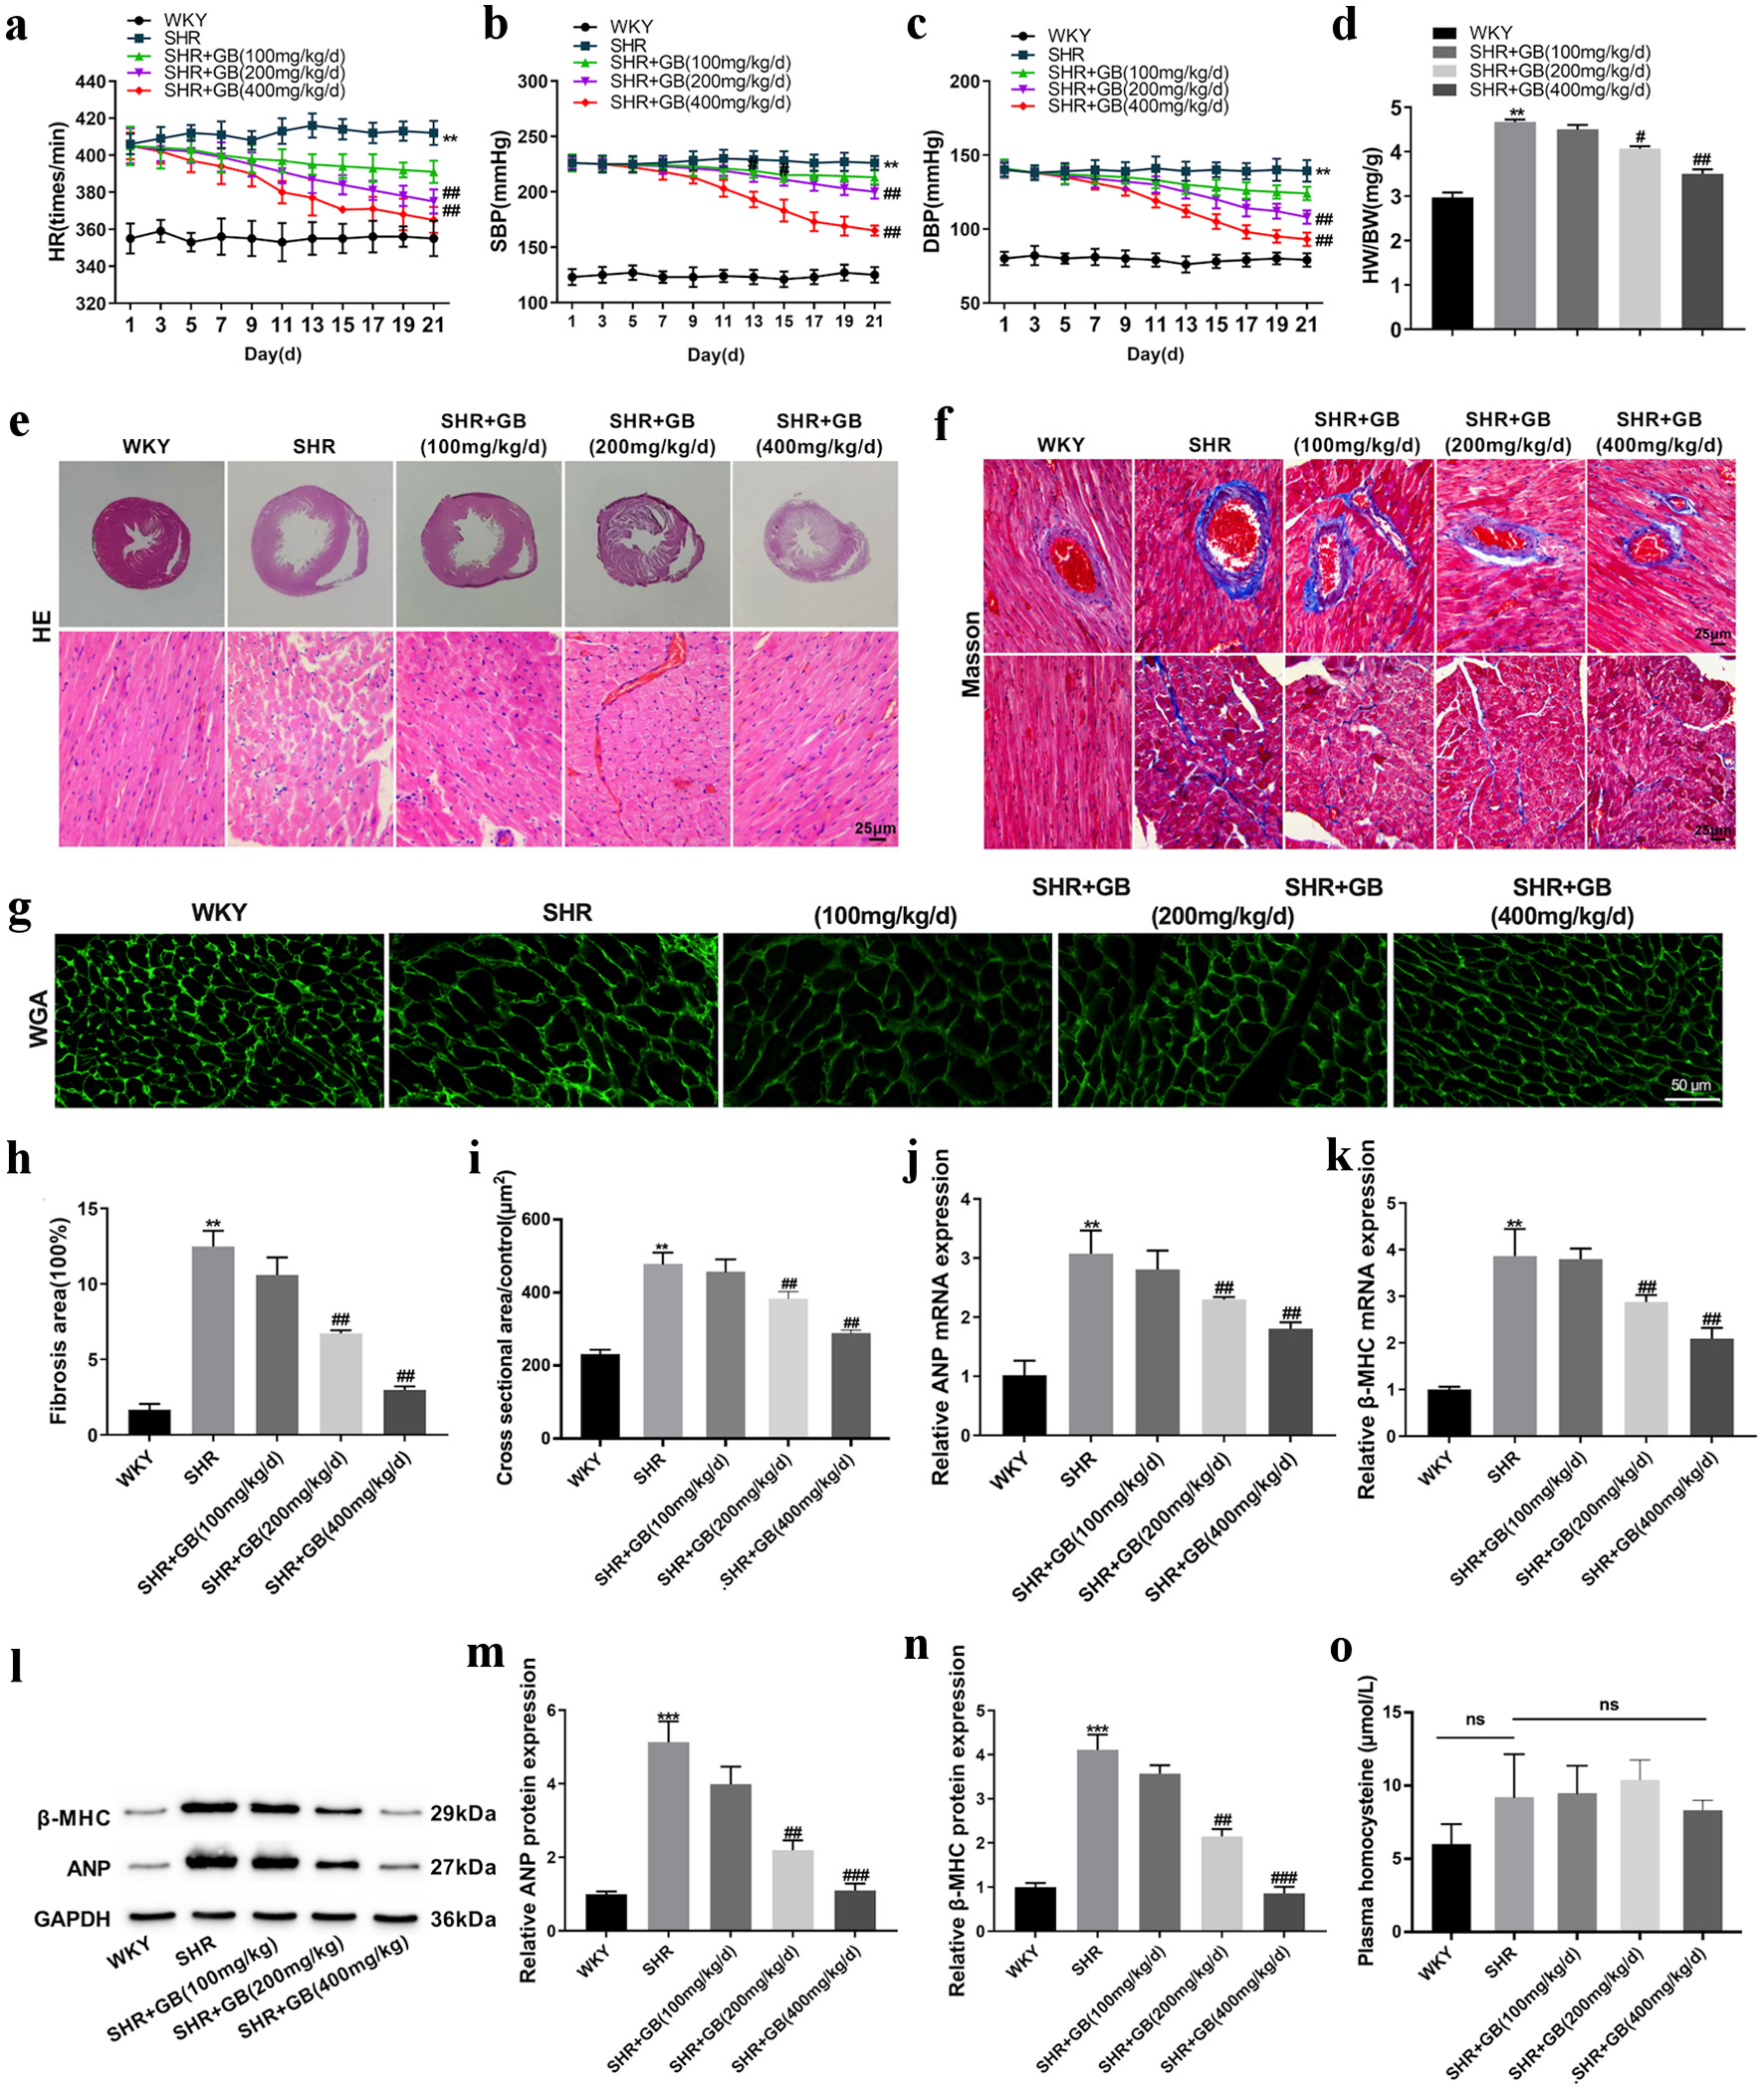
Figure 1. The effect of GB on myocardial hypertrophy of SHRs. SHRs were administrated with 100, 200 or 400 mg/kg/day of GB. Normal WKY rats served as control. Each group included n = 8 rats. The HR (a), SBP (b) and DBP (c) of rats were monitored. (d) The HW/BW of rats was detected at 21 days. (e) Images of hematoxylin and eosin (H&E) staining of the myocardial tissue. (g, i) WGA staining examined the myocyte cross-sectional area of rats. (f, h) Masson staining detected fibrosis in the myocardium of rats. (j-k) The qRT-PCR analyzed the expression of ANP (j) and β-MHC (k) in the myocardium of rats. (l-n) Western blotting detected the expression of ANP (m) and β-MHC (n) in the myocardium of rats. The representative blot was shown from three independent repeats. (o) The effect of GB on plasma homocysteine of SHRs (n = 5). The values are presented as mean ± SD. **P < 0.01, ***P < 0.001 vs. WKY group; #P < 0.05, ##P < 0.01, ###P < 0.001 vs. SHR group. GB: glycine betaine (N, N, N-trimethyl glycine); SHRs: spontaneously hypertensive rats; WKY: Wistar-Kyoto; WGA: wheat germ agglutinin; BW: body weight; DBP: diastolic blood pressure; HR: heart rate; HW: heart weight; qRT-PCR: quantitative real-time PCR; SBP: systolic blood pressure; ANP: atrial natriuretic peptide; β-MHC: β-myosin heavy chain; SD: standard deviation.
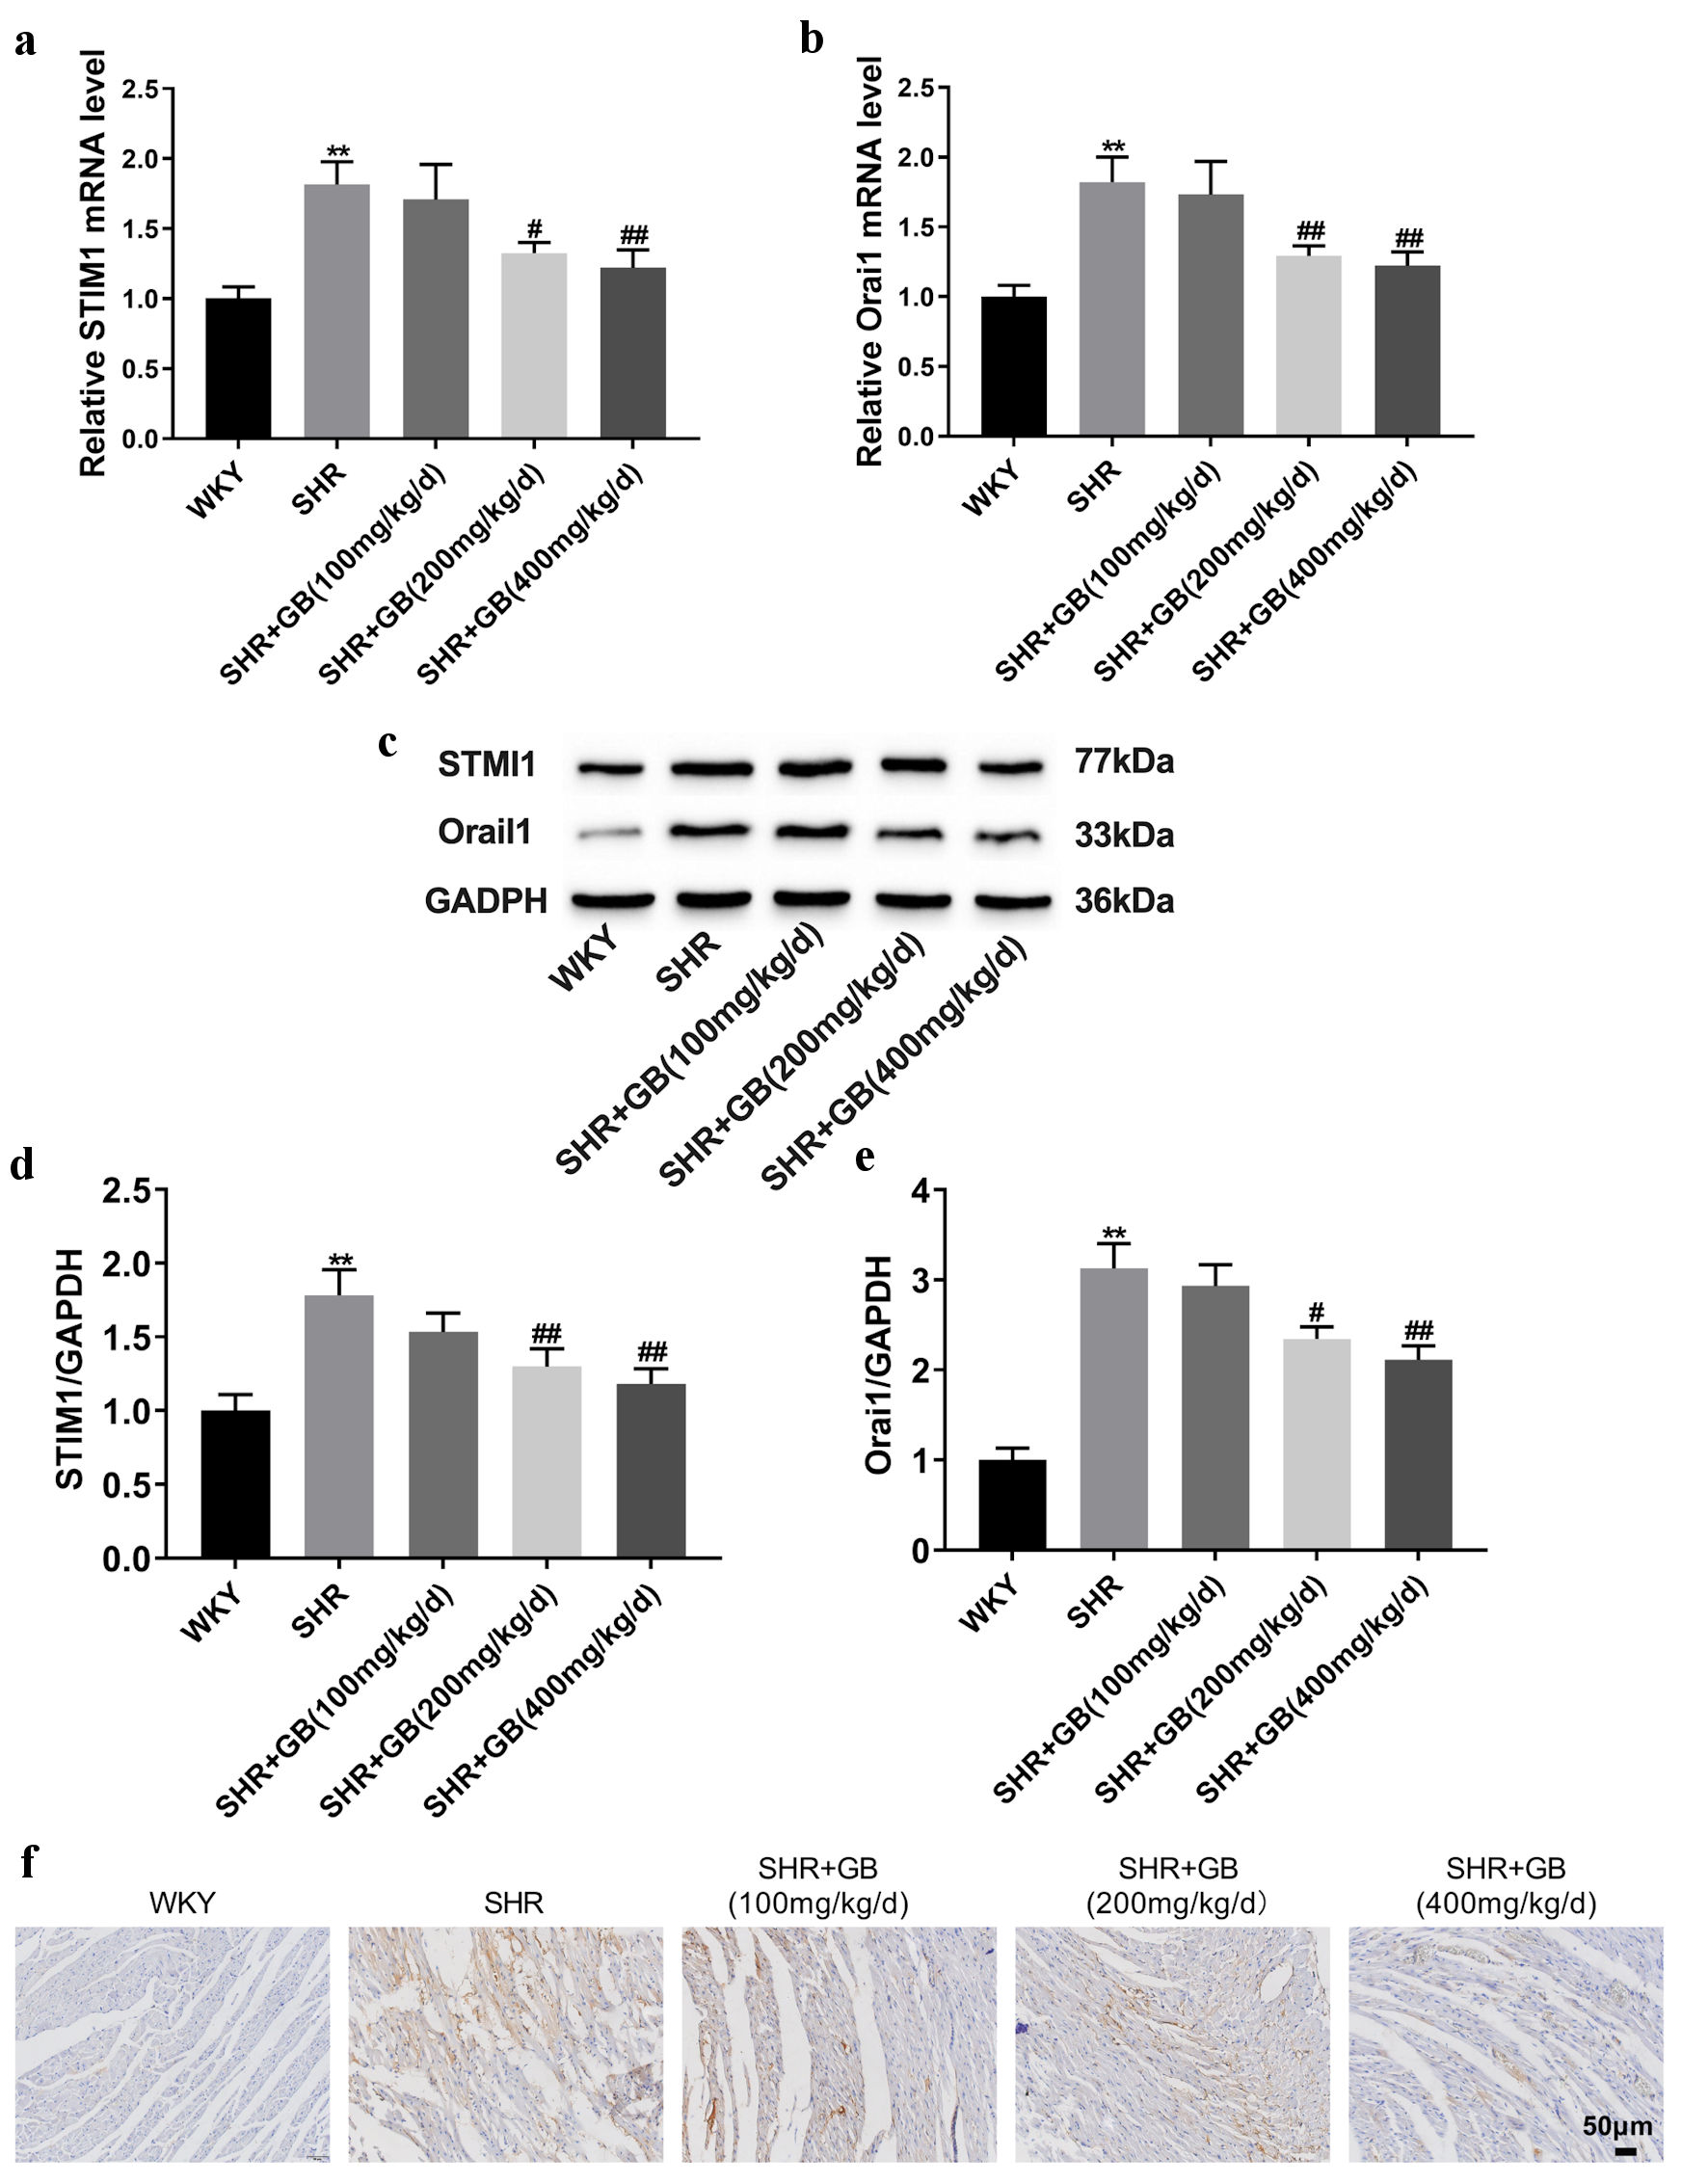
Figure 2. The impact of GB on the expression of STIM1 and Orai1 in SHRs. SHRs were administrated with 100, 200 or 400 mg/kg/day of GB. Normal WKY rats served as control. (a, b) The qRT-PCR analyzed the expression of STIM1 (a) and Orai1 (b) in the myocardium of rats. (c-e) Western blotting analyzed the expression of STIM1(d) and Orai1 (e) in the myocardium of rats. The representative blot was shown from three independent repeats. (f) IHC staining examined the expression of STIM1 in the myocardium of rats. Each group included n = 8 rats. The values are presented as mean ± SD. **P < 0.01 vs. WKY group; #P < 0.05, ##P < 0.01 vs. SHR group. GB: glycine betaine (N, N, N-trimethyl glycine); IHC: immunohistochemistry; Orai1: calcium release-activated calcium channel protein 1; qRT-PCR: quantitative real-time PCR; SHRs: spontaneously hypertensive rats; STIM1: stromal interaction molecule 1; WKY: Wistar-Kyoto; SD: standard deviation; GAPDH: glyceraldehyde-3-phosphate dehydrogenase.
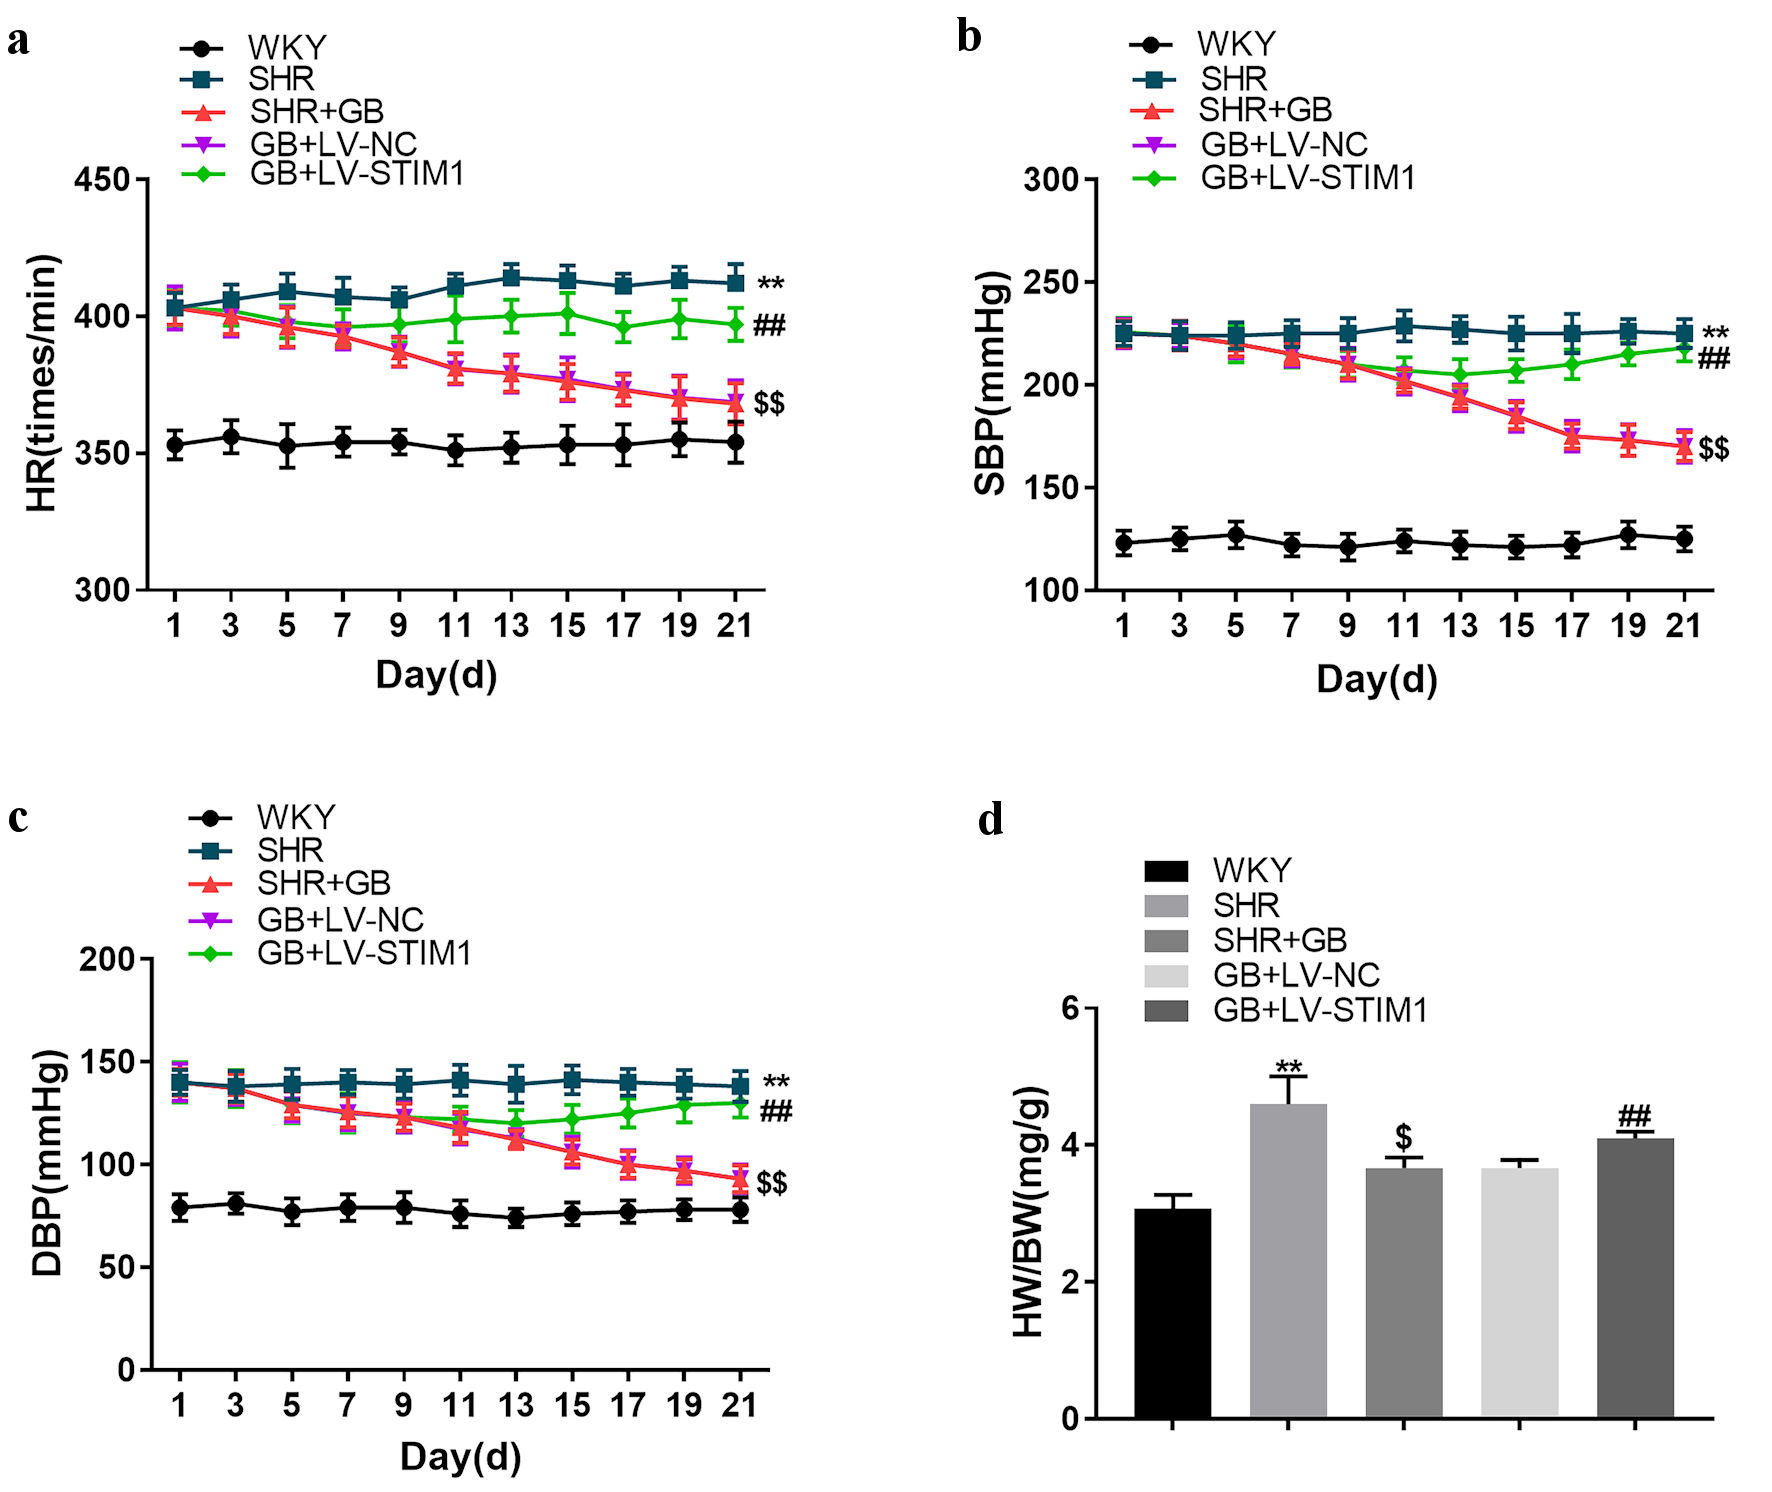
Figure 3. The impact of STIM1 overexpression on SHRs. SHRs were administrated with 400 mg/kg/day of GB or followed by injection of LV-STIM1 or LV-NC. Normal WKY rats served as control. The HR (a), SBP (b) and DBP (c) of rats were monitored. (d) The HW/BW of rats was detected. Each group included n = 8 rats. The values are presented as mean ± SD. **P < 0.01 vs. WKY group; $P < 0.05 vs. $$P < 0.01 vs. SHR group; ##P < 0.01 vs. GB + LV-NC group. BW: body weight; DBP: diastolic blood pressure; GB: glycine betaine (N, N, N-trimethyl glycine); HR: heart rate; HW: heart weight; LV: lentivirus; NC: negative control; SBP: systolic blood pressure; SHRs: spontaneously hypertensive rats; STIM1: stromal interaction molecule 1; WKY: Wistar-Kyoto; SD: standard deviation.
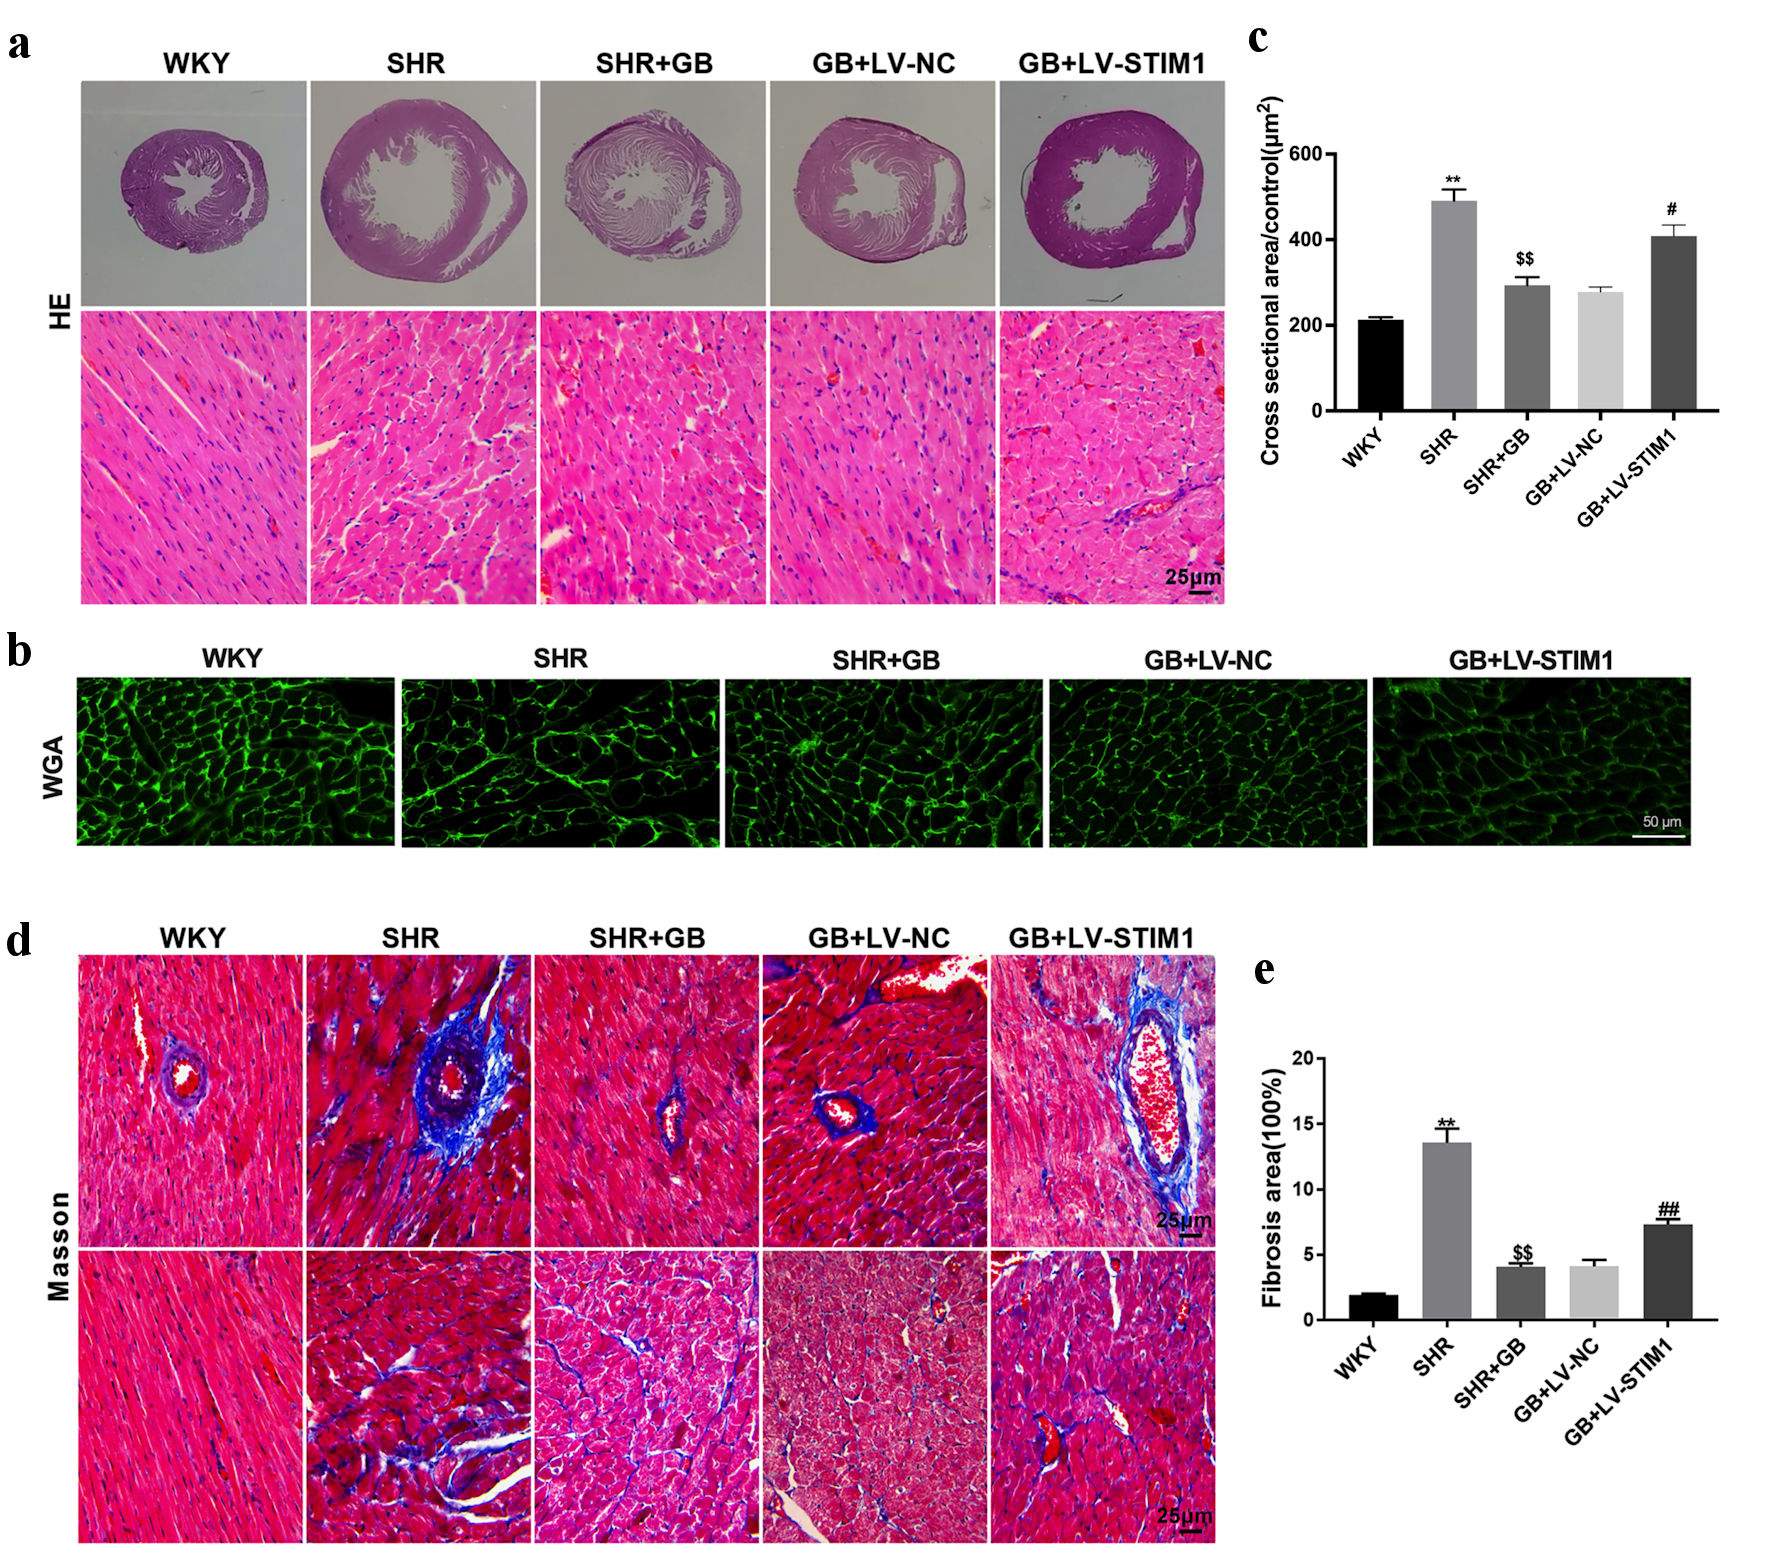
Figure 4. The impact of STIM1 overexpression on myocardial hypertrophy of SHRs. SHRs were administrated with 400 mg/kg/day of GB or followed by injection of LV-STIM1 or LV-NC. Normal WKY rats served as control. (a) Images of hematoxylin and eosin (H&E) staining of the myocardial tissue. (b, c) WGA staining examined the myocyte cross-sectional area of rats. (d, e) Masson staining detected cardiac fibrosis of rats. Each group included n = 8 rats. The values are presented as mean ± SD. **P < 0.01 vs. WKY group; $$P < 0.01 vs. SHR group; #P < 0.05, ##P < 0.01 vs. GB + LV-NC group. GB: glycine betaine (N, N, N-trimethyl glycine); LV: lentivirus; NC: negative control; SHRs: spontaneously hypertensive rats; STIM1: stromal interaction molecule 1; WKY: Wistar-Kyoto; WGA: wheat germ agglutinin; SD: standard deviation.
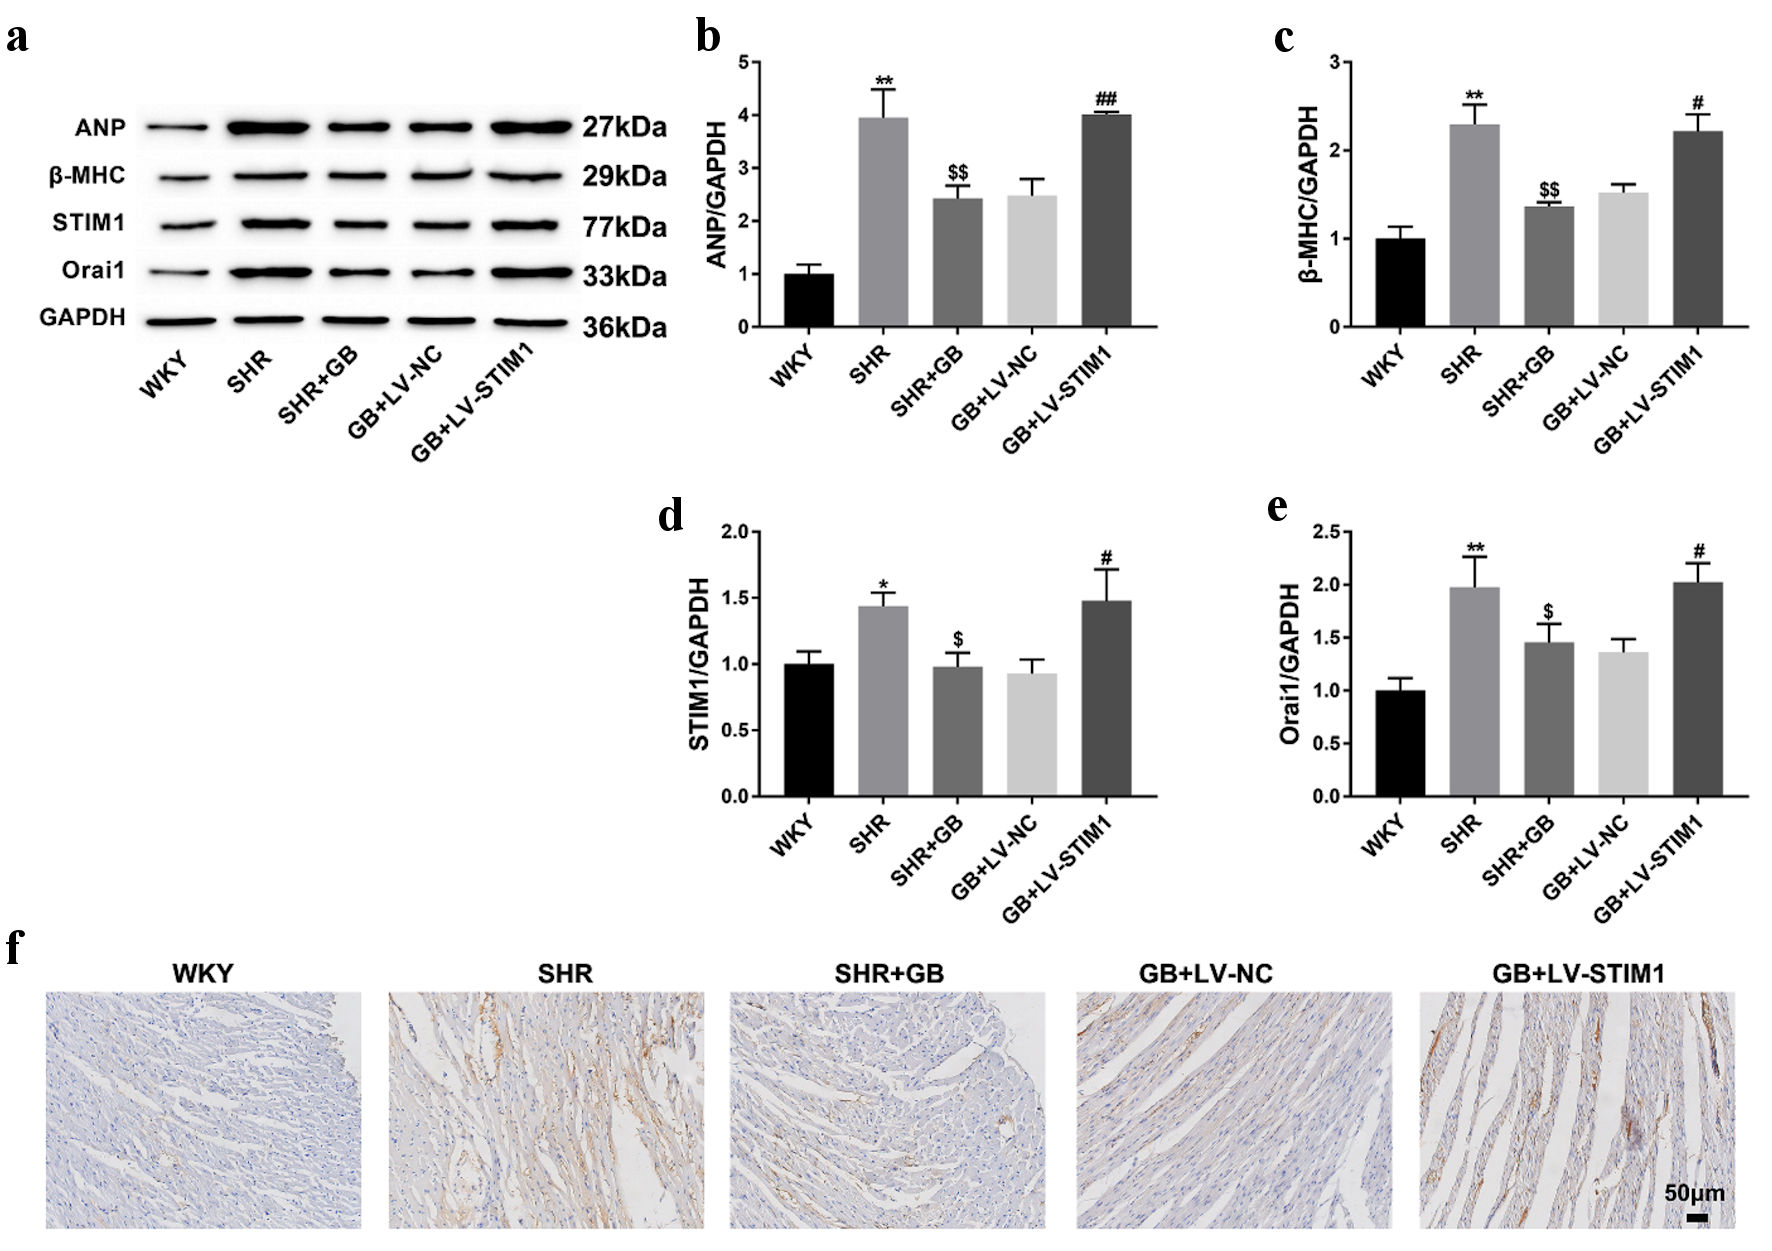
Figure 5. The impact of GB treatment on the expression of STIM1 and Orai1 in SHRs following overexpressed STIM1. SHRs were administrated with 400 mg/kg/day of GB or followed by injection of LV-STIM1 or LV-NC. Normal WKY rats served as control. (a-e) Western blotting analyzed the expression of ANP (b), β-MHC (c), STIM1 (d) and Orai1 (e) in the myocardium of rats. The representative blot was shown from three independent repeats. (f) IHC staining examined the expression of STIM1 in the myocardium of rats. Each group included n = 8 rats. The values are presented as mean ± SD. *P < 0.05, **P < 0.01 vs. WKY group; $P < 0.05, $$P < 0.01 vs. SHR group; #P < 0.05, ##P < 0.01 vs. GB + LV-NC group. GB: glycine betaine (N, N, N-trimethyl glycine); LV: lentivirus; NC: negative control; SHRs: spontaneously hypertensive rats; STIM1: stromal interaction molecule 1; WKY: Wistar-Kyoto; SD: standard deviation; ANP: atrial natriuretic peptide; β-MHC: β-myosin heavy chain; IHC: immunohistochemistry; Orai1: calcium release-activated calcium channel protein 1; GAPDH: glyceraldehyde-3-phosphate dehydrogenase.
Table
Table 1. Primers Used in qRT-PCR
| Gene | Forward (5’ - 3’) | Reverse (5’ - 3’) |
|---|
| Orai1: calcium release-activated calcium channel protein 1; qRT-PCR: quantitative real-time PCR; STIM1: stromal interaction molecule 1; ANP: atrial natriuretic peptide; β-MHC: β-myosin heavy chain; GAPDH: glyceraldehyde-3-phosphate dehydrogenase. |
| ANP | GAGGAGAAGATGCCGGTAG | CTAGAGAGGGAGCTAAGTG |
| β-MHC | TGTGAAGGAGGACCAGGTGATG | ATAGGCGTTGTCAGAGATGGAGAA |
| STIM1 | AGCTGAAGGCTCTGGACACAGT | CACCCACACCAATCACGATAGA |
| Orai1 | CATGGTAGCGATGGTGGAAGT | GGCGCTGAAGACGATGAGTAAC |
| GAPDH | GTCCCCGAGACACGATGGTGAAGGT | TTCTCAGCCTTGACCGTGCCG |