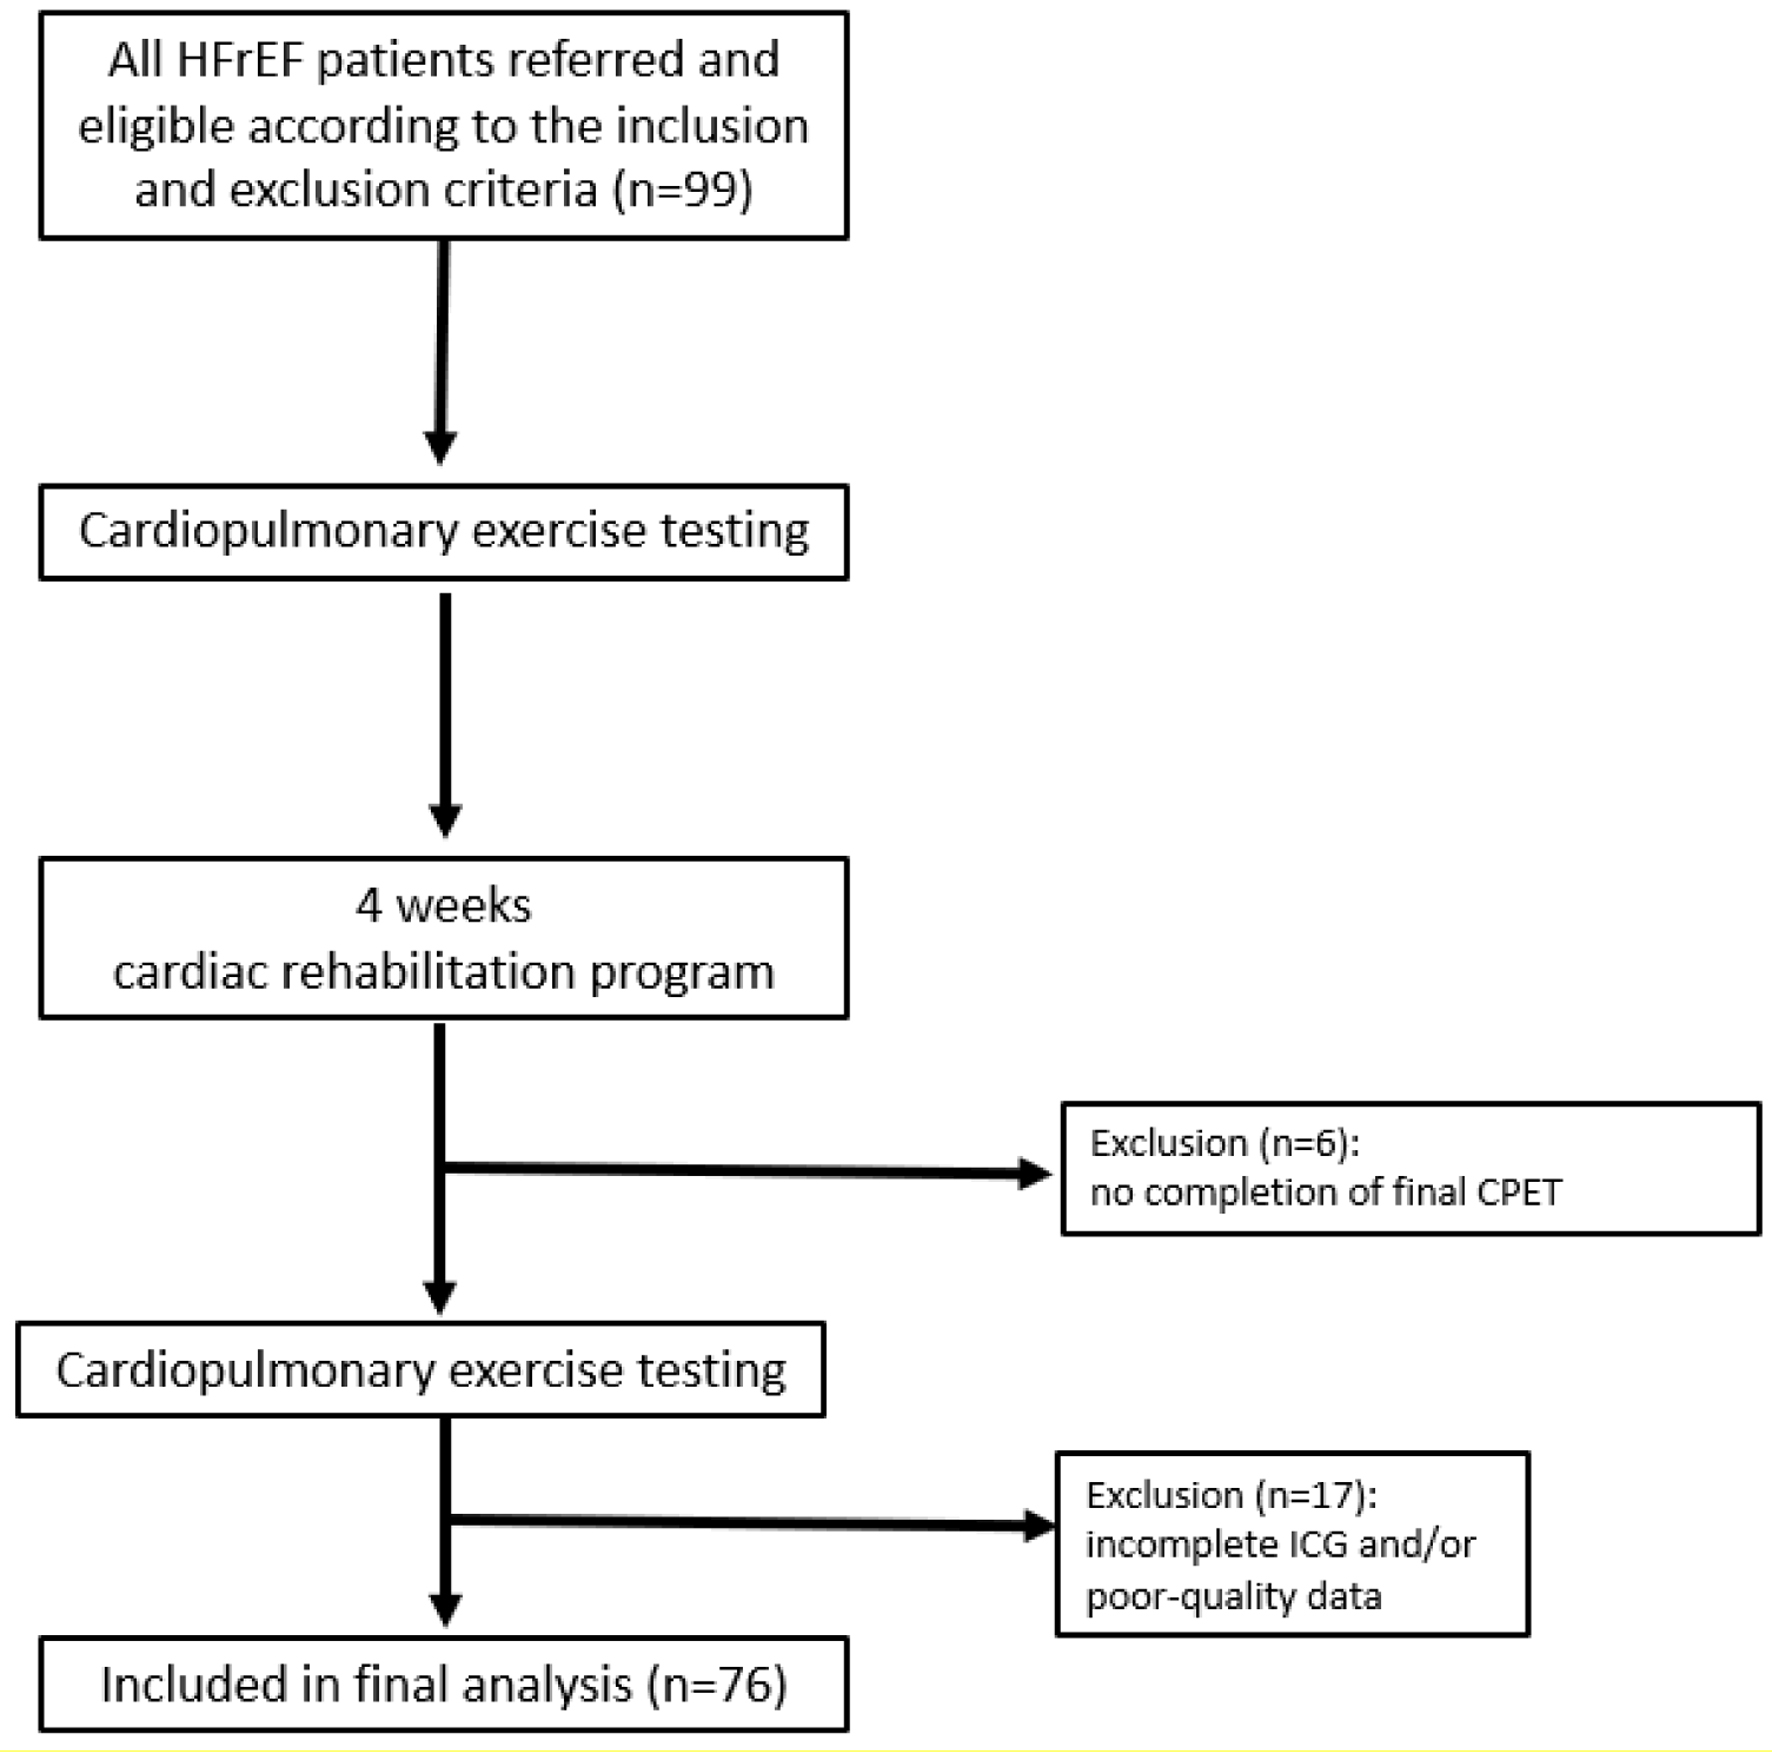
Figure 1. Flowchart of the study. CPET: cardiopulmonary exercise testing; HFrEF: heart failure with reduced ejection fraction; ICG: impedance cardiography.
| Cardiology Research, ISSN 1923-2829 print, 1923-2837 online, Open Access |
| Article copyright, the authors; Journal compilation copyright, Cardiol Res and Elmer Press Inc |
| Journal website https://www.cardiologyres.org |
Original Article
Volume 15, Number 1, February 2024, pages 18-28
Hemodynamic Response to Exercise Training in Heart Failure With Reduced Ejection Fraction Patients
Figures
Tables
| Variable | All patients (n = 76) | Non-responders (n = 38) (ΔV̇O2peak ≤ 2.2 mL/min/kg) | Responders (n = 38) (ΔV̇O2peak > 2.2 mL/min/kg) |
|---|---|---|---|
| Data are expressed as mean ± SD for parametric data or as n (%) for dichotomous variables. AF: atrial fibrillation; BM: body mass; BMI: body mass index; BNP: brain natriuretic peptide; Coro: coronaropathy; DCM: dilated cardiomyopathy; F: female; HFrEF: heart failure with reduced ejection fraction; ICD: implantable cardioverter-defibrillator; M: male; SD: standard deviation. | |||
| Sex ratio (F/M) | 11/65 (14/86) | 6/32 (16/84) | 5/33 (13/77) |
| Age (years) | 57 ± 12 | 59 ± 13 | 56 ± 12 |
| Height (cm) | 173.27 ± 9.28 | 172.03 ± 8.18 | 174.49 ± 10.19 |
| BM (kg) | 72.93 ± 16.61 | 72.79 ± 13.64 | 73.06 ± 13.26 |
| BMI (kg/m2) | 24.17 ± 4.54 | 24.54 ± 4.12 | 23.80 ± 4.95 |
| Blood analysis | |||
| Hemoglobin (g/dL) | 12.79 ± 1.94 | 12.84 ± 1.96 | 12.73 ± 1.92 |
| Creatinine (µmol/L) | 101 ± 32.86 | 101 ± 41.32 | 100 ± 24.40 |
| Median of BNP values (pg/mL) | 384 | 396 | 372 |
| Cardiovascular risk factors | |||
| DCM | 26 (34) | 14 (37) | 12 (32) |
| Coro | 24 (32) | 13 (34) | 11 (29) |
| Hypertension | 17 (22) | 7 (18) | 10 (26) |
| AF | 7 (9) | 5 (13) | 2 (5) |
| ICD | 17 (22) | 11 (29) | 6 (16) |
| Type 2 diabetes | 7 (9) | 5 (13) | 2 (5) |
| Baseline medication | |||
| Bisoprolol | 58 (76) | 31 (82) | 27 (71) |
| Ramipril | 53 (70) | 26 (68) | 27 (71) |
| Eplerenone | 51 (67) | 27 (71) | 24 (63) |
| Entresto | 15 (20) | 7 (18) | 8 (21) |
| Furosemide | 56 (74) | 29 (76) | 27 (71) |
| Variable | Pre | Post | P-value | |||
|---|---|---|---|---|---|---|
| At rest | At peak | At rest | At peak | At rest | At peak | |
| Data are expressed as mean ± SD. *P ≤ 0.05; **P ≤ 0.01; ***P ≤ 0.001; ****P ≤ 0.0001. CO: cardiac output; DBP: diastolic blood pressure; HR: heart rate; SBP: systolic blood pressure; SD: standard deviation; SV: stroke volume; SVR: systemic vascular resistance; V̇E: ventilation; V̇E/V̇O2: minute ventilation/oxygen production; V̇E/V̇CO2: minute ventilation/carbon dioxide production; V̇O2: oxygen uptake. | ||||||
| V̇O2 (mL/min/kg) | 5.31 ± 1.99 | 13.42 ± 3.53 | 5.04 ± 1.60 | 15.72 ± 4.82 | 0.3264 | < 0.0001**** |
| HR (bpm) | 78.95 ± 14.34 | 108.51 ± 22.52 | 73.60 ± 12.80 | 113.55 ± 24.24 | 0.0003*** | 0.0056** |
| SV (mL) | 61.56 ± 19.37 | 81.72 ± 25.10 | 65.37 ± 16.93 | 89.29 ± 26.18 | 0.0496* | 0.0157* |
| CO (L/min) | 4.93 ± 1.40 | 8.80 ± 3.32 | 4.76 ± 1.19 | 10.08 ± 3.91 | 0.1857 | 0.0012** |
| SBP (mm Hg) | 97.94 ± 19.39 | 125.19 ± 37.38 | 98.56 ± 18.17 | 134.13 ± 36.19 | 0.7989 | 0.0690 |
| DBP (mm Hg) | 64.82 ± 16.50 | 69.42 ± 19.67 | 63.10 ± 11.31 | 74.08 ± 18.78 | 0.3414 | 0.0474* |
| V̇E (L/min) | 15.31 ± 4.79 | 47.29 ± 13.94 | 14.49 ± 4.20 | 54.81 ± 16.64 | 0.1917 | < 0.0001**** |
| V̇E/V̇O2 | 41.84 ± 8.71 | 50.73 ± 11.51 | 41.43 ± 9.75 | 50.29 ± 11.78 | 0.7277 | 0.6618 |
| V̇E/V̇CO2 | 49.05 ± 9.33 | 45.30 ± 10.32 | 48.30 ± 10.11 | 43.58 ± 9.28 | 0.4893 | 0.0319* |
| SVR (dyn.s/cm5) | 1,250.18 ± 255.69 | 809.79 ± 280.00 | 1,246.38 ± 247.72 | 744.21 ± 271.85 | 0.9111 | 0.0417* |
| Variable | Non-responders (n = 38) (ΔV̇O2peak/kg ≤ 2.2 mL/min/kg) | Responders (n = 38) (ΔV̇O2peak/kg > 2.2 mL/min/kg) | P-value | ||
|---|---|---|---|---|---|
| Group × time interaction | Group | Timea | |||
| Data are expressed as mean ± SD. aOverall time P-value in case of a non-significant group × time interaction. bP-value Δ (post - pre) within group. *P ≤ 0.05; **P ≤ 0.01; ***P ≤ 0.001; ****P ≤ 0.0001. CO: cardiac output; DBP: diastolic blood pressure; HR: heart rate; SBP: systolic blood pressure; SD: standard deviation; SVR: systemic vascular resistance; V̇E: ventilation; V̇E/V̇O2: minute ventilation/oxygen production; V̇E/V̇CO2: minute ventilation/carbon dioxide production; V̇O2oxygen uptake. | |||||
| SBP (mm Hg) | |||||
| Pre | 128.13 ± 39.53 | 122.33 ± 35.43 | 0.1186 | 0.9414 | 0.0485* |
| Post | 130.18 ± 32.26 | 137.97 ± 39.98 | |||
| Δ (post - pre) | 2.05 ± 39.86 | 15.64 ± 44.43 | |||
| P-value Δ (post - pre)b | 0.9441 | 0.0265* | |||
| DBP (mm Hg) | |||||
| Pre | 68.66 ± 18.03 | 70.15 ± 21.36 | 0.2766 | 0.4334 | 0.0259* |
| Post | 71.34 ± 16.26 | 76.74 ± 20.82 | |||
| Δ (post - pre) | 2.68 ± 15.72 | 6.59 ± 24.00 | |||
| P-value Δ (post - pre) | 0.6495 | 0.0392* | |||
| V̇E (L/min) | |||||
| Pre | 47.84 ± 12.76 | 46.74 ± 15.15 | < 0.0001**** | 0.1422 | < 0.0001**** |
| Post | 48.84 ± 14.17 | 60.62 ± 16.99 | |||
| Δ (post - pre) | 1.00 ± 7.63 | 13.87 ± 10.79 | |||
| P-value Δ (post - pre) | 0.7563 | < 0.0001**** | |||
| V̇O2 (mL/min/kg) | |||||
| Pre | 13.23 ± 3.66 | 13.59 ± 3.45 | < 0.0001**** | 0.0017** | < 0.0001**** |
| Post | 13.05 ± 3.04 | 18.33 ± 4.82 | |||
| Δ (post - pre) | -0.18 ± 2.28 | 4.73 ± 2.62 | |||
| P-value Δ (post - pre) | 0.8457 | < 0.0001**** | |||
| HR (bpm) | |||||
| Pre | 108.42 ± 23.37 | 108.59 ± 21.96 | 0. 0311* | 0. 4129 | 0. 0040** |
| Post | 109.76 ± 22.96 | 117.23 ± 25.17 | |||
| Δ (post - pre) | 1.34 ± 13.79 | 8.64 ± 16.41 | |||
| P-value Δ (post - pre) | 0. 8299 | 0. 0010*** | |||
| V̇E/V̇O2 | |||||
| Pre | 52.31 ± 11.41 | 49.18 ± 11.54 | 0.6131 | 0.1839 | 0.7062 |
| Post | 52.45 ± 11.58 | 48.20 ± 11.74 | |||
| Δ (post - pre) | 0.13 ± 8.97 | -0.98 ± 8.45 | |||
| P-value Δ (post - pre) | 0.9947 | 0.7817 | |||
| V̇E/V̇CO2 | |||||
| Pre | 46.51 ± 10.15 | 44.11 ± 10.47 | 0.3726 | 0.1879 | 0.0359* |
| Post | 45.52 ± 9.06 | 41.69 ± 9.21 | |||
| Δ (post - pre) | -0.99 ± 6.52 | -2.43 ± 7.26 | |||
| P-value Δ (post - pre) | 0.6196 | 0.0691 | |||
| CO (L/min) | |||||
| Pre | 9.02 ± 3.39 | 8.59 ± 3.28 | 0.0185* | 0.4963 | 0.0011** |
| Post | 9.39 ± 3.76 | 10.75 ± 3.98 | |||
| Δ (post - pre) | 0.37 ± 3.25 | 2.16 ± 3.22 | |||
| P-value Δ (post - pre) | 0.7309 | 0.0002*** | |||
| SVR (dyn.s/cm5) | |||||
| Pre | 799.16 ± 278.65 | 820.15 ± 284.55 | 0.5407 | 0.9637 | 0.0515 |
| Post | 755.29 ± 254.44 | 733.41 ± 290.73 | |||
| Δ (post - pre) | -43.87 ± 264.61 | -86.74 ± 291.99 | |||
| P-value Δ (post - pre) | 0.5615 | 0.1363 | |||