Figures
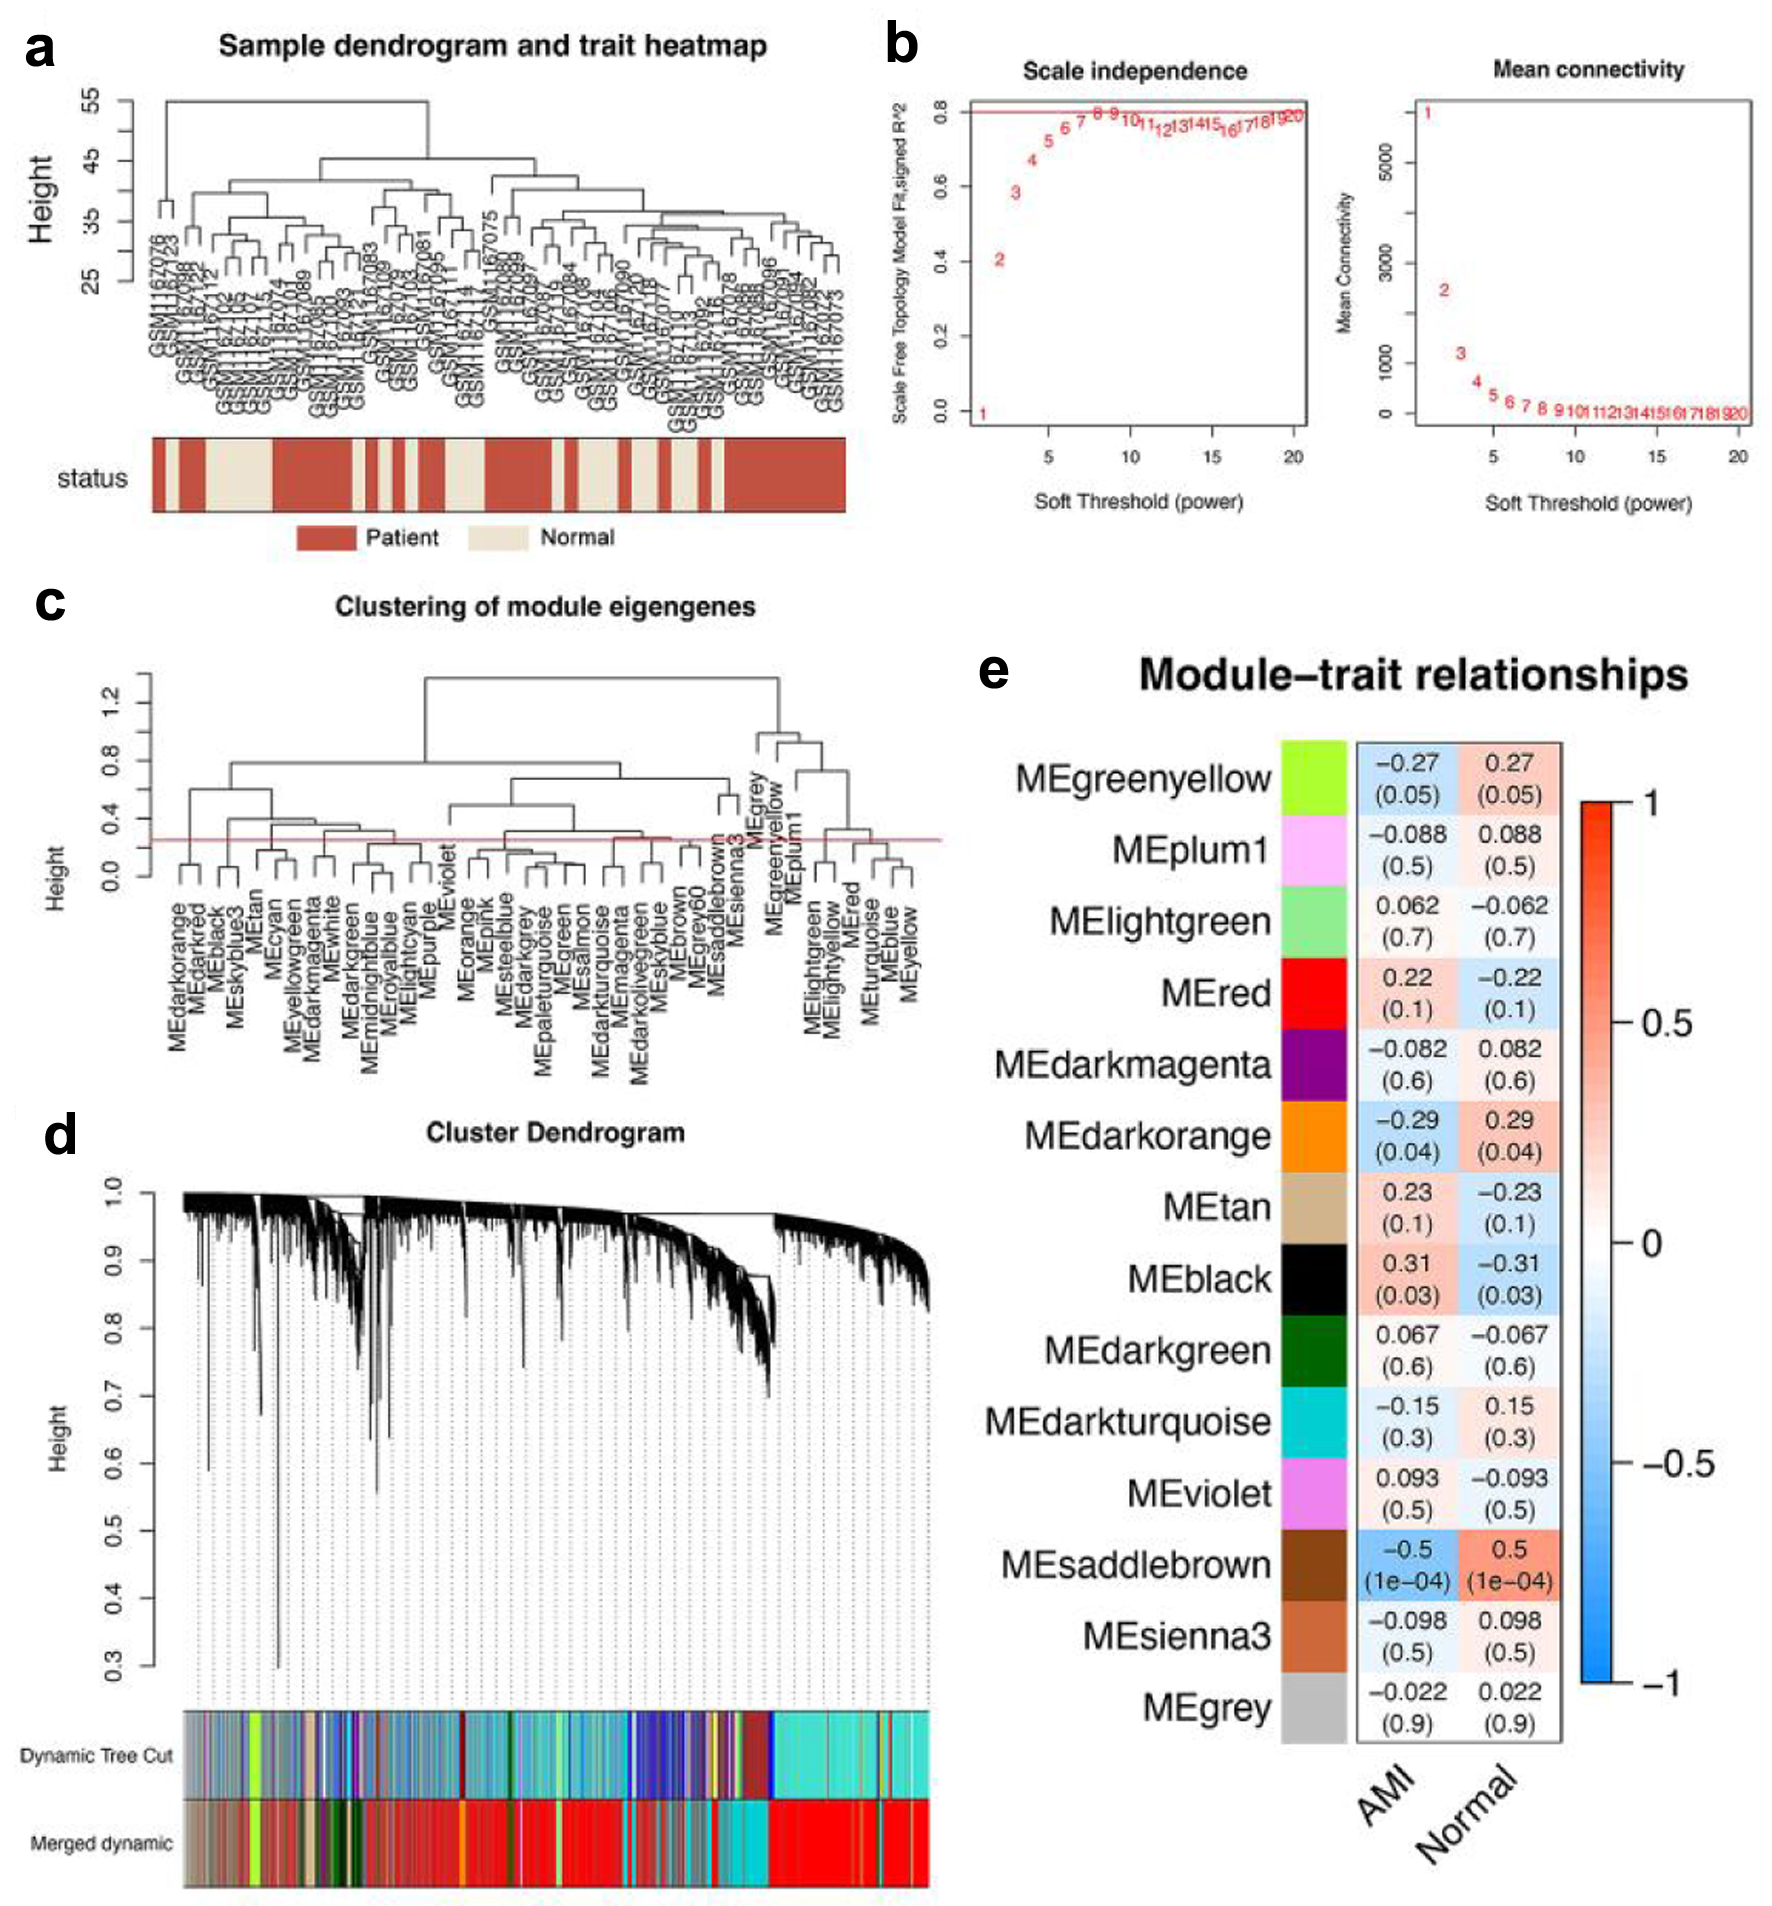
Figure 1. WGCNA revealed that genes contained in the saddlebrown module were maximally associated with AMI. (a) Cluster dendrogram of 52 samples, including 31 AMI samples (purplishred) and 21 normal control samples (lightyellow). (b) Analysis of network topology for various soft-thresholding powers, and 8 was the fittest power value. (c) Clustering diagram of module feature genes. (d) Clustering dendrogram of genes, with dissimilarity based on the topological overlap. A total of 14 modules were acquired after consolidation, and the saddlebrown module was considered to be the most relevant to AMI. (e) Heatmap showing the correlation between different color modules and clinical traits. AMI: acute myocardial infarction; WGCNA: weighted gene co-expression network analysis.
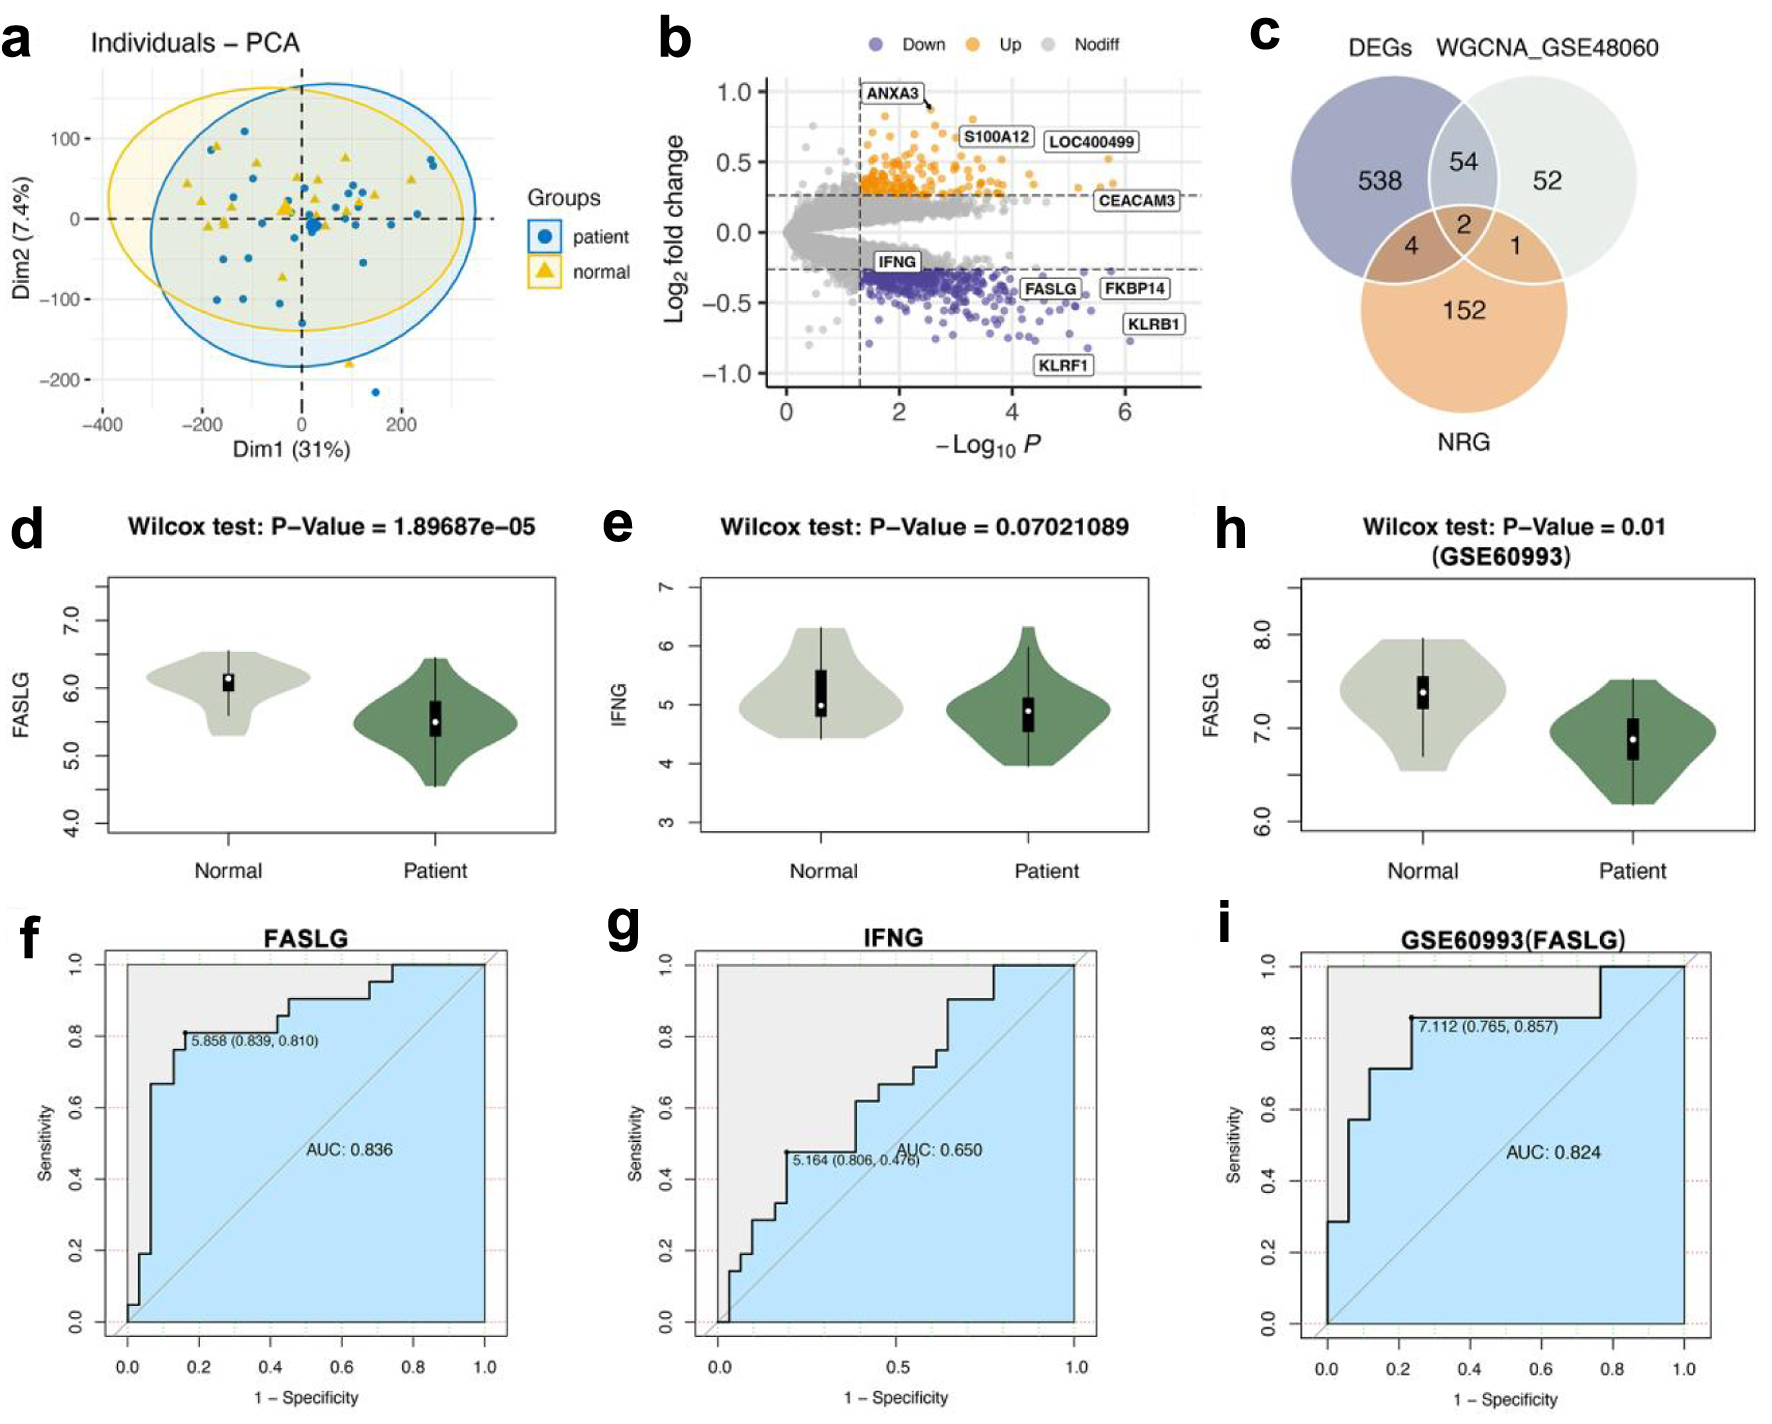
Figure 2. FASLG was a key gene associated with necroptosis for AMI diagnosis. (a) PCA of AMI group and normal control group. (b) Volcano plot of difference analysis between AMI group and normal group in GSE48060. (c) Venn diagram of intersecting genes in DEGs, WGCNA_GSE48060, NRG. (d) The Wilcox rank-sum test for the expression level of FASLG in the AMI and normal control groups (P = 1.89687 × 10⁻⁵). (e) The Wilcox rank-sum test for the expression level of IFNG in the AMI group and normal control group (P = 0.07021089). (f) The ROC curve of FASLG to differentiate the AMI group and normal control group with an AUC of 0.836. (g) The ROC curve of IFNG to differentiate the AMI group and normal control group with an AUC of 0.650. (h) The Wilcox rank-sum test for the expression level of FASLG in GSE60993 (P = 0.01). (i) The ROC curve of FASLG to differentiate the AMI group and normal control group in GSE60993 with an AUC of 0.824. AUC: area under the ROC curve; AMI: acute myocardial infarction; DEGs: differentially expressed genes; NRG: necroptosis-related gene; PCA: principal component analysis; ROC: receiver operating characteristic; WGCNA: weighted gene co-expression network analysis.
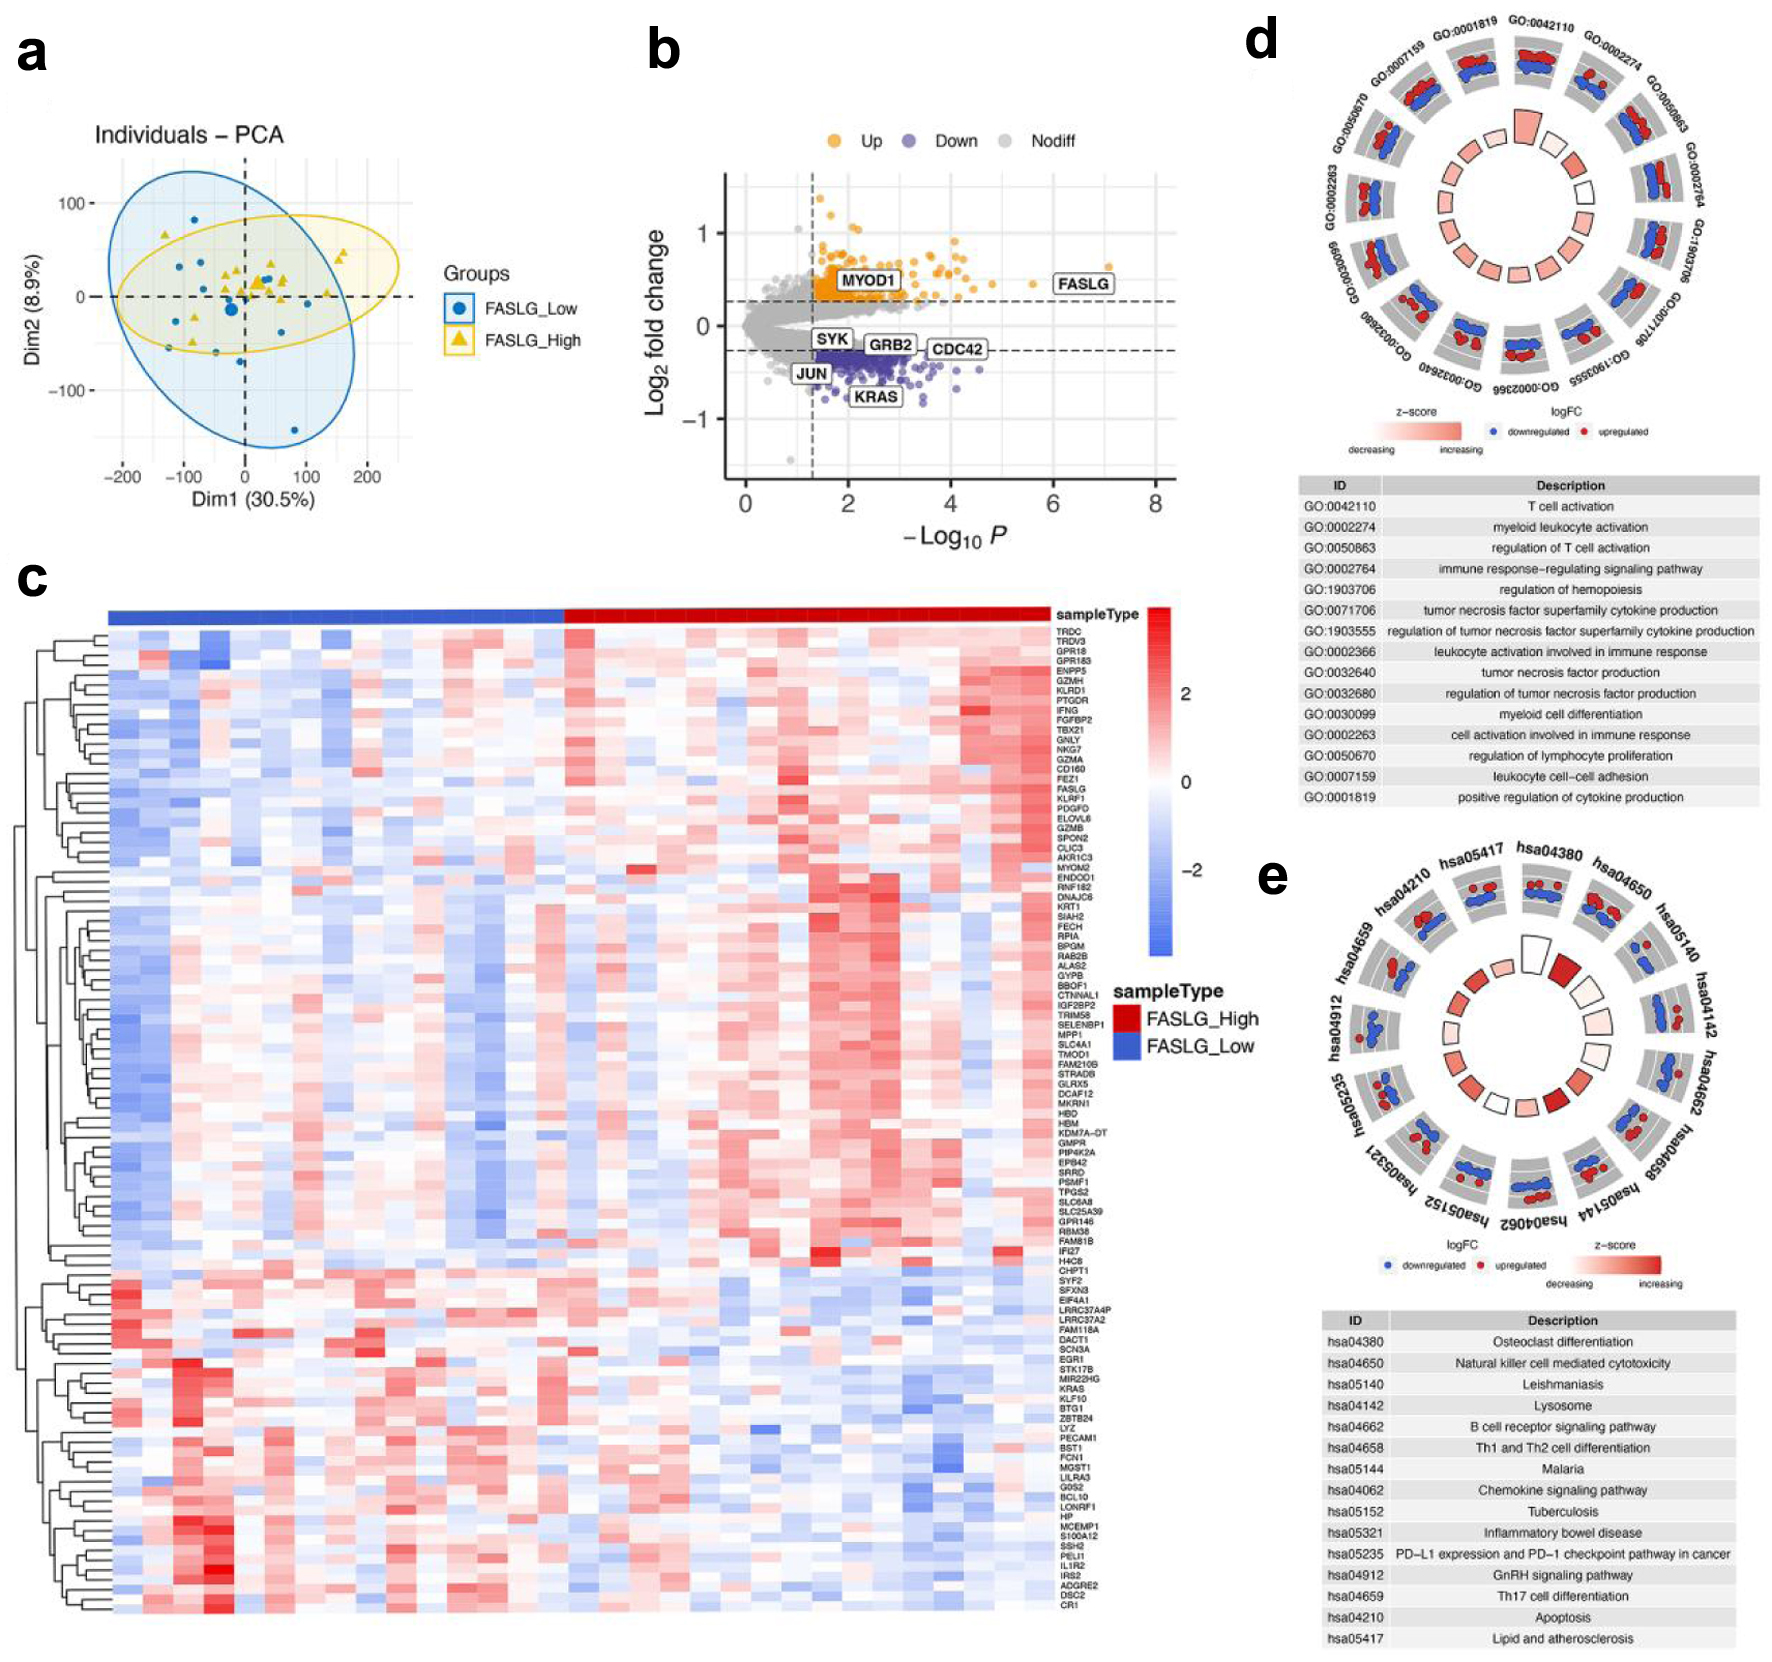
Figure 3. Differentially expressed gene identification and functional enrichment of FASLG high and low expression groups. (a) PCA was performed on the FASLG high expression and FAGLG low expression groups. (b) Volcano plot for differential analysis of FASLG high and low expression groups. Purple dots represent down-regulated genes and yellow dots represent up-regulated genes. (c) Heatmap showed the top 100 genes with |logFC| values among the differentially expressed genes in the FASLG high expression and FASLG low expression groups. (d) GO analysis of differentially expressed genes. (e) KEGG analysis of differentially expressed genes. GO: Gene Ontology; KEGG: Kyoto Encyclopedia of Genes and Genomes; PCA: principal component analysis.
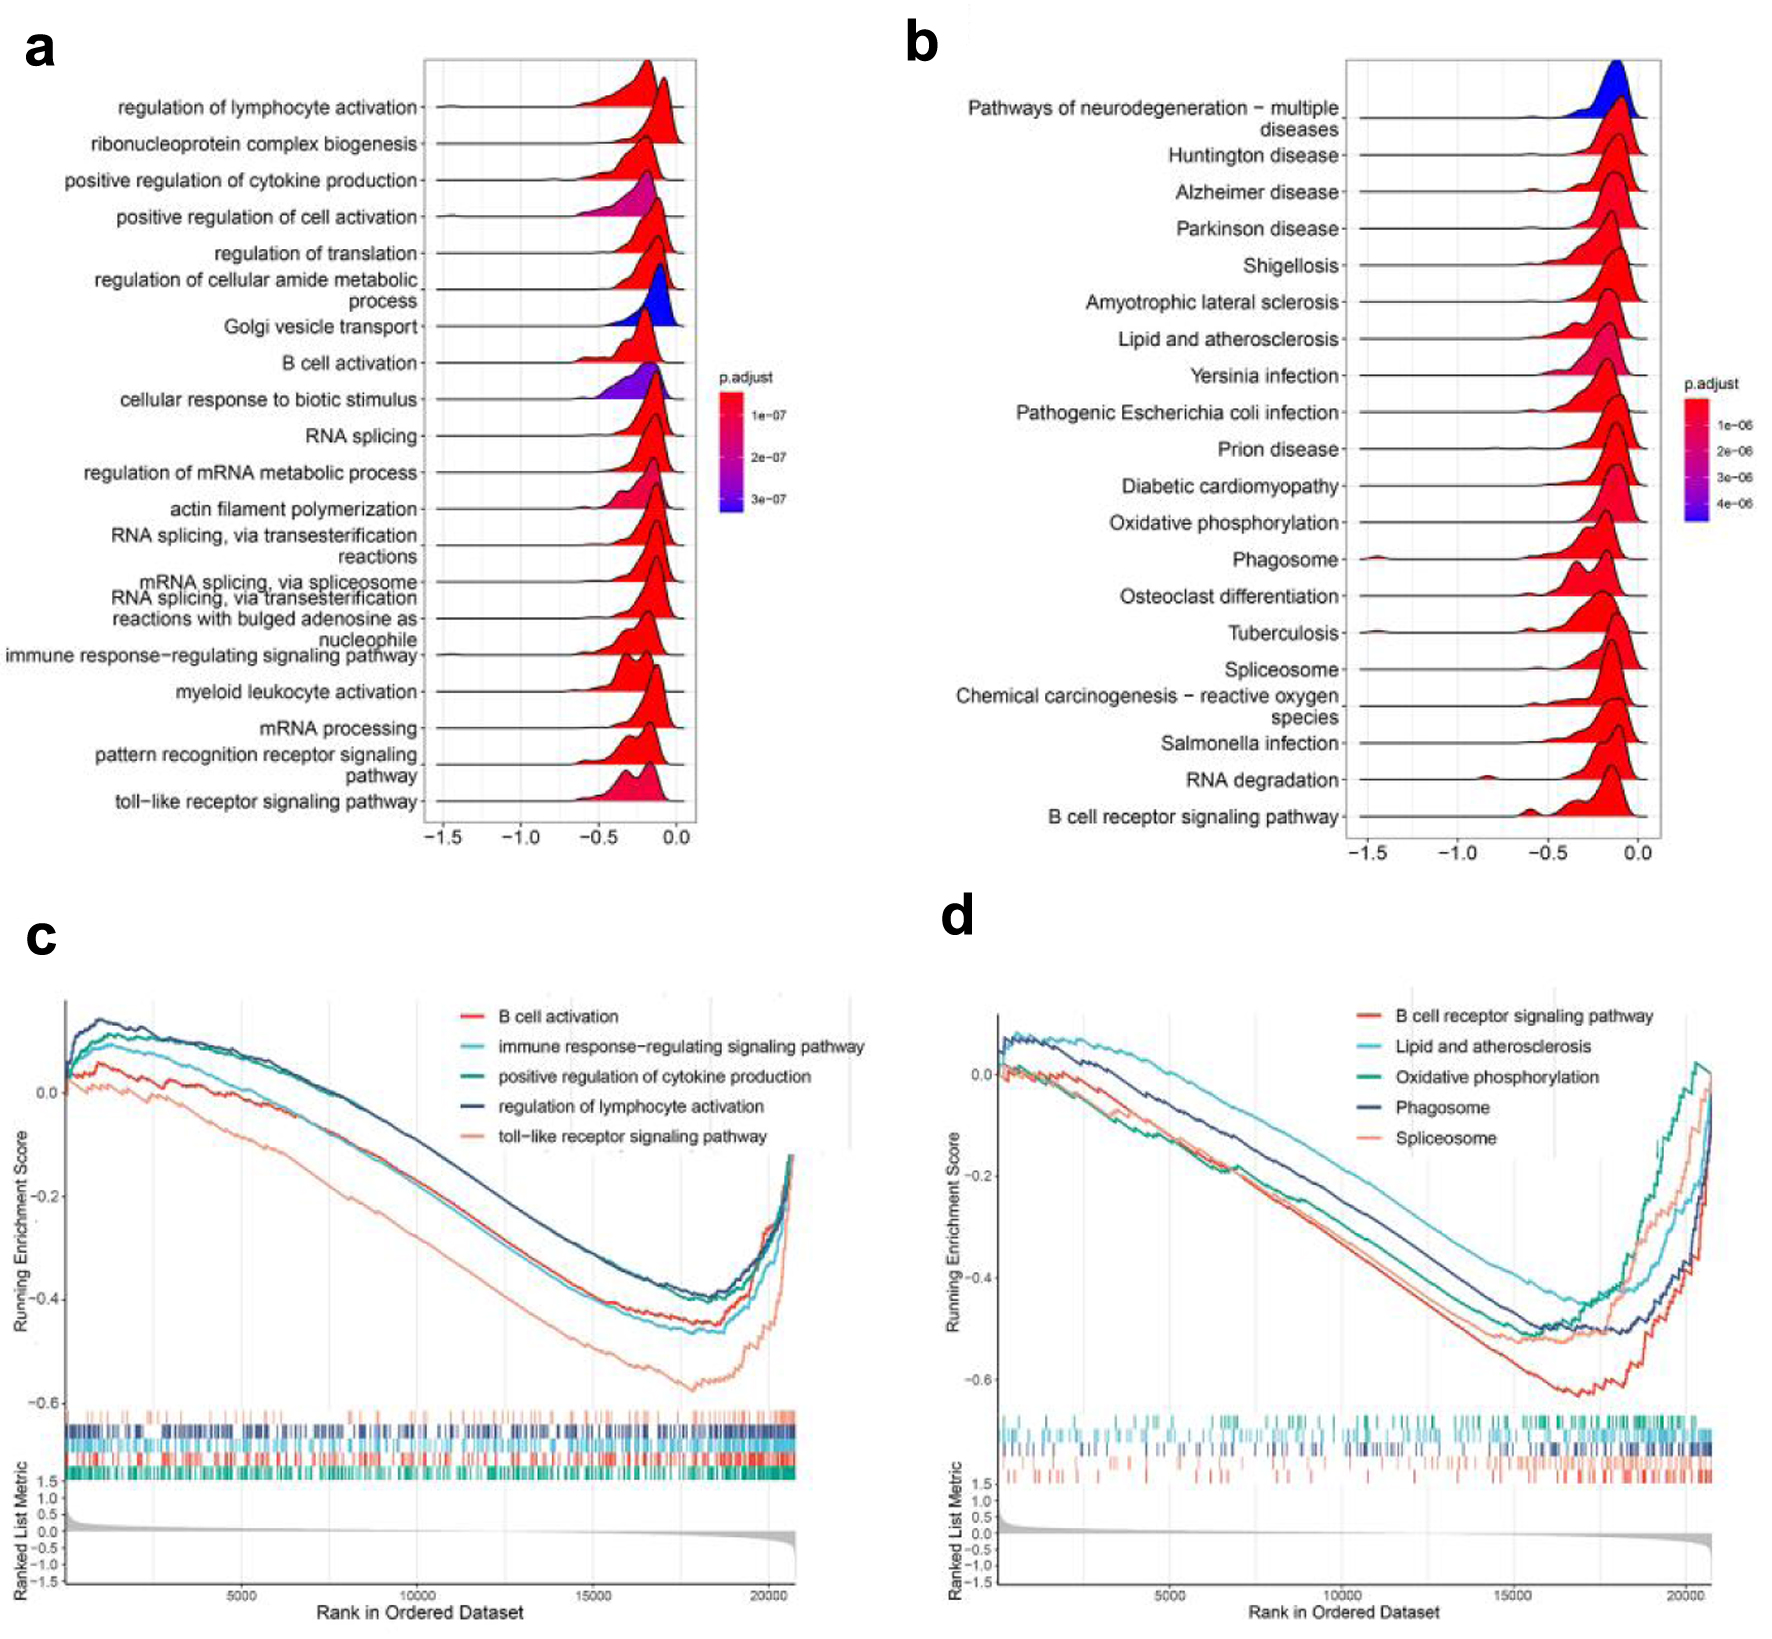
Figure 4. GSEA analysis. (a) GO enrichment analysis of GSEA enrichment analysis. (b) KEGG enrichment analysis of GSEA enrichment analysis. (c) A portion of the enriched GO terms. (d) A portion of the enriched KEGG pathways. GSEA: gene set enrichment analysis; GO: Gene Ontology; KEGG: Kyoto Encyclopedia of Genes and Genomes.
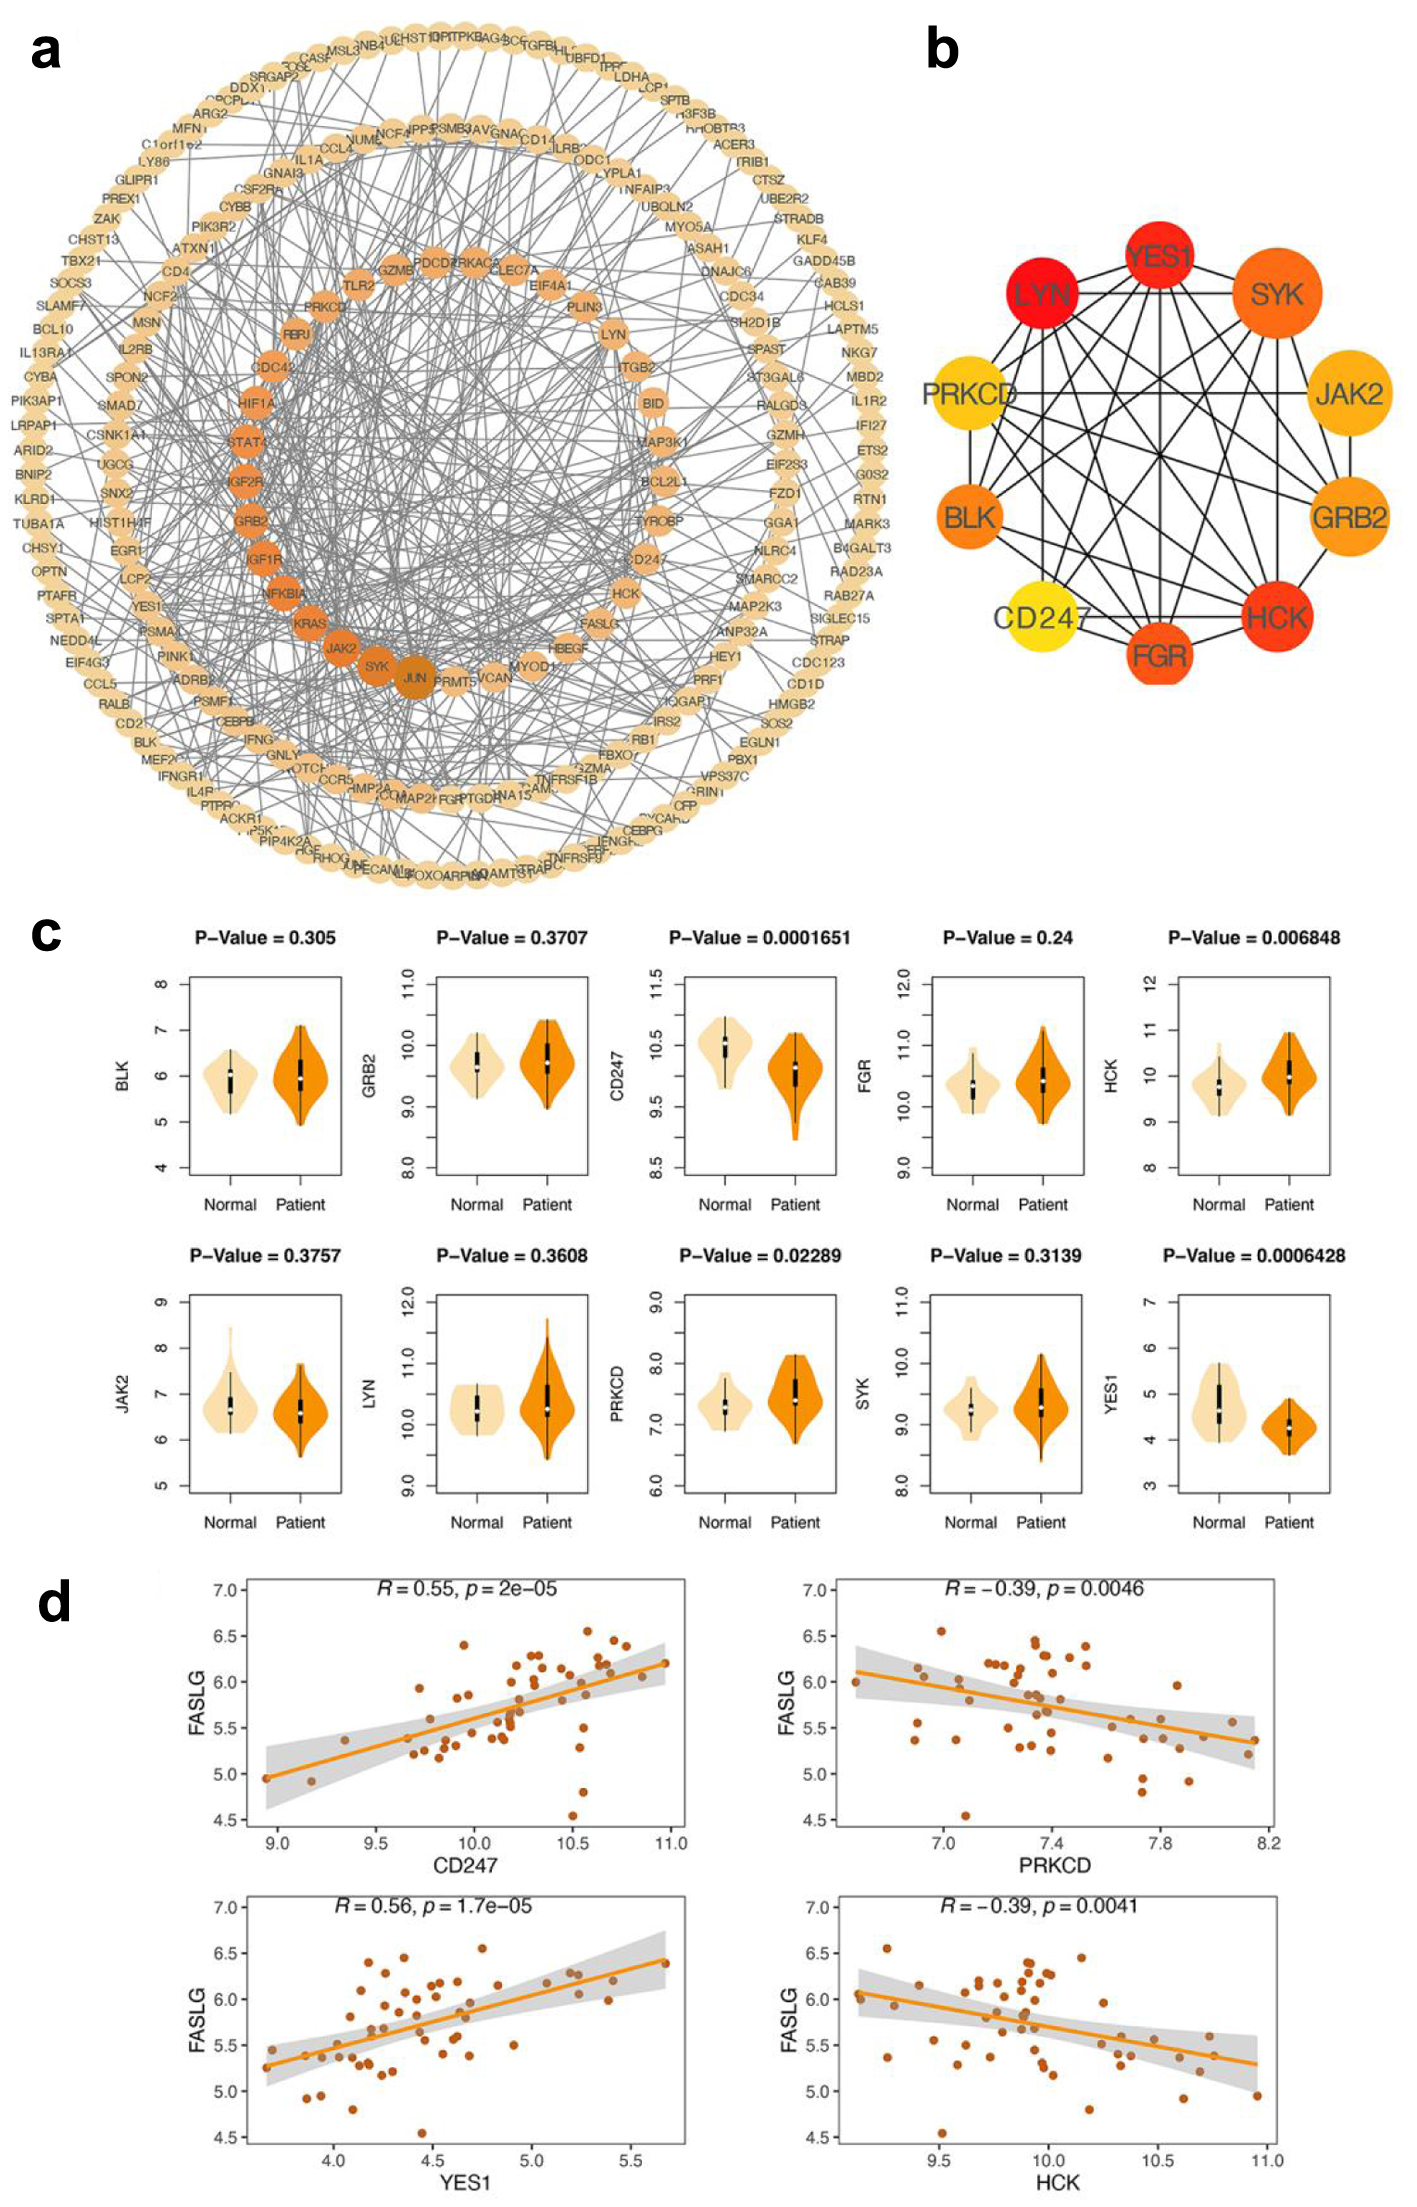
Figure 5. Construction of PPI network and identification of hub genes. (a) PPI network. The larger the diameter of the circle and deeper the color, the greater its mesoscopic centrality indicated, which has a central position in the network. (b) CytoHubba screens for 10 central genes. A deeper color represents a higher MCC score. Genes that tend to obtain high MCC scores are key genes associated with FASLG. (c) Examination of the differences in expression of 10 central genes in the AMI and normal groups. YES1, HCK, CD247 and PRKCD showed significant differences between the AMI and normal groups (their P values were less than 0.05) and were considered to be involved in the myocardial infarction process. (d) Correlation analysis of YES1, HCK, CD247, PRKCD, and FASLG. R-values closer to 1 indicate a stronger positive correlation and r-values closer to -1 indicate a stronger negative correlation. AMI: acute myocardial infarction; PPI: protein-protein interaction.
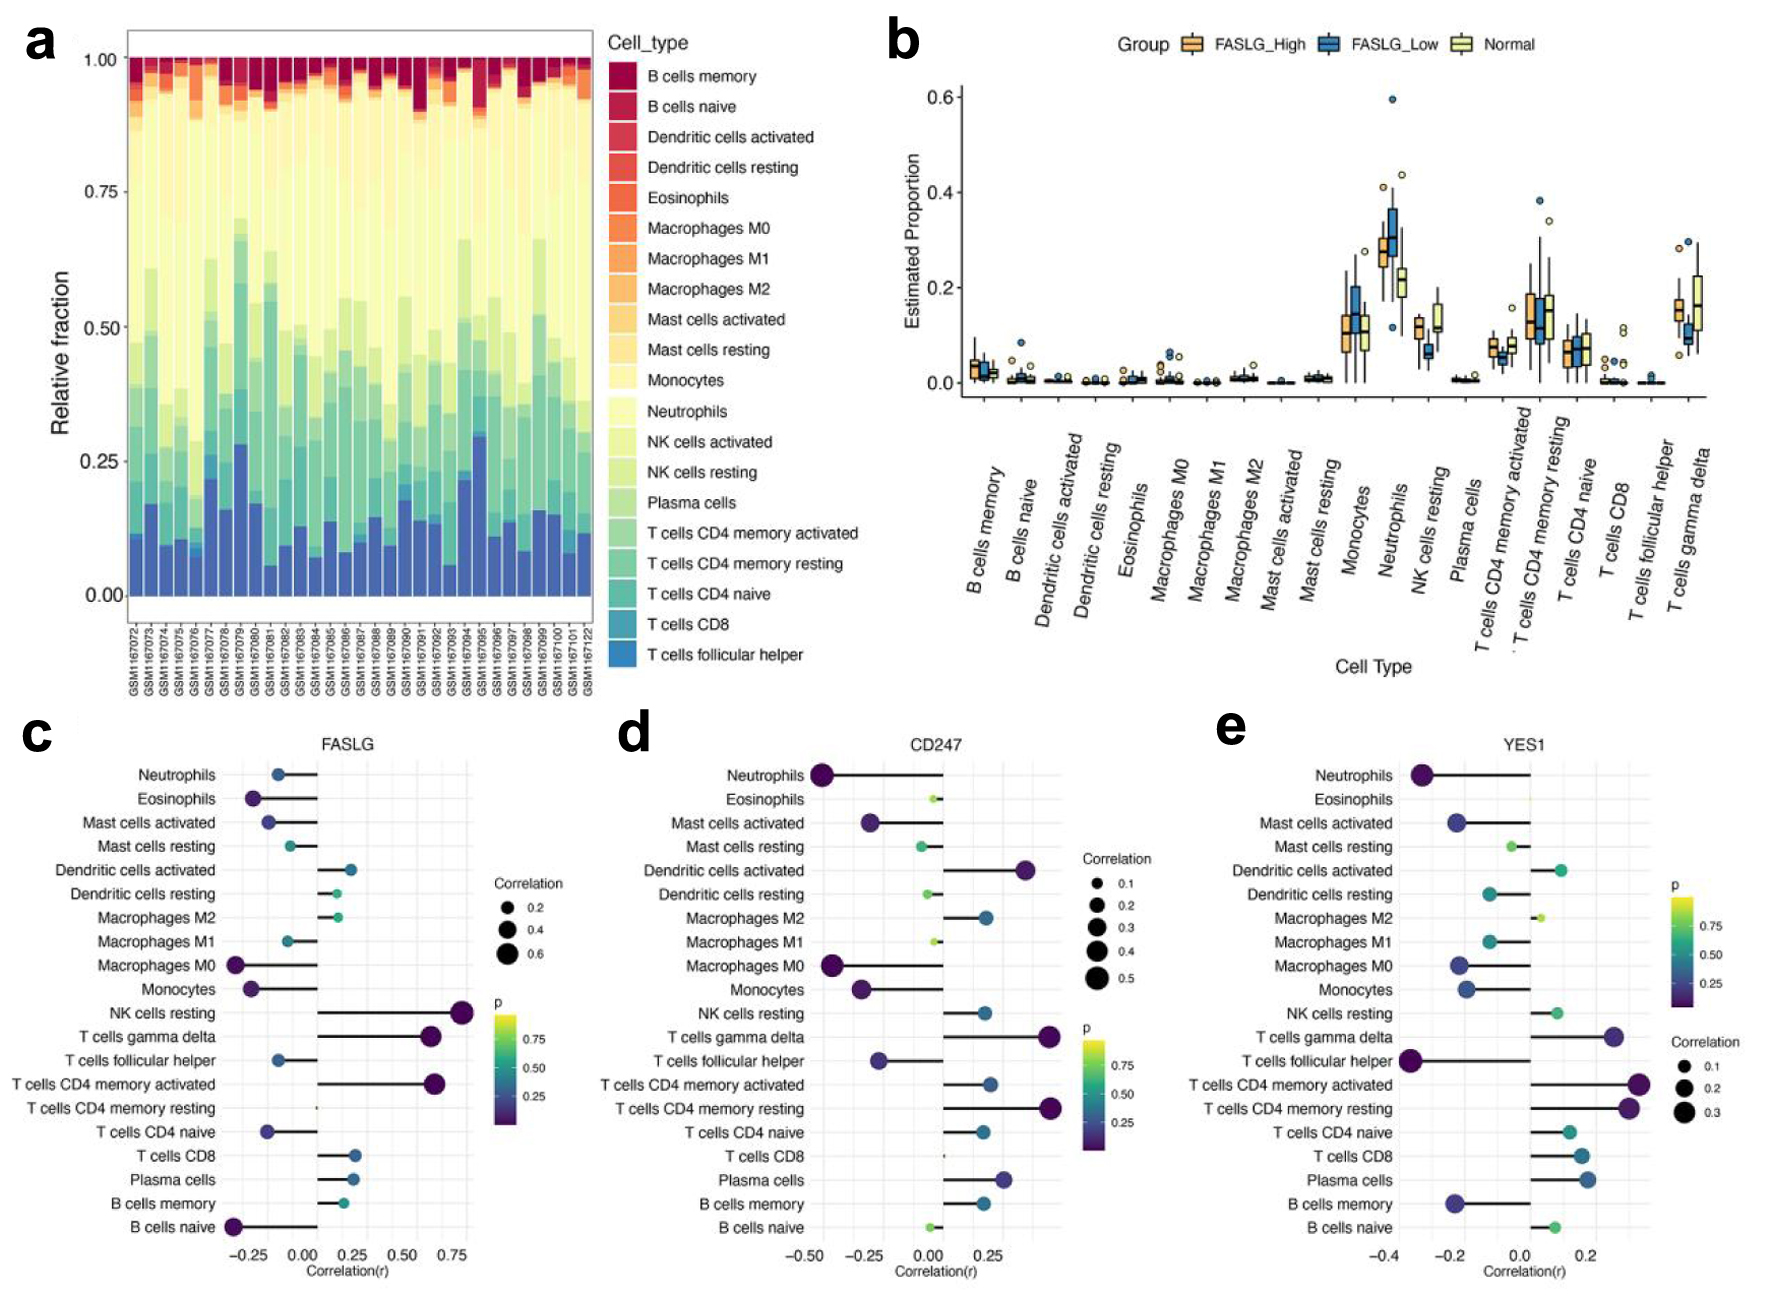
Figure 6. Analysis of immune cell infiltration assessment. (a) The box plot shows the relative percentages of different types of immune cells in all AMI samples. The horizontal axis shows the 31 AMI samples, and the length of each color block on the vertical axis indicates its percentage (0-1) of all immune cells. (b) Comparison of the proportion of various immune cell infiltrates in the FASLG high expression group, FASLG low expression group and normal group. (c-e) The correlations of FASLG, CD247, and YES1 with various immune cells were analyzed separately, and the larger circles and darker colors indicated their more obvious correlations. AMI: acute myocardial infarction.
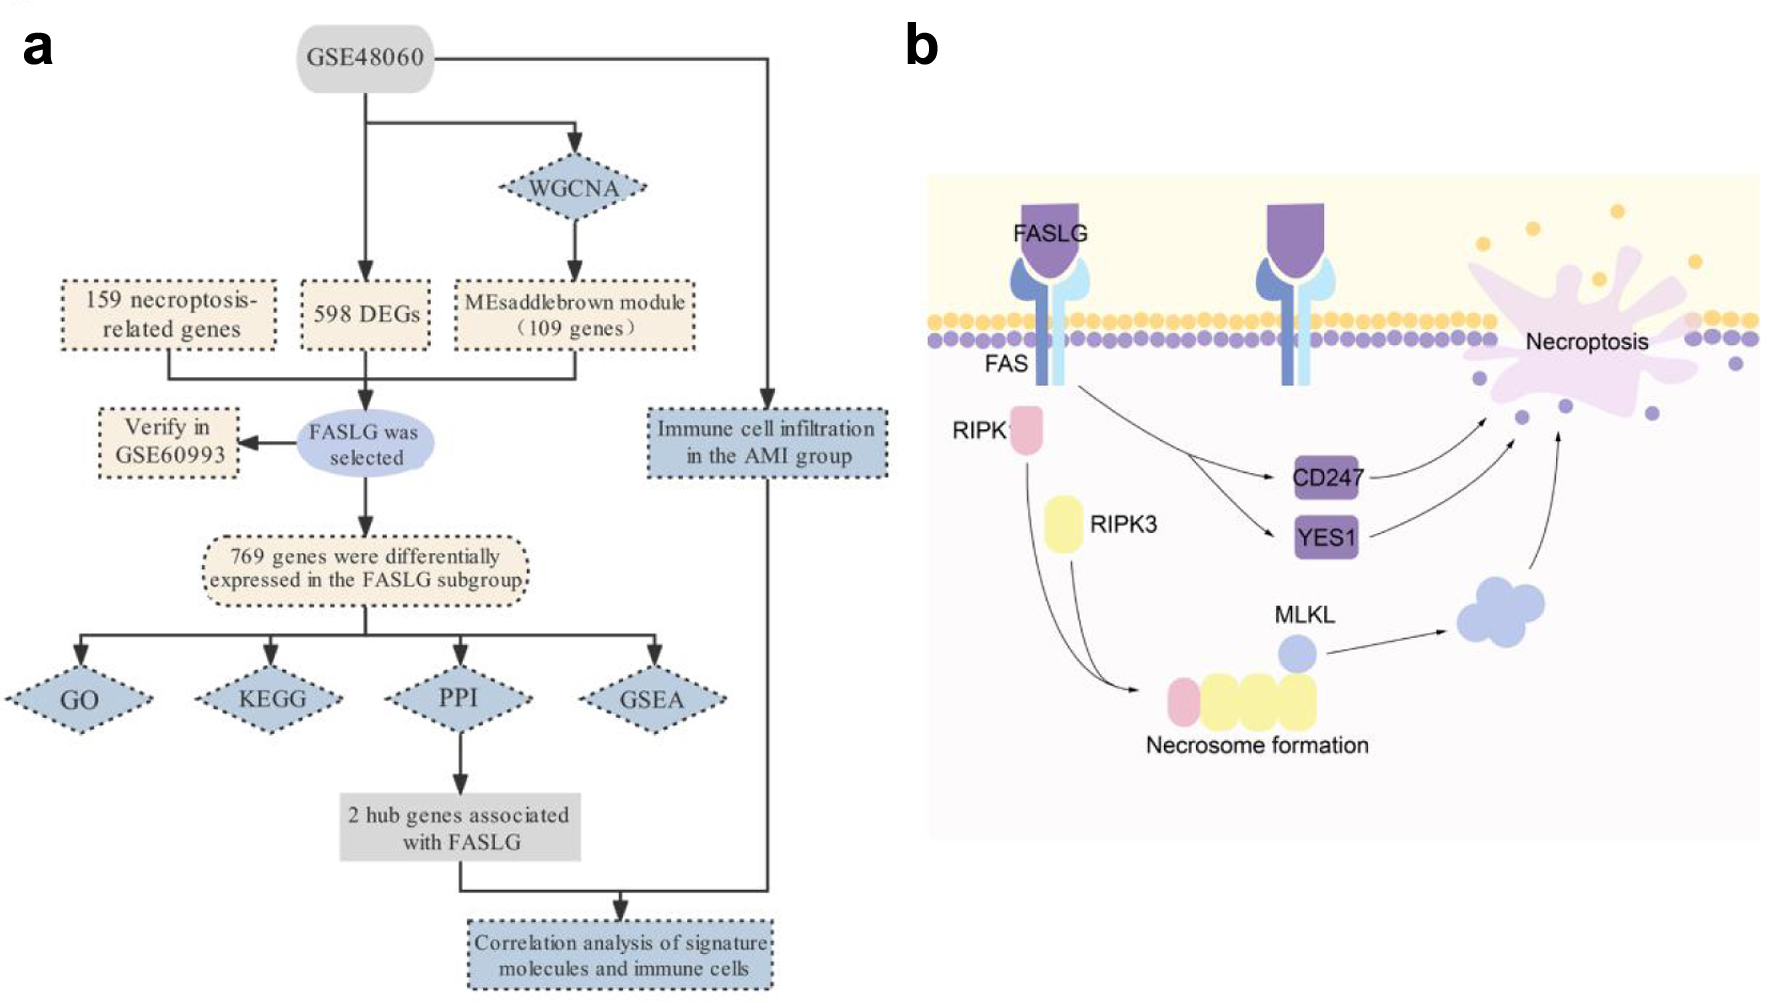
Figure 7. Schematic diagram of the workflow (a) and mechanism (b) of this study.