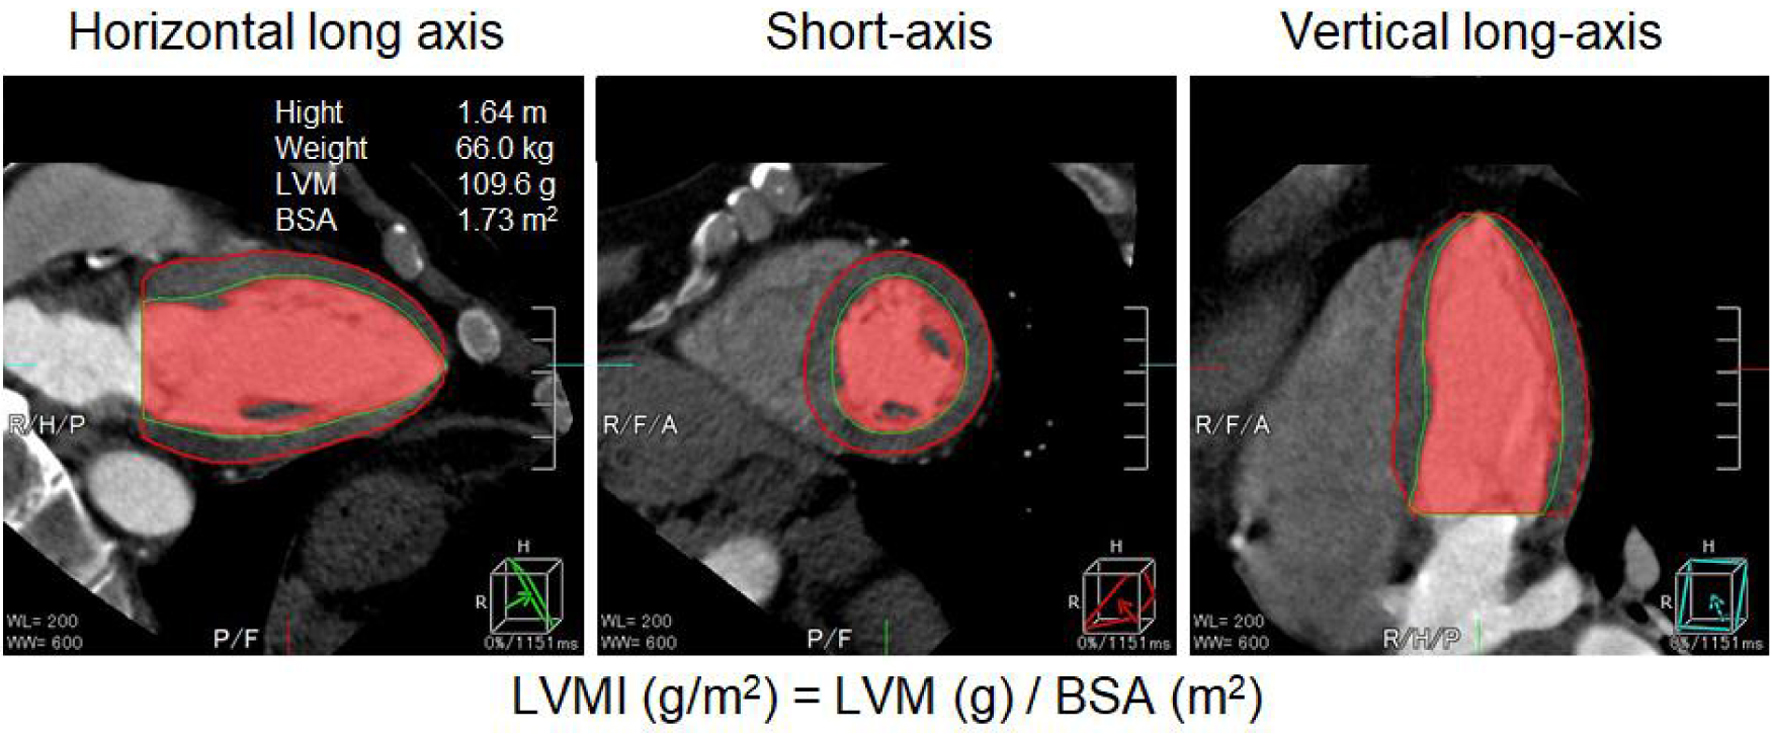
Figure 1. LVMI was calculated by dividing the LVM by the BSA of the patient. LVMI: left ventricular volume index; BSA: body surface area.
| Cardiology Research, ISSN 1923-2829 print, 1923-2837 online, Open Access |
| Article copyright, the authors; Journal compilation copyright, Cardiol Res and Elmer Press Inc |
| Journal website https://www.cardiologyres.org |
Original Article
Volume 15, Number 3, June 2024, pages 134-143
Association Between Major Adverse Cardiovascular Events and Left Ventricular Mass Index in Patients Who Have Undergone Coronary Computed Tomography Angiography: From the FU-CCTA Registry
Figures
Tables
| All patients (n = 520) | Non-MACEs group (n = 478) | MACEs group (n = 42) | P-value (non-MACEs vs. MACEs group) | |
|---|---|---|---|---|
| Continuous variables are expressed as mean ± SD. α-GI: α-glucosidase inhibitor; ACEi/ARB: angiotensin-converting-enzyme inhibitor/angiotensin II receptor blocker; BMI: body mass index; CAC: coronary artery calcium; CAD: coronary artery disease; CCB: calcium channel blocker; DBP: diastolic blood pressure; DL: dyslipidemia; DPP-4i: dipeptidyl peptidase-4 inhibitor; DU: diuretic; eGFR: estimated glomerular filtration rate; EPA: eicosapentaenoic acid; FBG: fasting blood glucose; HbA1c: hemoglobin A1c; HDL-C: high-density lipoprotein cholesterol; LDL-C: low-density lipoprotein cholesterol; L/H: a ratio of LDL-C to HDL-C; MACEs: major adverse cardiovascular events; Non-HDL-C: total cholesterol minus HDL-C; SBP: systolic blood pressure; SU: sulfonylurea; TG: triglyceride; VD: vessel disease. | ||||
| Age (years) | 66 ± 11 | 66 ± 11 | 69 ± 11 | 0.107 |
| Gender (male), % | 50.2 | 48.1 | 73.8 | 0.001 |
| BMI, kg/m2 | 23.9 ± 3.6 | 23.9 ± 3.6 | 23.3 ± 3.7 | 0.231 |
| Family history of CAD, % | 22.9 | 23.4 | 16.7 | 0.318 |
| Smoking, % | 37.5 | 35.8 | 57.1 | 0.006 |
| Hypertension, % | 68.8 | 68 | 78.6 | 0.156 |
| SBP, mm Hg | 136 ± 20 | 135 ± 20 | 139 ± 22 | 0.205 |
| DBP, mm Hg | 77 ± 13 | 77 ± 13 | 76 ± 14 | 0.68 |
| DM, % | 23.8 | 23.4 | 28.6 | 0.456 |
| HbA1c, % | 6.02 ±1.09 | 6.01 ± 1.06 | 6.11 ± 1.47 | 0.56 |
| FBG, mg/dL | 111 ± 3 5 | 110 ± 35 | 116 ± 31 | 0.289 |
| Dyslipidemia, % | 59.8 | 60 | 57 | 0.71 |
| TG, mg/dL | 134 ± 94 | 133 ± 94 | 139 ± 97 | 0.72 |
| HDL-C, mg/dL | 55 ± 15 | 56 ± 15 | 52 ± 18 | 0.116 |
| LDL-C, mg/dL | 113 ± 32 | 113 ± 32 | 111 ± 35 | 0.638 |
| L/H | 2.19 | 2.17 | 2.36 | 0.174 |
| Non-HDL-C, mg/dL | 142 ± 39 | 143 ± 38 | 135 ± 48 | 0.199 |
| Chronic kidney disease, % | 29.8 | 28.7 | 42.9 | 0.054 |
| eGFR, L/min/1.73 m2 | 67.7 ± 16.2 | 68 ± 16.3 | 63.9 ± 15.3 | 0.112 |
| Metabolic syndrome, % | 35.2 | 46.3 | 0.155 | |
| CAD, % | 55.2 | 53.3 | 76.2 | 0.004 |
| VD | 1.01 ± 1.08 | 0.958 ± 1.05 | 1.64 ± 1.19 | < 0.001 |
| CAC score | 261 ± 724 | 218 ± 585 | 750 ± 1,545 | < 0.001 |
| Gensini score | 12.3 ± 15.8 | 11.1 ± 12.8 | 26.5 ± 32.5 | < 0.001 |
| Medications | ||||
| ARB/ACEi, % | 40 | 39.1 | 38.1 | 0.168 |
| CCB, % | 38.3 | 38.3 | 38.1 | 0.981 |
| β-blocker, % | 11 | 11.3 | 7.1 | 0.41 |
| DU, % | 10.8 | 10.9 | 9.5 | 0.786 |
| Statin, % | 34.8 | 35.1 | 31 | 0.585 |
| EPA, % | 3.3 | 3.3 | 2.4 | 0.736 |
| SU, % | 10.2 | 9.4 | 19 | 0.063 |
| α-GI, % | 3.5 | 3.6 | 2.4 | 0.69 |
| Biguanide, % | 7.7 | 7.5 | 9.5 | 0.643 |
| Thiazolizine, % | 2.3 | 2.3 | 2.4 | 0.974 |
| Insulin, % | 4.2 | 4.2 | 4.8 | 0.856 |
| DPP-4i, % | 11.3 | 10.9 | 16.7 | 0.258 |
| Non-MACEs group (n = 230) | MACEs group (n = 31) | P-value (non-MACEs vs. MACEs group) | |
|---|---|---|---|
| Continuous variables are expressed as mean ± SD. BMI: body mass index; CAD: coronary artery disease; DBP: diastolic blood pressure; eGFR: estimated glomerular filtration rate; FBG: fasting blood glucose; HbA1c: hemoglobin A1c; HDL-C: high-density lipoprotein cholesterol; LDL-C: low-density lipoprotein cholesterol; L/H: a ratio of LDL-C to HDL-C; MACEs: major adverse cardiovascular events; Non-HDL-C: total cholesterol minus HDL-C; SBP: systolic blood pressure; TG: triglyceride; . | |||
| Age, years | 63 ± 12 | 68 ± 13 | 0.028 |
| BMI, kg/m2 | 24.2 ± 3.4 | 22.9 ± 3.0 | 0.042 |
| Family history of CAD, % | 21 | 9 | 0.141 |
| Smoking, % | 60.9 | 64.5 | 0.697 |
| Hypertension, % | 68.3 | 74.2 | 0.505 |
| SBP, mm Hg | 137 ± 19 | 139 ± 17 | 0.681 |
| DBP, mm Hg | 80 ± 12 | 76 ± 10 | 0.117 |
| Diabetes mellitus, % | 31.3 | 29 | 0.798 |
| HbA1c, % | 6.1 ± 1.2 | 6.2 ± 1.0 | 0.92 |
| FBG, mg/dL | 115 ± 37 | 115 ± 30 | 0.995 |
| Dyslipidemia, % | 60 | 54.8 | 0.585 |
| TG, mg/dL | 146 ± 118 | 140 ± 83 | 0.774 |
| HDL-C, mg/dL | 52 ± 14 | 55 ± 18 | 0.656 |
| LDL-C, mg/dL | 106 ± 28 | 114 ± 36 | 0.342 |
| L/H | 2.23 ± 0.79 | 2.50 ± 1.16 | 0.095 |
| Non-HDL-C, mg/dL | 137 ± 38 | 140 ± 41 | 0.743 |
| Non-MACEs group (n = 248) | MACEs group (n = 11) | P-value (non-MACEs vs. MACEs group) | |
|---|---|---|---|
| Continuous variables are expressed as mean ± SD. BMI: body mass index; CAD: coronary artery disease; DBP: diastolic blood pressure; eGFR: estimated glomerular filtration rate; FBG: fasting blood glucose; HbA1c: hemoglobin A1c; HDL-C: high-density lipoprotein cholesterol; LDL-C: low-density lipoprotein cholesterol; L/H: a ratio of LDL-C to HDL-C; MACEs: major adverse cardiovascular events; Non-HDL-C: total cholesterol minus HDL-C; SBP: systolic blood pressure; TG: triglyceride. | |||
| Age, years | 68 ± 10 | 70 ± 6 | 0.64 |
| BMI, kg/m2 | 23.6 ± 3.7 | 24.3 ± 5.2 | 0.627 |
| Family history of CAD, % | 25.8 | 36.4 | 0.438 |
| Smoking, % | 12.5 | 36.4 | 0.028 |
| Hypertension, % | 67.7 | 90.9 | 0.106 |
| SBP, mm Hg | 134 ± 20 | 142 ± 32 | 0.212 |
| DBP, mm Hg | 74 ± 12 | 76 ± 21 | 0.678 |
| Diabetes mellitus, % | 16.1 | 27.3 | 0.333 |
| HbA1c, % | 5.9 ± 0.9 | 6.0 ± 2.4 | 0.825 |
| FBG, mg/dL | 106 ± 33 | 120 ± 35 | 0.172 |
| Dyslipidemia, % | 60.1 | 63.6 | 0.814 |
| TG, mg/dL | 121 ± 62 | 135 ± 136 | 0.526 |
| HDL-C, mg/dL | 52 ± 14 | 51 ± 18 | 0.656 |
| LDL-C, mg/dL | 117 ± 34 | 101 ± 31 | 0.12 |
| L/H | 2.12 ± 0.85 | 1.94 ± 0.56 | 0.495 |
| Non-HDL-C, mg/dL | 147 ± 37 | 119 ± 63 | 0.017 |
| Univariate analyses | Multivariate analyses | |||||
|---|---|---|---|---|---|---|
| Odds ratio | 95% CI | P-value | Odds ratio | 95% CI | P-value | |
| BMI: body mass index; CAD: coronary artery disease; LVMI: left ventricular mass index; MACEs: major adverse cardiovascular events. | ||||||
| All patients | ||||||
| Age | 1.03 | 0.994 - 1.06 | 0.107 | 1.25 | 0.988 - 1.064 | 0.185 |
| Male | 3.04 | 1.49 - 6.19 | 0.002 | 2.457 | 1.048 - 5.762 | 0.039 |
| BMI | 0.944 | 0.859 - 1.04 | 0.23 | 0.94 | 0.845 - 1.046 | 0.255 |
| Hypertension | 1.73 | 0.806 - 3.7 | 0.16 | 1.435 | 0.639 - 3.226 | 0.382 |
| Dyslipidemia | 0.887 | 0.469 - 1.68 | 0.713 | 0.874 | 0.446 - 1.713 | 0.695 |
| Diabetes mellitus | 1.31 | 0.648 - 2.64 | 0.455 | 1.069 | 0.507 - 2.253 | 0.862 |
| Family history of CAD | 0.654 | 0.283 - 1.51 | 0.32 | 0.762 | 0.32 - 1.811 | 0.538 |
| Smoking | 2.39 | 1.26 - 4.54 | 0.007 | 1.54 | 0.72 - 2.253 | 0.266 |
| Chronic kidney disease | 1.87 | 0.982 - 3.55 | 0.057 | 1.556 | 0.767 - 3.156 | 0.22 |
| LVMI | 1.01 | 1.00 - 1.02 | 0.024 | 1.011 | 0.999 - 1.022 | 0.072 |
| Males | ||||||
| Age | 1.04 | 1.00 - 1.08 | 0.029 | 1.025 | 0.981 - 1.071 | 0.268 |
| BMI | 0.868 | 0.757 - 0.995 | 0.042 | 0.898 | 0.756 - 1.02 | 0.089 |
| Hypertension | 1.34 | 0.571 - 3.13 | 0.504 | 1.121 | 0.443 - 2.835 | 0.809 |
| Dyslipidemia | 0.81 | 0.381 - 1.72 | 0.583 | 0.976 | 0.433 - 2.201 | 0.954 |
| Diabetes mellitus | 0.898 | 0.394 - 2.05 | 0.797 | 0.899 | 0.379 - 2.131 | 0.808 |
| Smoking | 1.17 | 0.535 - 2.55 | 0.696 | 1.03 | 0.444 - 2.391 | 0.945 |
| Family history of CAD | 0.406 | 0.118 - 1.39 | 0.152 | 0.436 | 0.122 - 1.557 | 0.201 |
| Chronic kidney disease | 2.09 | 0.967 - 4.53 | 0.061 | 1.802 | 0.753 - 4.309 | 0.186 |
| LVMI | 1.02 | 1.00 - 1.03 | 0.057 | 1.018 | 1.002 - 1.035 | 0.03 |
| Females | ||||||
| Age | 1.02 | 0.951 - 1.08 | 0.64 | 1.019 | 0.948 - 1.095 | 0.673 |
| BMI | 1.04 | 0.891 - 1.22 | 0.616 | 1.032 | 0.865 - 1.232 | 0.724 |
| Hypertension | 4.76 | 0.599 - 37.8 | 0.14 | 3.981 | 0.456 - 34.74 | 0.211 |
| Dyslipidemia | 1.16 | 0.332 - 4.08 | 0.814 | 0.775 | 0.199 - 3.009 | 0.712 |
| Diabetes mellitus | 1.95 | 0.496 - 7.67 | 0.339 | 1.862 | 0.425 - 8.166 | 0.41 |
| Smoking | 4 | 1.11 - 14.5 | 0.035 | 4.68 | 1.173 - 18.68 | 0.029 |
| Family history of CAD | 1.64 | 0.466 - 5.80 | 0.44 | 1.275 | 0.324 - 5.008 | 0.728 |
| Chronic kidney disease | 1.82 | 0.538 - 6.13 | 0.336 | 1.477 | 0.387 - 5.633 | 0.568 |
| LVMI | 1 | 0.981 - 1.03 | 0.789 | 1.062 | 0.977 - 1.028 | 0.867 |