Cardiology Research, ISSN 1923-2829 print, 1923-2837 online, Open Access
Article copyright, the authors; Journal compilation copyright, Cardiol Res and Elmer Press Inc
Journal website https://www.cardiologyres.org

Short Communication

Volume 15, Number 3, June 2024, pages 198-204


Is Type 2 Diabetes Mellitus an Independent Risk Factor for Mortality in Hypertrophic Cardiomyopathy?

Figure

Figure 1.
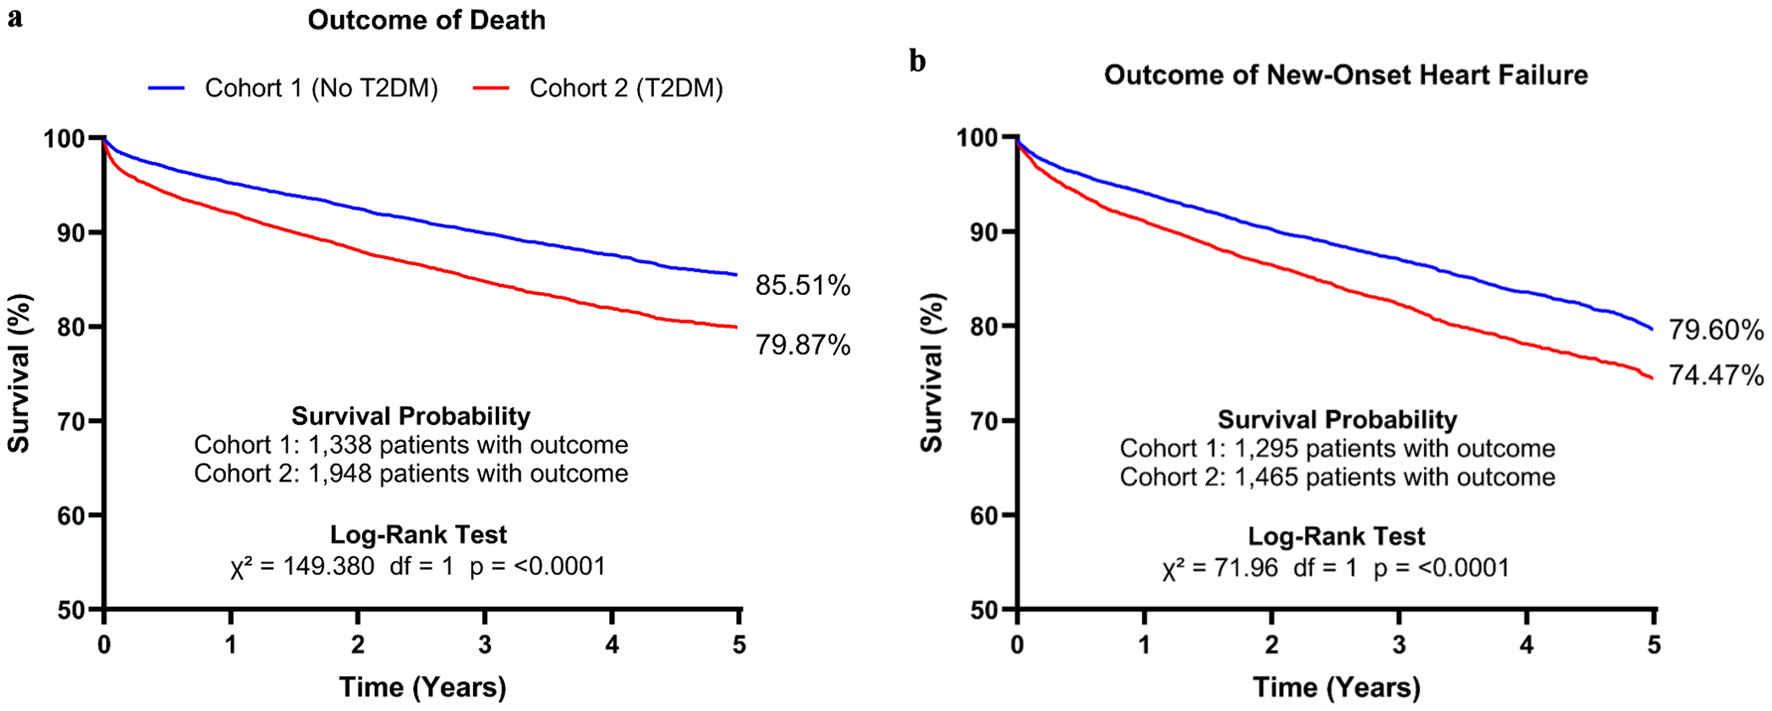
Figure 1. Kaplan-Meier survival curve analysis and log-rank test against the outcome of death (a) for cohort 1 and cohort 2 over the course of 5 years after the index event. Analyses were also conducted against the outcome of heart failure over the same period (b). T2DM: type 2 diabetes mellitus.

Tables

Table 1. Baseline Characteristics After Propensity Score Matching
 
CharacteristicCohort 1 (no T2DM)Cohort 2 (T2DM)P valueStandardized mean difference
SCD: sudden cardiac death; T2DM: type 2 diabetes mellitus; LVEF: left ventricular ejection fraction; CAD: coronary artery disease; COPD: chronic obstructive pulmonary disease; BMI: body mass index; CKD: chronic kidney disease; ESRD: end-stage renal disease; Afib: atrial fibrillation; Vfib: ventricular fibrillation; HLD: hyperlipidemia; HTN: hypertension; ICD: implantable cardioverter-defibrillator device; ACEI: angiotensin-converting enzyme inhibitors; ARBs: angiotensin II receptor blockers; BP: blood pressure; BNP: B-type natriuretic peptide; BP: blood pressure; LA: left atrium.
Age, years64 ± 1562 ± 14< 0.00010.1027
Sex
  Female (%)48.61%48.53%0.88700.0084
  Male (%)48.32%48.46%0.81280.0017
Medical history
  COPD14.21%14.46%0.55450.0070
  HTN73.61%73.56%0.92520.0011
  Family history of SCD0.40%0.41%0.85240.0022
  Syncope12.97%12.82%0.71080.0044
  CAD28.11%28.14%0.95800.0006
  Smoking18.37%18.67%0.51250.0078
  CKD19.84%20.48%0.17950.0159
  Afib/flutter18.57%18.58%0.97570.0004
  ESRD2.81%2.90%0.64410.0055
  HLD54.72%55.34%0.28970.0125
  Presence of ICD5.13%5.09%0.87190.0019
  Pulmonary HTN5.22%5.28%0.81130.0028
  VT7.12%7.07%0.89000.0016
  Vfib0.99%0.97%0.85680.0021
Procedures
  Cardiac valve surgery0.64%0.62%0.82299210.002647458
Medications
  Anticoagulants42.20%43.06%0.14110.0174
  Beta blockers55.49%56.17%0.24290.0138
  ACEI39.88%40.40%0.37170.0106
  ARBs24.22%24.10%0.81420.0028
  Antilipemic agents58.13%58.48%0.55650.0070
  Antiarrhythmics49.95%51.34%0.01910.0277
  Platelet inhibitors46.31%46.85%0.35480.0110
Results
  Body mass index29.1 ± 6.732.1 ± 7.20.00890.0310
  Systolic BP133 ± 21133 ± 220.09210.0237
  LVEF (%)60.2 ± 12.259.5 ± 13.50.02240.0562
  BNP (pg/mL)
    < 10011.11%11.44%0.37920.0104
    ≥ 10012.23%12.36%0.73210.0041
  eGFR (mL/min)
    ≥ 9045.99%46.93%0.11190.0188
    60 - 8959.20%59.86%0.25210.0136
    15 - 5937.72%38.07%0.54190.0072
    < 155.21%5.23%0.93640.0009
  LA anteroposterior diameter14.3 ± 17.317.65 ± 18.560.71737010.004283972


Table 2. Outcome of Death
 
Cohort outcome statistics
Patients in cohortPatients with outcome (death)Risk
Cohort 114,2791,3389.37%
Cohort 214,2791,94813.64%
Measures of association
Risk difference95% CIz-scoreP value
Measures of association were conducted to evaluate the risk of death between cohort 1 (HCM without T2DM) and cohort 2 (HCM with T2DM) over the 5 years from the index event. Cohort statistics and risk difference, risk ratio, and odds ratio were calculated to interpret the statistical significance of the risk between cohort 1 and cohort 2. T2DM: type 2 diabetes mellitus; HCM: hypertrophic cardiomyopathy; CI: confidence interval.
-4.27%-5.011%, -3.533%-11.312< 0.0001
Risk ratio95% CIOdds ratio95% CI
0.6870.643, 0.7330.6540.608, 0.705


Table 3. Outcome of New-Onset Heart Failure
 
Cohort outcome statistics
Patients in cohortPatients with outcome (heart failure)Risk
Cohort 110,4741,29512.36%
Cohort 29,2461,46515.85%
Measures of association
Risk difference95% CIz-scoreP value
Measures of association were conducted to evaluate the risk of new-onset heart failure between cohort 1 (HCM without T2DM) and cohort 2 (HCM with T2DM) over the 5 years from the index event. Cohort statistics and risk difference, risk ratio, and odds ratio were calculated to interpret the statistical significance of the risk between cohort 1 and cohort 2. T2DM: type 2 diabetes mellitus; HCM: hypertrophic cardiomyopathy; CI: confidence interval.
-3.48%-4.456%, -2.505%-7.031< 0.0001
Risk ratio95% CIOdds ratio95% CI
0.7800.728, 0.8360.7490.691, 0.812