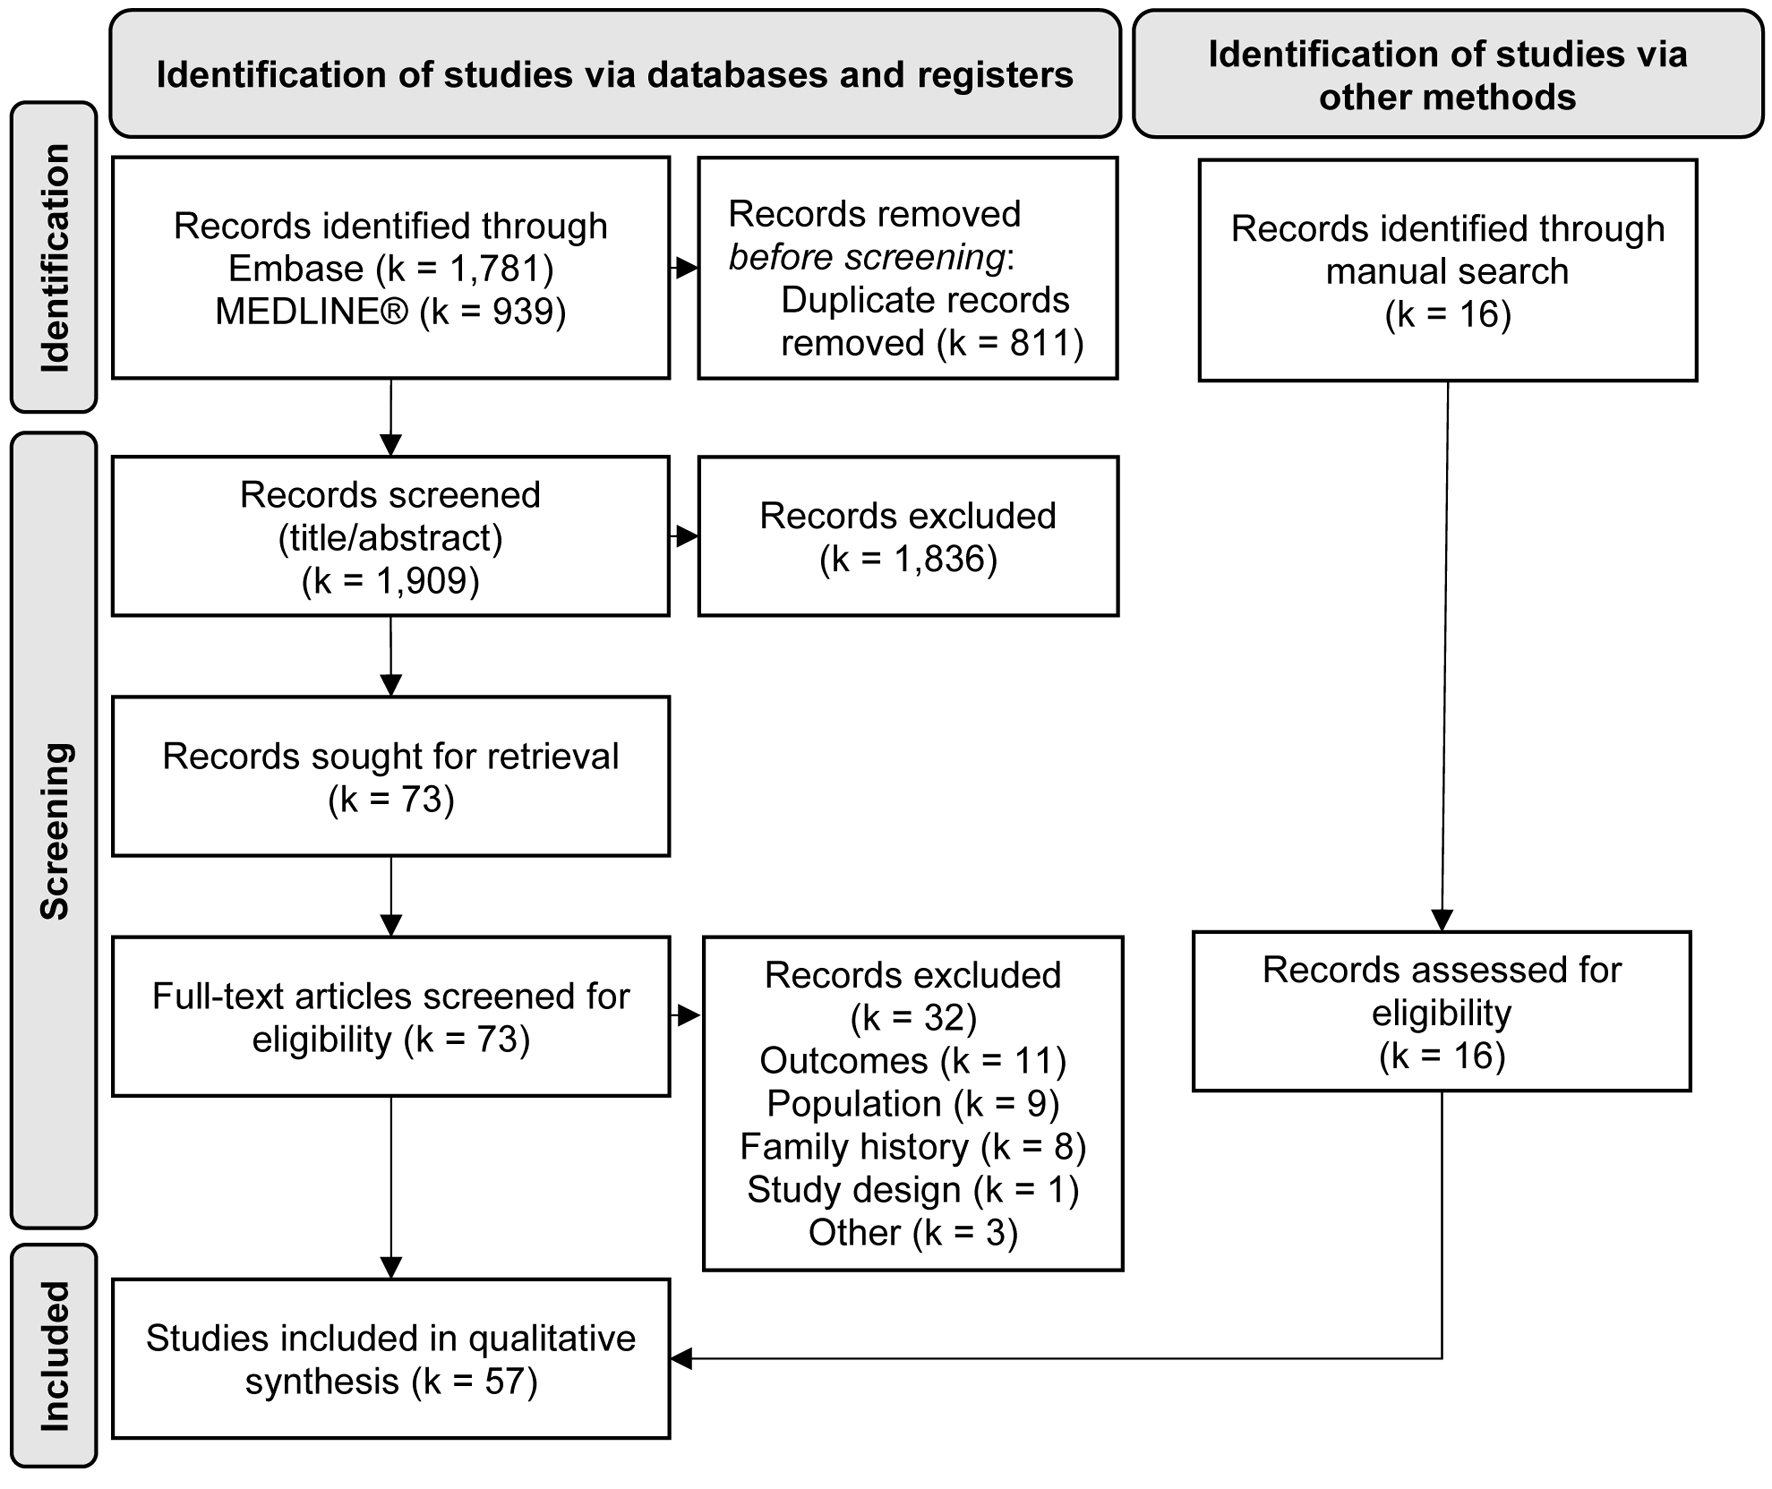
Figure 1. PRISMA flow diagram. k: number of records.
| Cardiology Research, ISSN 1923-2829 print, 1923-2837 online, Open Access |
| Article copyright, the authors; Journal compilation copyright, Cardiol Res and Elmer Press Inc |
| Journal website https://www.cardiologyres.org |
Original Article
Volume 15, Number 4, August 2024, pages 233-245
Prevalence of Genetically Associated Dilated Cardiomyopathy: A Systematic Literature Review and Meta-Analysis
Figures
Tables
| Group | Number of studies | Median prevalence (IQR)/weighted mean prevalencea (SD) | Median N (IQR)/total Nb | References |
|---|---|---|---|---|
| aPrevalence median and interquartile range were reported unless fewer than 10 studies were included in the calculation, in which case a weighted mean and weighted standard deviation were presented. bDCM median sample size and interquartile range were reported unless fewer than 10 studies were included in the calculation, in which case the total sample size or the individual studies’ DCM samples sizes were presented. cData from UK BioBank (general population n = 166,690, DCM n = 336, genetic DCM n = 48). dData from UK BioBank (general population n = 18,665, DCM n = not provided, genetic DCM n = 5). Data are stratified by region and the denominator of the calculation (genetic DCM within the DCM population or within the general population). DCM: dilated cardiomyopathy; IQR: interquartile range; PMBB: Penn Medicine BioBank cohort; USA: United States of America; SD: weighted standard deviation. | ||||
| Genetic DCM within the DCM population | ||||
| Overall genetic DCM | ||||
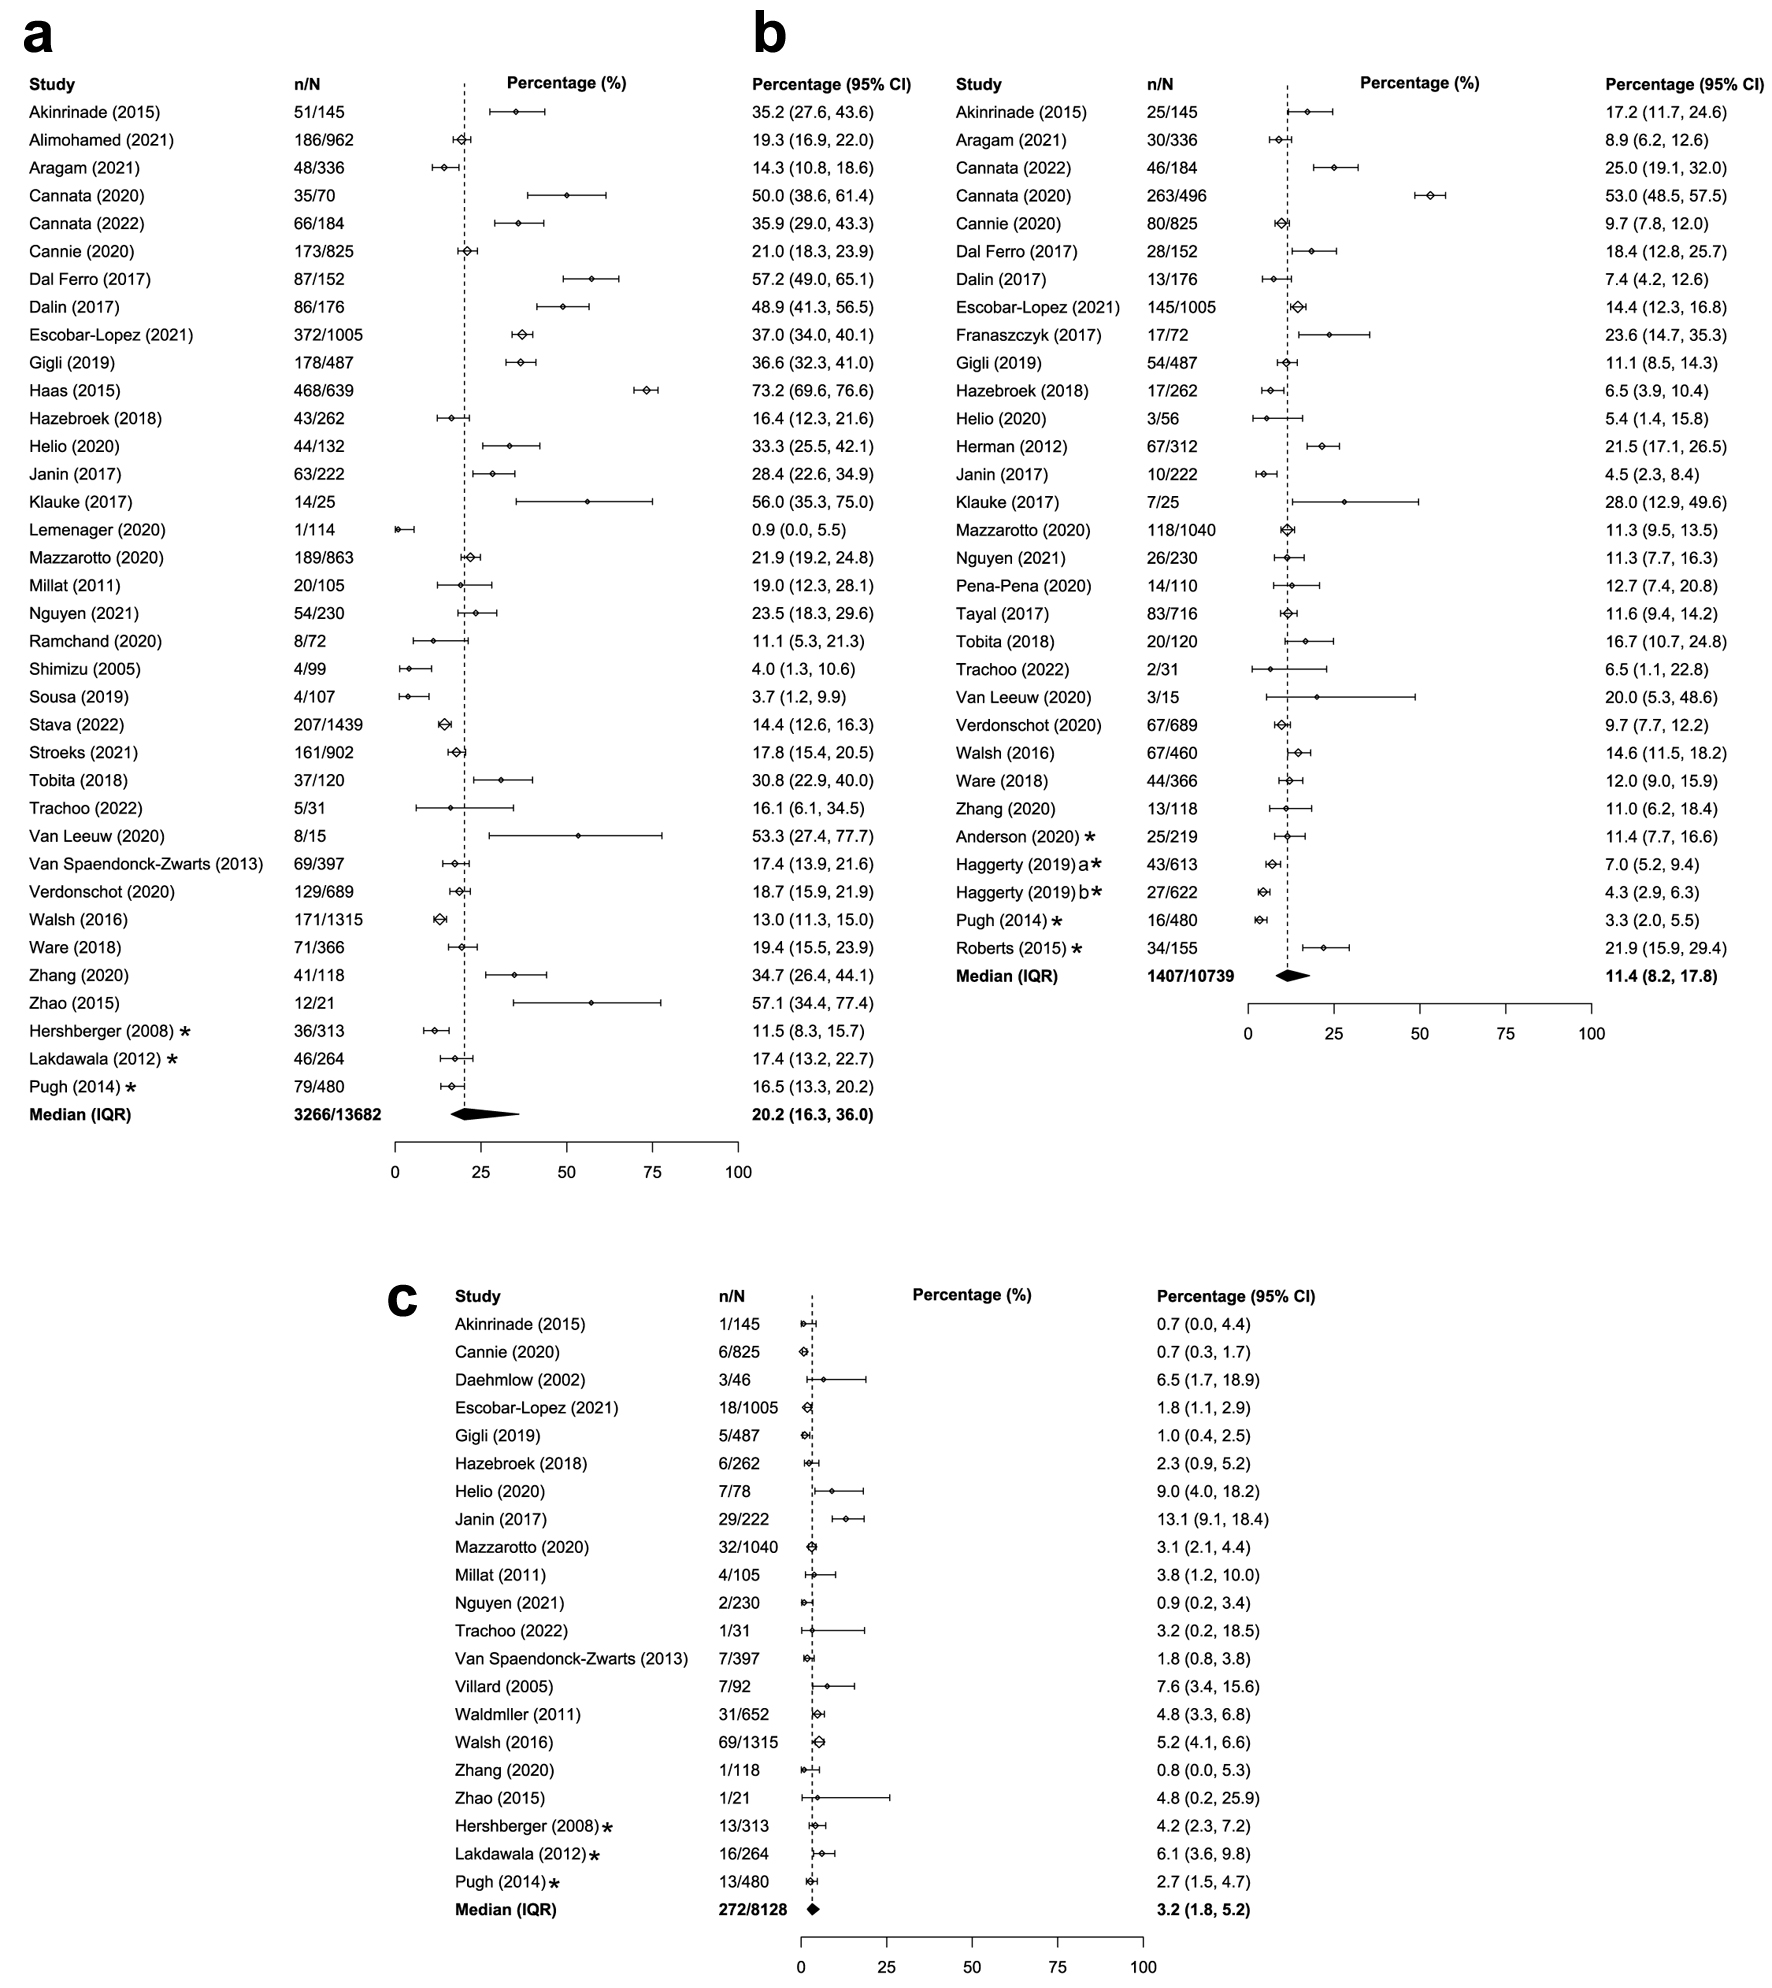
| Global | 36 | 20.2% (16.3-36.0%) | 226 (112 - 525) | [22-26, 28-34, 36, 38, 40, 44, 45, 47, 50, 52-58, 60-70] |
| USA only | 3 | 15.2% (2.5) | 1,057 | [31, 34, 44] |
| TTN-associated DCM | ||||
| Global | 30 | 11.4% (8.2-17.8%) | 230 (133 - 492) | [12, 21-26, 28, 29, 32-36, 40, 41, 45, 49-53, 55-58, 60, 66, 69, 70] |
| USA only | 4 | 6.9% (4.9) | 2,089 | [21, 34, 41, 51] |
| MYH7-associated DCM | ||||
| Global | 21 | 3.2% (1.8-5.2%) | 262 (105 - 487) | [22-27, 29, 31, 32, 34, 37, 38, 43-45, 52, 53, 57, 61, 63, 69] |
| USA only | 3 | 4.0% (1.4) | 1,057 | [31, 34, 44] |
| Genetic DCM within the general population | ||||
| Overall genetic DCM | ||||
| UK only | 2 | 0.029% [40]c; 0.027% [39]d | 166,690 [40]c; 18,665 [39]d | [39, 40] |
| TTN-associated DCM | ||||
| USA only | 1 | Geisinger: 0.04%; PMBB: 0.42% | Geisinger: 92,455; PMBB: 10,289 | [41] |
| MYH7-associated DCM | - | - | - | - |
| Group | Number of studies | Weighted mean prevalence (SD)a | Total N | References |
|---|---|---|---|---|
| aWeighted mean prevalence and weighted standard deviation were reported unless fewer than three studies were included in the calculation, in which case individual study prevalence estimates were presented. DCM: dilated cardiomyopathy; USA: United States of America; SD: weighted standard deviation. | ||||
| Overall genetic DCM | ||||
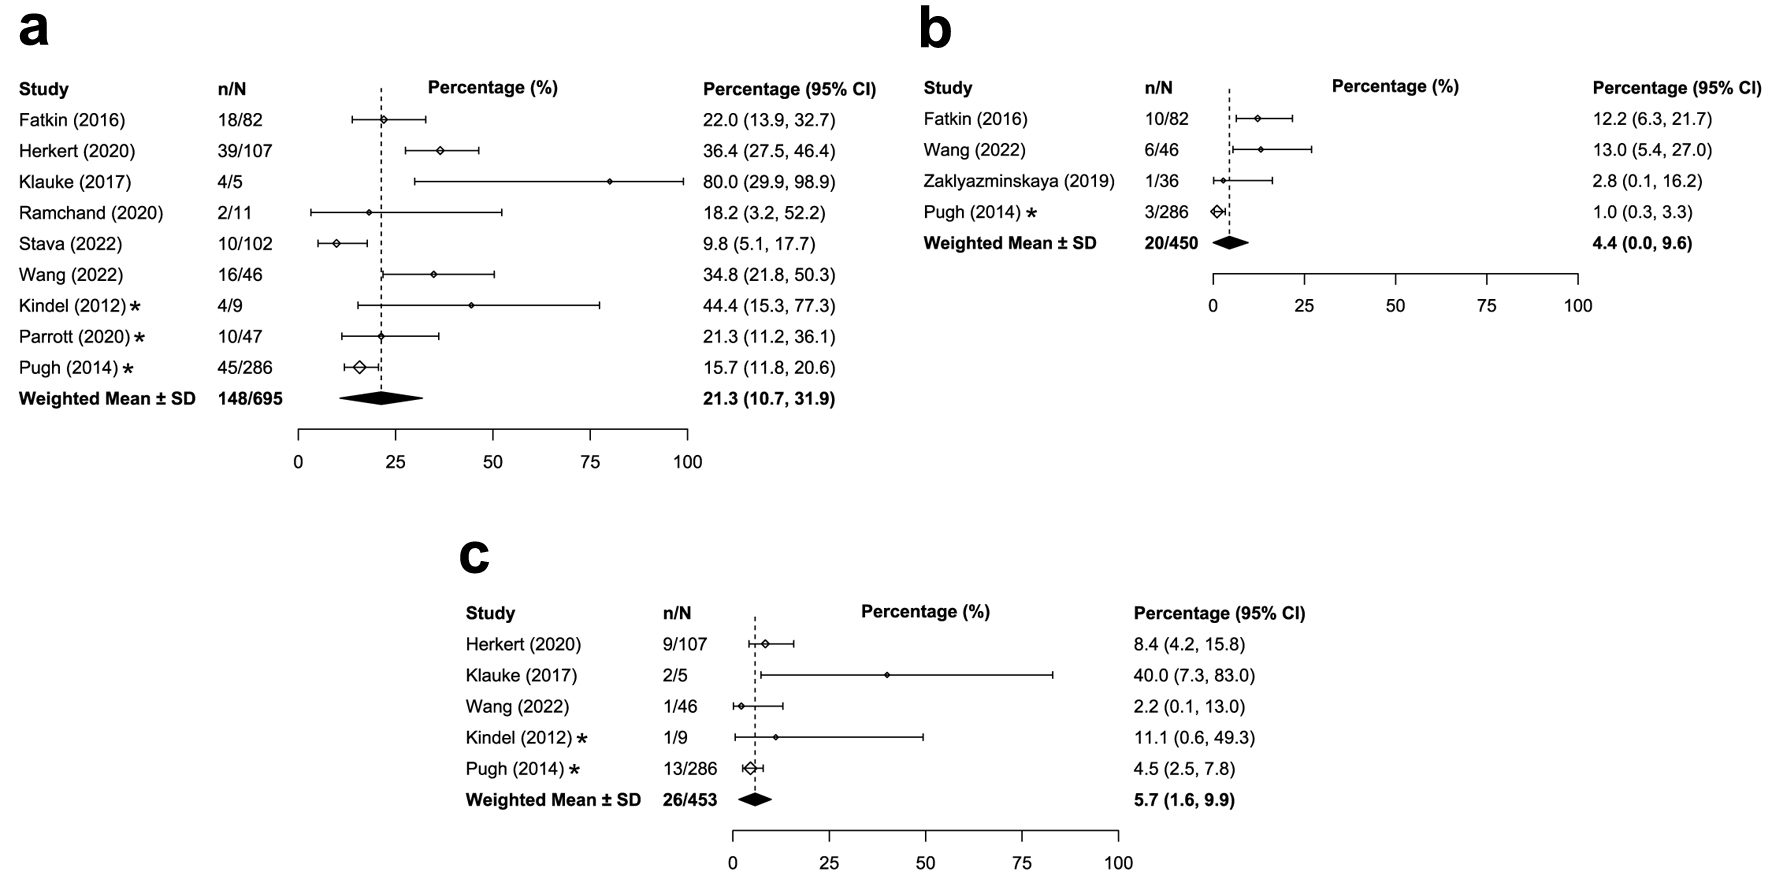
| Global | 9 | 21.3% (10.6) | 695 | [33, 34, 42, 54, 67, 71-74] |
| USA only | 3 | 17.3% (4.9) | 342 | [34, 73, 74] |
| TTN-associated DCM | ||||
| Global | 4 | 4.4% (5.1) | 450 | [34, 42, 71, 75] |
| USA only | 1 | 1.0% | 286 | [34] |
| MYH7-associated DCM | ||||
| Global | 5 | 5.7% (4.2) | 453 | [33, 34, 42, 72, 73] |
| USA only | 2 | 4.5% [34]; 11.1% [73] | 295 | [34, 73] |
| Group | Number of studies | Weighted mean (SD)a | Total Nb | References |
|---|---|---|---|---|
| aWeighted mean prevalence and weighted standard deviation were reported unless fewer than three studies were included in the calculation, in which case individual study prevalence estimates were presented. bTotal sample size was presented unless fewer than three studies were included in the calculation, in which case the individual studies’ samples sizes were presented. DCM: dilated cardiomyopathy; USA: United States of America; SD: weighted standard deviation. | ||||
| Overall genetic variants | ||||
| Global | 2 | 38.4% [60]; 2.7% [50] | 503 [60]; 445 [50] | [50, 60] |
| USA only | - | - | - | - |
| TTN variants | ||||
| Global | 6 | 0.9% (0.2) | 61,030 | [12, 21, 24, 25, 50, 60] |
| USA only | 1 | Healthy individuals: 2.9%; Women’s Health Initiative: 0.7% | Healthy individuals: 308; Women’s Health Initiative: 667 | [21] |
| MYH7 variants | ||||
| Global | 2 | 1.4% [25]; 1.4% [24] | 912 [25]; 60,471 [24] | [24, 25] |
| USA only | - | - | - | - |