Cardiology Research, ISSN 1923-2829 print, 1923-2837 online, Open Access
Article copyright, the authors; Journal compilation copyright, Cardiol Res and Elmer Press Inc
Journal website https://www.cardiologyres.org

Original Article

Volume 15, Number 4, August 2024, pages 253-261


Usefulness of Serum Testosterone Concentration and Skin Autofluorescence as Coronary Risk Markers in Male Patients With Type 2 Diabetes Mellitus

Figures

Figure 1.
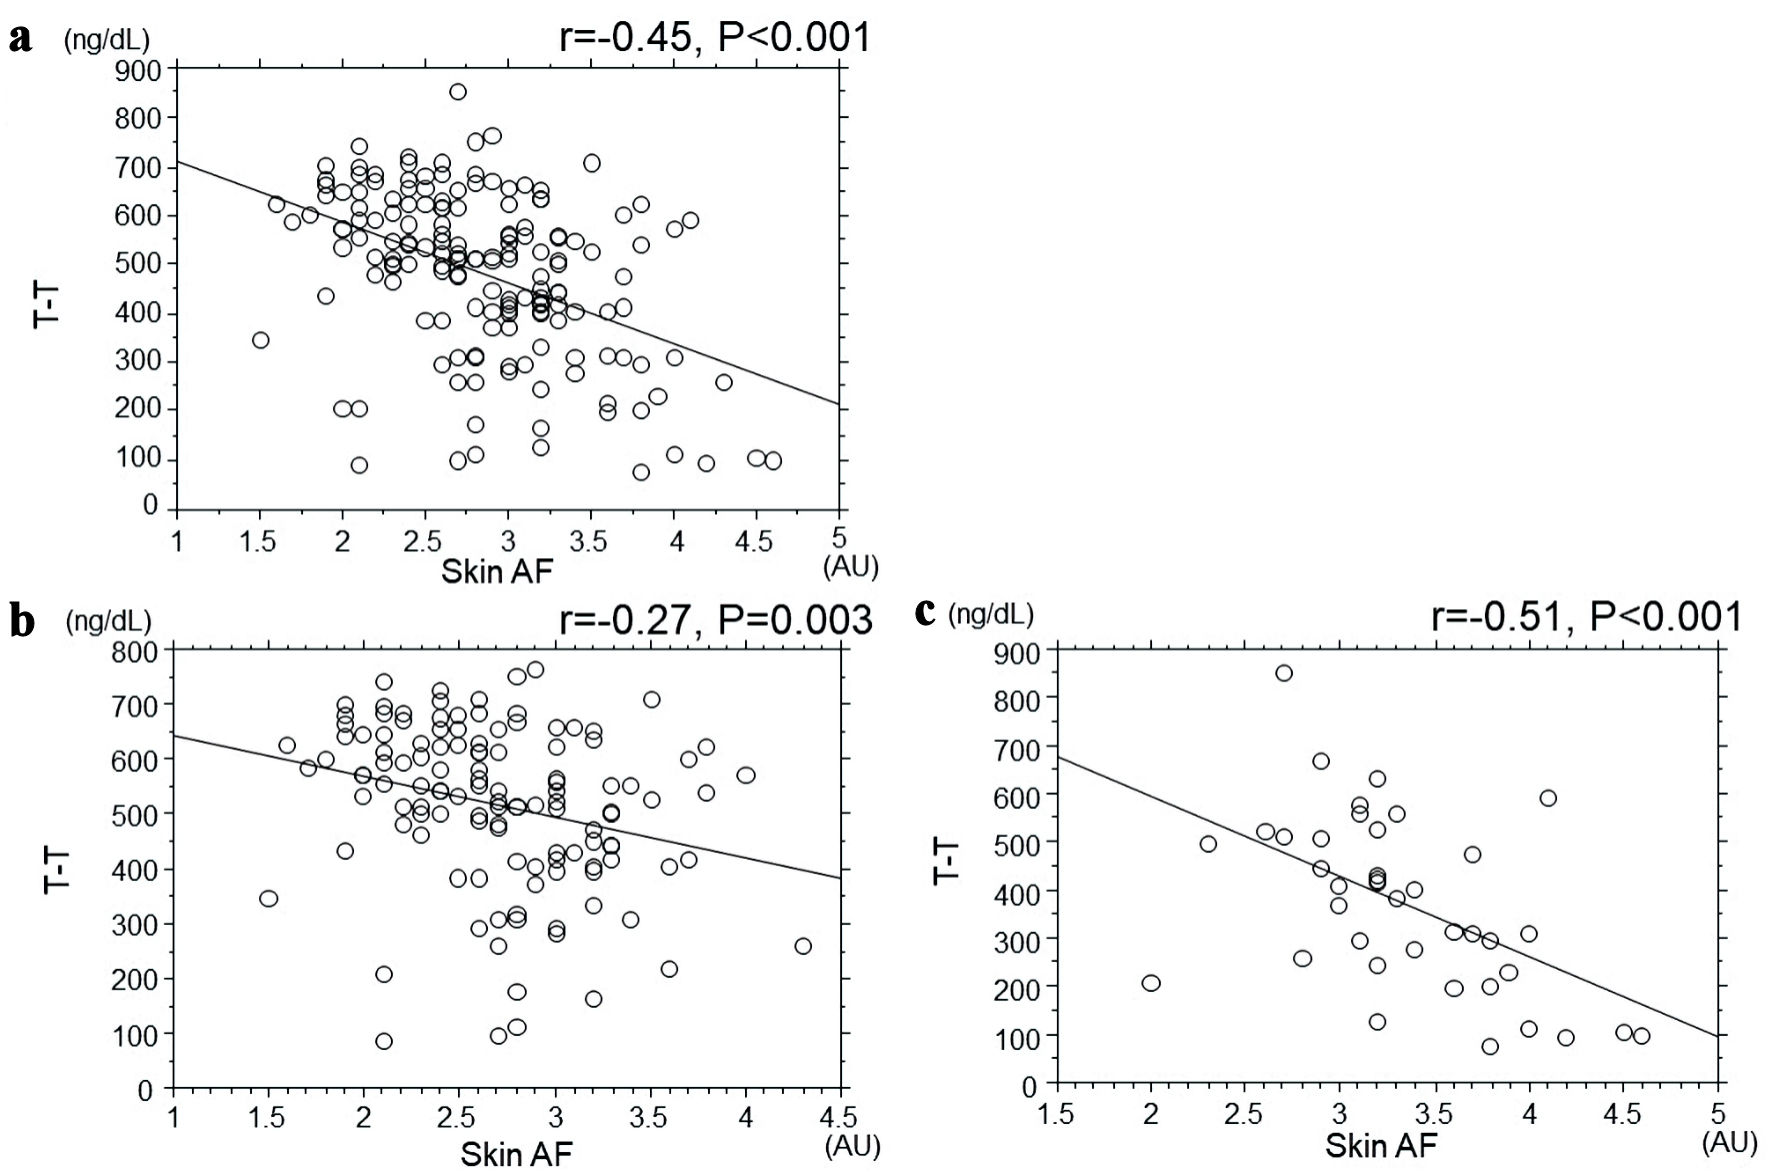
Figure 1. Correlation between T-T and SAF. (a) All patients. (b) Non-CAD patients. (c) CAD patients. There was a significant negative correlation between T-T and SAF in all study groups ((a) r = -0.45, P < 0.001). However, as a result of examining the correlation with the presence or absence of CAD, the correlation was stronger in CAD patients than in non-CAD patients ((b) non-CAD: r = -0.27, P = 0.003; (c) CAD: r = -0.51, P < 0.001). T-T: total testosterone; SAF: skin autofluorescence; CAD: coronary artery disease; AU: arbitrary unit.
Figure 2.
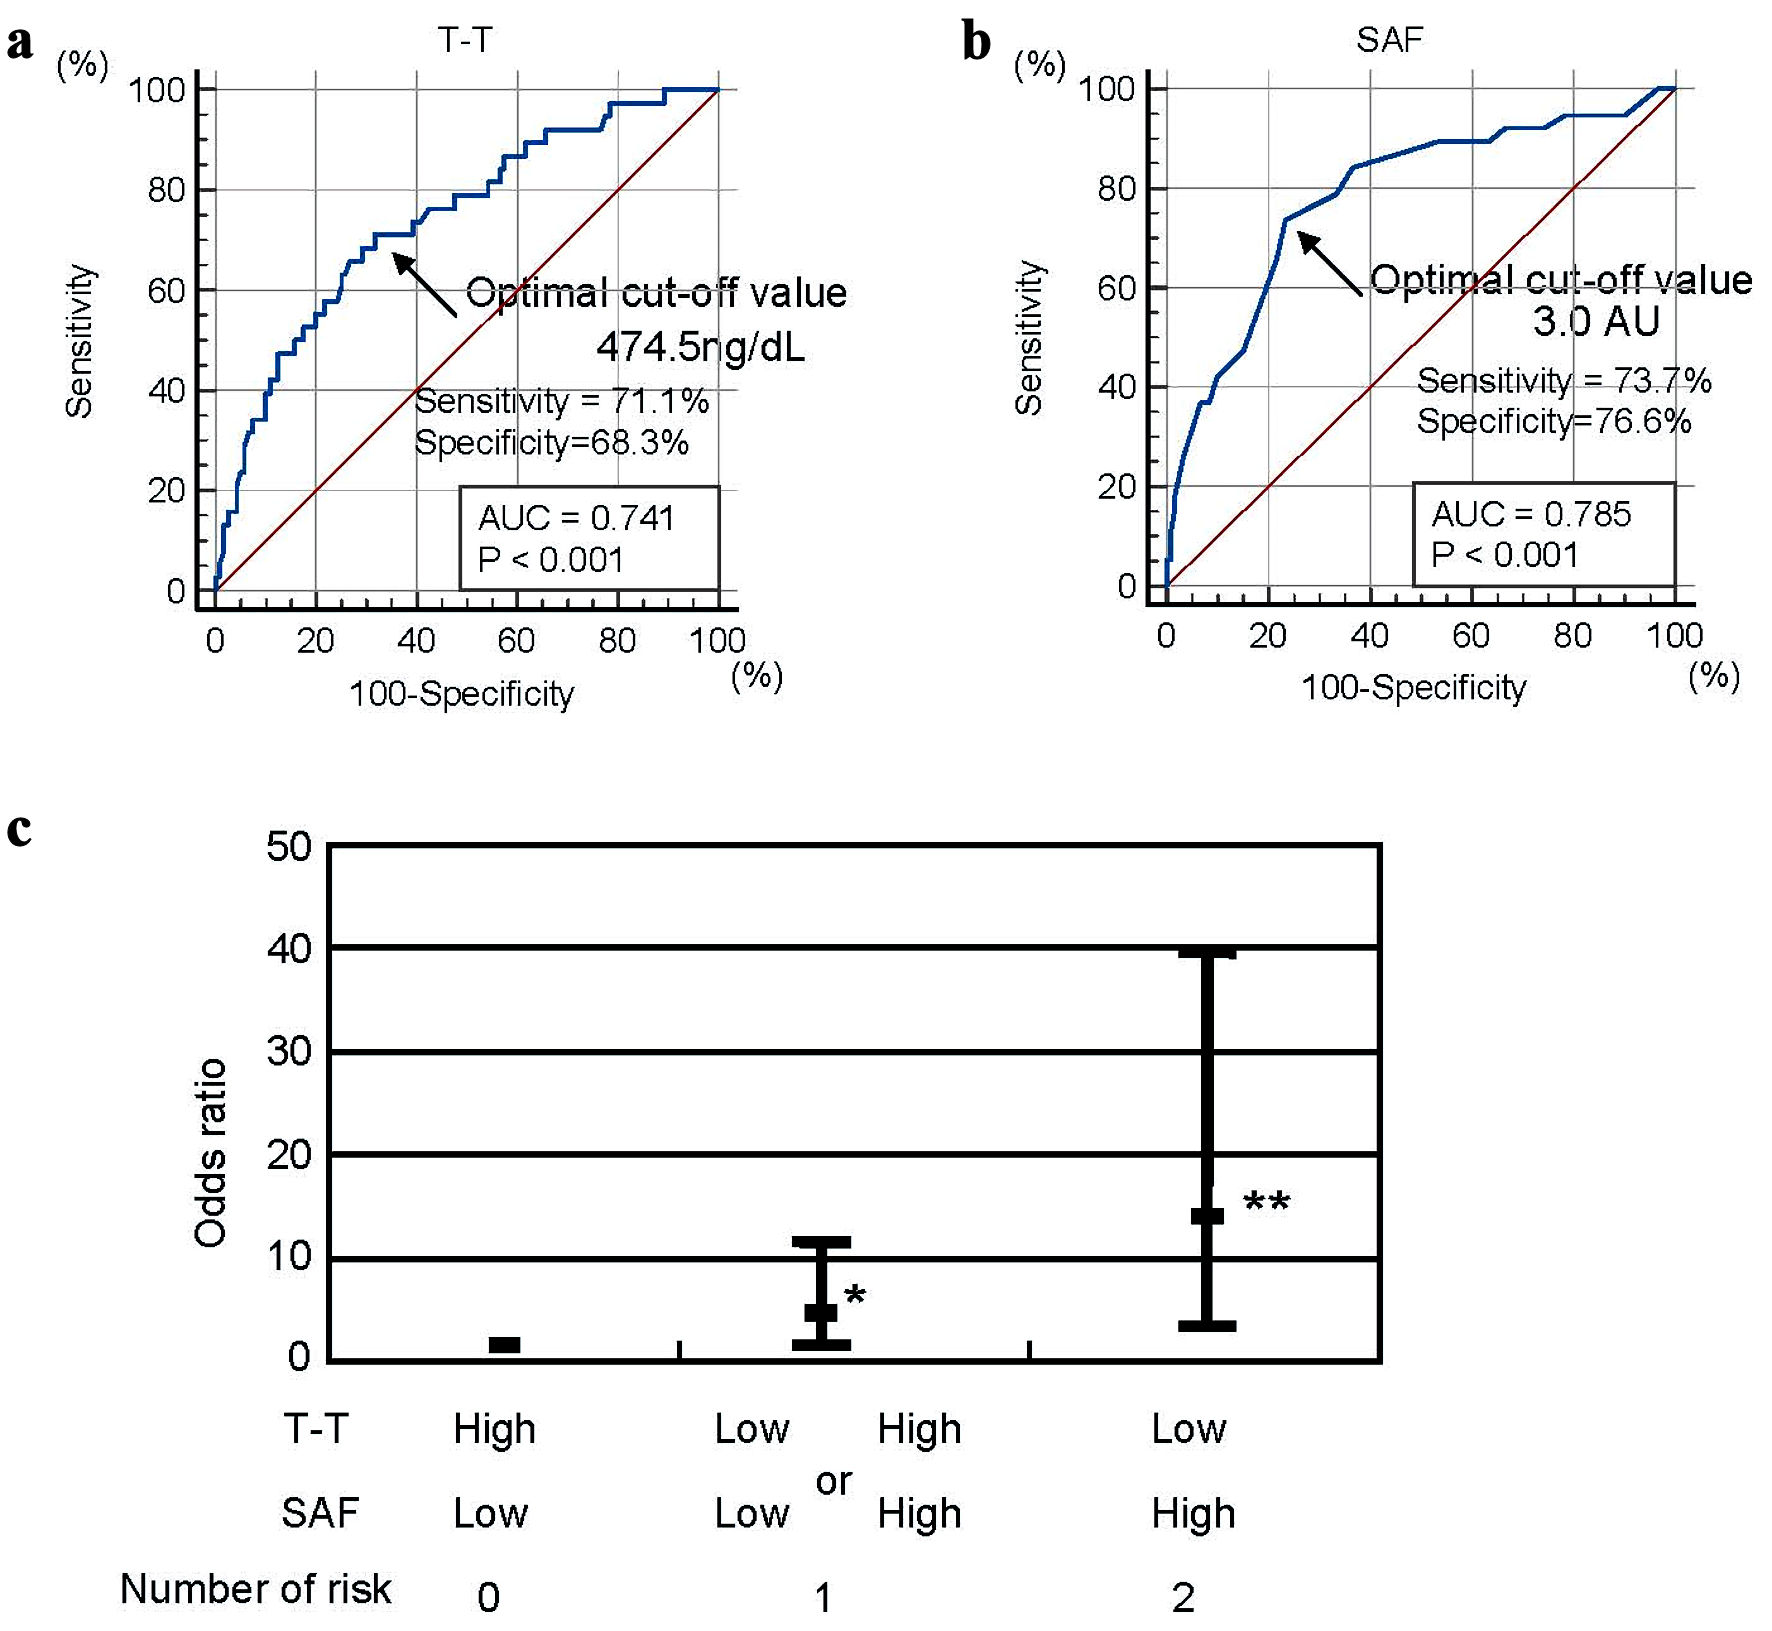
Figure 2. CAD risks due to the combination of T-T and SAF. The optimal cut-off values for detecting CAD based on receiver operating characteristic curve analysis were 474.5 ng/dL for T-T (a), and 3.0 AU for SAF (b). However, the OR significantly increased by combining the low T-T with the high SAF (c) (OR: one risk marker: 3.24, 95% CI: 1.01 - 10.50, P = 0.045; two risk markers: 13.22, 95% CI: 3.41 - 39.92, P < 0.001) The analysis was corrected by the LDL-C, CAVI, TyG index, and age, and the bar expressed 95% CI. *P = 0.039, **P < 0.001. CAD: coronary artery disease; T-T: total testosterone; SAF: skin autofluorescence; OR: odds ratio; CI: confidence interval; AU: arbitrary unit; AUC: area under the curve; LDL-C: low-density lipoprotein cholesterol; CAVI: cardio-ankle vascular index; TyG: triglyceride-glucose.

Tables

Table 1. Clinical Characteristics of the Studied Groups
 
Overall (n = 162)Non-CAD (n = 127)CAD (n = 35)P value
Continuous values are presented as mean ± SD or median (25th - 75th percentile). CAD: coronary artery disease; SBP: systolic blood pressure; DBP: diastolic blood pressure; FBG; fasting blood glucose; HbA1c: hemoglobin A1c; TyG: triglyceride-glucose; LDL: low-density lipoprotein; HDL: high-density lipoprotein; hs-CRP: high-sensitivity C-reactive protein; eGFR: estimated glomerular filtration rate; CAVI: cardio-ankle vascular index; T-T: total testosterone; SAF: skin autofluorescence; DPP: dipeptidyl peptidase; SGLT2: sodium glucose cotransporter 2; SD: standard deviation.
Age (years)69 ± 1167 ± 1073 ± 130.005
Smoker, n (%)47 (29)38 (30)9 (26)0.129
SBP (mm Hg)131 ± 19131 ± 19131 ± 210.853
DBP (mm Hg)81 ± 1181 ± 1182 ± 110.783
FBG (mg/dL)131 ± 20130 ± 15133 ± 280.385
HbA1c (%)7.1 ± 1.27.0 ± 1.27.3 ± 1.10.264
TyG index9.0 ± 0.68.9 ± 0.69.3 ± 0.5< 0.001
Total cholesterol (mg/dL)186 ± 39191 ± 38167 ± 370.002
LDL cholesterol (mg/dL)113 ± 37120 ± 3489 ± 34< 0.001
Triglyceride (mg/dL)142 ± 68131 ± 60183 ± 78< 0.001
HDL cholesterol (mg/dL)44 ± 1344 ± 1342 ± 100.310
hs-CRP (mg/L)0.7 (0.3 - 1.7)0.6 (0.2 - 1.6)1.1 (0.5 - 2.7)0.023
eGFR (mL/min/1.73 m2)66 ± 2169 ± 2157 ± 210.004
CAVI9.1 ± 1.38.8 ± 1.110.1 ± 1.6< 0.001
T-T (ng/dL)481.9 ± 169.0520.5 ± 149.9341.8 ± 161.1< 0.001
SAF (arbitrary unit)2.8 ± 0.52.7 ± 0.53.4 ± 0.5< 0.001
Medication
  Biguanide, n (%)74 (46)62 (49)12 (34)0.128
  DPP-4 inhibitor, n (%)106 (65)79 (62)27 (77)0.101
  Sulfonylurea, n (%)47 (29)33 (26)14 (40)0.107
  Thiazolidinedione, n (%)17 (10)13 (10)4 (11)0.927
  SGLT2 inhibitor, n (%)37 (23)29 (23)8 (23)0.998
  Insulin, n (%)24 (15)20 (16)4 (11)0.527
  Statin, n (%)93 (57)64 (50)29 (83)< 0.001


Table 2. Correlation Between T-T, SAF and Various Clinical Parameters
 
r
T-TSAF
r expressed correlation coefficient. *P < 0.05, **P < 0.01, ***P < 0.001. T-T: total testosterone; SAF: skin autofluorescence; SBP: systolic blood pressure; DBP: diastolic blood pressure; FBG; fasting blood glucose; HbA1c: hemoglobin A1c; TyG: triglyceride-glucose; eGFR: estimated glomerular filtration rate; LDL: low-density lipoprotein; HDL: high-density lipoprotein; hs-CRP: high-sensitivity C-reactive protein; CAVI: cardio-ankle vascular index; DPP: dipeptidyl peptidase; SGLT2: sodium glucose cotransporter 2.
Age (actual value)-0.22**0.21**
Smoker (no = 0, yes = 1)0.090.23**
SBP (actual value)-0.090.04
DBP (actual value)-0.100.07
FBG (actual value)-0.18*0.19*
HbA1c (actual value)-0.22**0.23**
TyG index (actual value)-0.29***0.20**
Total cholesterol (actual value)0.150.12
LDL cholesterol (actual value)0.140.11
Triglyceride (actual value)-0.30***0.20**
HDL cholesterol (actual value)0.16-0.13
hs-CRP (actual value)-0.35***0.38***
eGFR (actual value)0.17*-0.25**
CAVI (actual value)-0.48***0.44***
Biguanide (no = 0, yes = 1)0.02-0.03
DPP-4 inhibitor (no = 0, yes = 1)-0.13-0.07
Sulfonylurea (no = 0, yes = 1)-0.11-0.03
Thiazolidinedione (no = 0, yes = 1)0.11-0.10
SGLT2 inhibitor (no = 0, yes = 1)0.15-0.20**
Insulin (no = 0, yes = 1)-0.140.07
Statin (no = 0, yes = 1)-0.160.17


Table 3. Multiple Regression Analysis for CAD
 
Explanatory factorβP value
R2 = 0.34, P < 0.001. CAD: coronary artery disease; LDL: low-density lipoprotein; CAVI: cardio-ankle vascular index; SAF: skin autofluorescence; T-T: total testosterone; TyG: triglyceride-glucose; eGFR: estimated glomerular filtration rate; hs-CRP: high-sensitivity C-reactive protein; HbA1c: hemoglobin A1c; β: standardized regression coefficient; R2: coefficient of determination.
LDL cholesterol-0.27< 0.001
CAVI0.26< 0.001
SAF0.220.014
T-T-0.180.029
TyG index0.150.047
Statin0.130.101
eGFR-0.120.089
hs-CRP0.040.580
Age0.020.729
HbA1C0.010.929