Figures
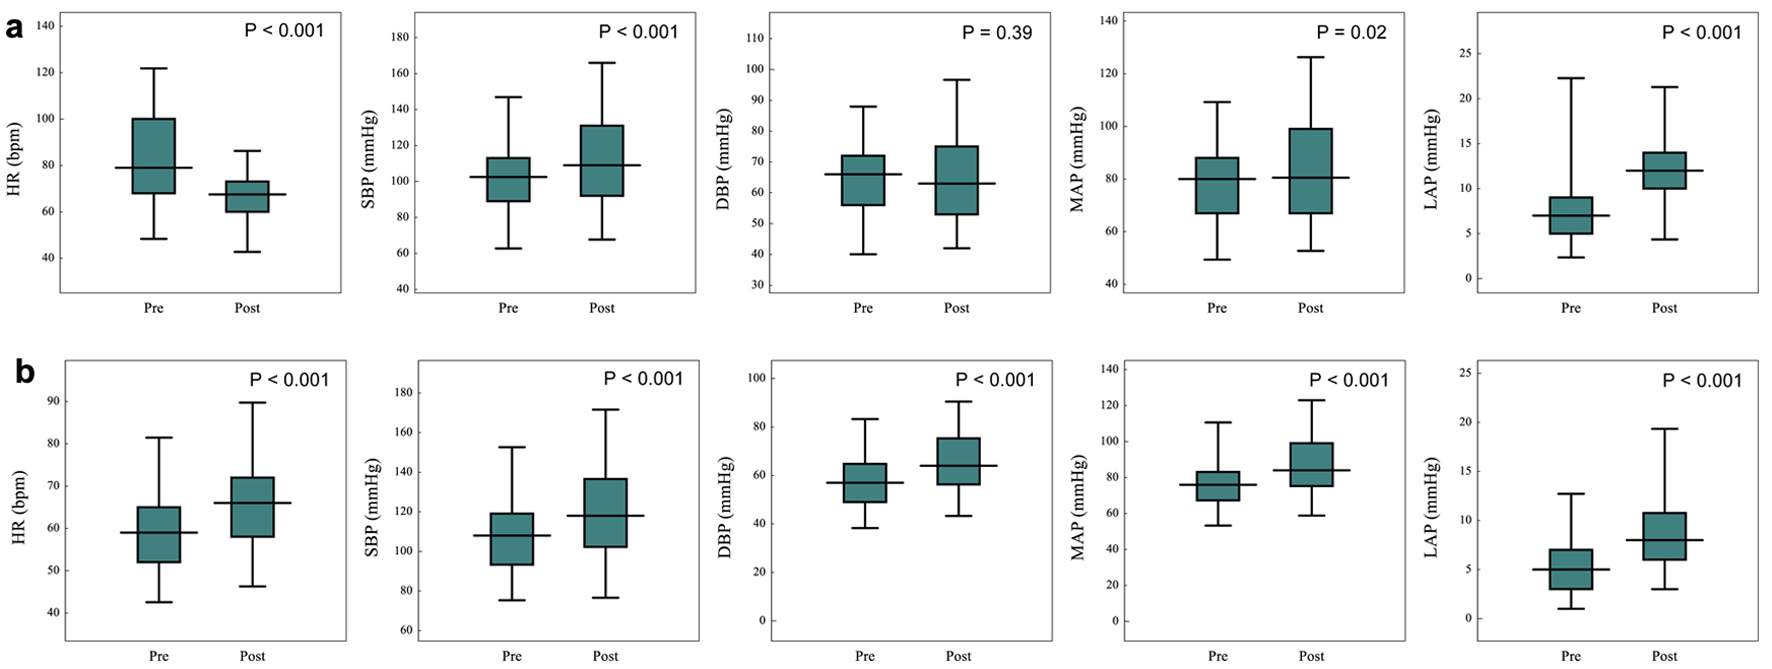
Figure 1. Changes in heart rate and blood pressure from before to 19 ± 16 min after sinus rhythm restoration in the pre-atrial fibrillation group (a) and from before to after pulmonary vein isolation in the control group (b). AF: atrial fibrillation; bpm: beats per minute; DBP: diastolic blood pressure; HR: heart rate; LAP: left atrial pressure; MAP: mean arterial pressure; SBP: systolic blood pressure.
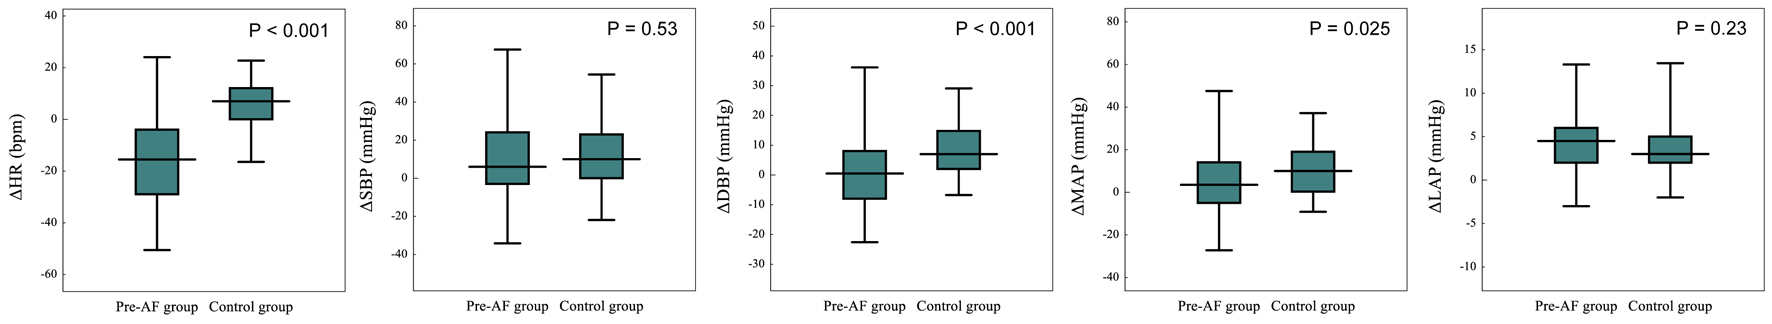
Figure 2. Comparison of the changes in heart rate and blood pressure from before to after pulmonary vein isolation in the pre-atrial fibrillation and control groups. AF: atrial fibrillation; bpm: beats per minute; ΔDBP: change in diastolic blood pressure; ΔHR: change in heart rate; ΔLAP: change in left atrial pressure; ΔMAP: change in mean arterial pressure; ΔSBP: change in systolic blood pressure.
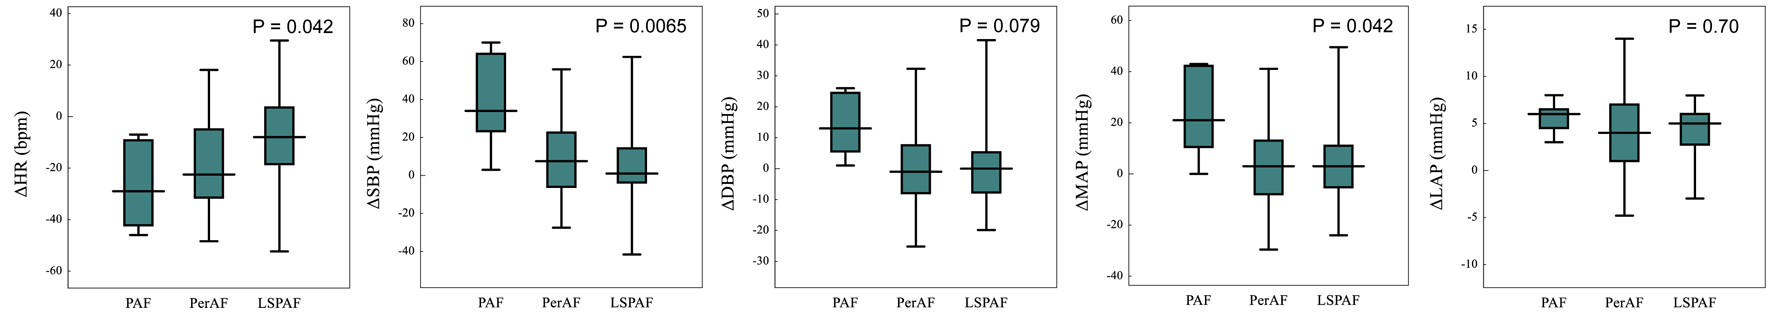
Figure 3. Comparison of changes in heart rate and blood pressure from before to after pulmonary vein isolation in patients with paroxysmal, persistent, and long-standing persistent atrial fibrillation. bpm: beats per minute; ΔDBP: change in diastolic blood pressure; ΔHR: change in heart rate; ΔLAP: change in left atrial pressure; LSPAF: long-standing persistent atrial fibrillation; ΔMAP: change in mean arterial pressure; PAF: paroxysmal atrial fibrillation; PerAF: persistent atrial fibrillation; ΔSBP: change in systolic blood pressure.
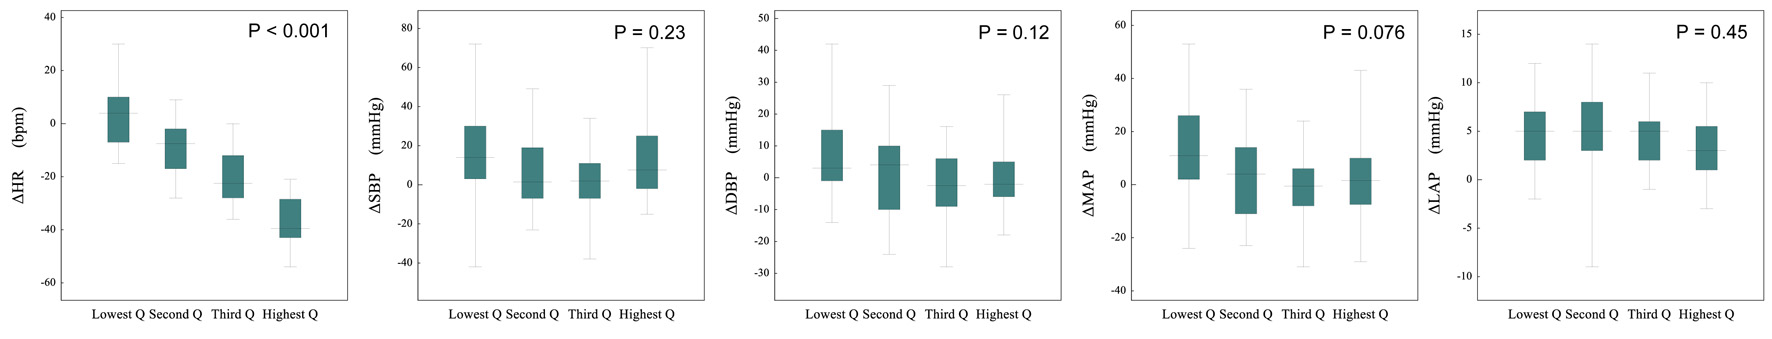
Figure 4. Comparison of the changes in heart rate and blood pressure from before to after pulmonary vein isolation in patients with the quartiles of atrial fibrillation-heart rate. bpm: beats per minute; ΔDBP: change in diastolic blood pressure; ΔHR: change in heart rate; ΔLAP: change in left atrial pressure; ΔMAP: change in mean arterial pressure; Q: quartile; ΔSBP: change in systolic blood pressure.
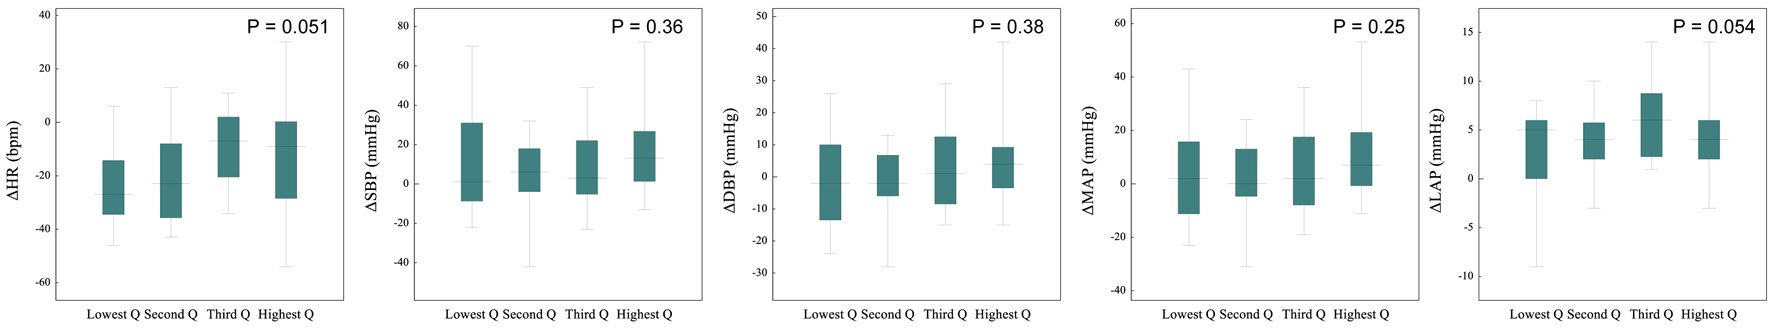
Figure 5. Comparison of the changes in heart rate and blood pressure from before to after pulmonary vein isolation in patients with the quartiles of left atrial dimension. bpm: beats per minute; ΔDBP: change in diastolic blood pressure; ΔHR: change in heart rate; ΔLAP: change in left atrial pressure; ΔMAP: change in mean arterial pressure; Q: quartile; ΔSBP: change in systolic blood pressure.
Tables
Table 1. Clinical Characteristics in the Pre-AF and Control Groups
| Pre-AF group (n = 74) | Control group (n = 71) | Pre-AF vs. control P value |
|---|
| AADs: anti-arrhythmic drugs; ACEI: angiotensin-converting enzyme inhibitors; AF: atrial fibrillation; ARB: angiotensin receptor blocker; ARNI: angiotensin receptor neprilysin inhibitor; BMI: body mass index; BNP: brain natriuretic peptide; CCr: creatinine clearance; CTI: cavotricuspid isthmus; DM: diabetes mellitus; Hb: hemoglobin; HTN: hypertension; LAD: left atrial dimension; LSPAF: long-standing persistent atrial fibrillation; LVDd: left ventricular end-diastolic dimension; LVDs: left ventricular end-systolic dimension; LVEF: left ventricular ejection fraction; LVWT: left ventricular wall thickness; MRA: mineralocorticoid receptor antagonist; NYHA: New York Heart Association; PAF: paroxysmal atrial fibrillation; PerAF: persistent atrial fibrillation; SGLT2i: sodium-glucose cotransporter-2 inhibitor. |
| Age, years | 66 ± 8 | 67 ± 10 | 0.44 |
| Male, n (%) | 55 (74) | 47 (66) | 0.28 |
| AF classification | | | |
| PAF, n (%) | 5 (7) | 71 (100) | < 0.001 |
| PerAF, n (%) | 48 (65) | 0 (0) | < 0.001 |
| LSPAF, n (%) | 21 (28) | 0 (0) | < 0.001 |
| BMI, kg/m2 | 24.5 ± 3.6 | 23.3 ± 3.1 | 0.035 |
| Comorbidities | | | |
| HTN, n (%) | 45 (61) | 44 (62) | 0.88 |
| DM, n (%) | 12 (16) | 6 (9) | 0.15 |
| Vascular disease, n (%) | 23 (31) | 21 (30) | 0.84 |
| Stroke, n (%) | 8 (11) | 5 (7) | 0.42 |
| NYHA functional class | | | |
| I, n (%) | 37 (50) | 62 (87) | < 0.001 |
| II, n (%) | 37 (50) | 9 (13) | < 0.001 |
| Laboratory test | | | |
| Hb, g/dL | 14.4 ± 1.3 | 13.5 ± 1.6 | < 0.001 |
| CCr, mL/min | 76.8 ± 23.6 | 75.5 ± 23.6 | 0.74 |
| BNP, pg/mL | 179.1 ± 71.8 | 58.0 ± 47.6 | < 0.001 |
| Echocardiographic parameters | | | |
| LAD, mm | 44.0 ± 5.6 | 39.5 ± 6.4 | < 0.001 |
| LVDd, mm | 46.4 ± 5.8 | 45.8 ± 4.8 | 0.46 |
| LVDs, mm | 31.4 ± 6.2 | 29.4 ± 6.4 | 0.059 |
| LVEF, % | 59.3 ± 9.6 | 64.6 ± 9.2 | 0.001 |
| LVWT, mm | 9.7 ± 1.4 | 9.4 ± 1.8 | 0.27 |
| Medications | | | |
| Heart failure drugs | | | |
| ACEI/ARB, n (%) | 27 (37) | 32 (45) | 0.29 |
| ARNI, n (%) | 4 (5) | 2 (3) | 0.43 |
| MRA, n (%) | 9 (12) | 9 (13) | 0.93 |
| SGLT2i, n (%) | 7 (10) | 5 (7) | 0.6 |
| Loop diuretics, n (%) | 18 (24) | 12 (13) | 0.27 |
| AADs | | | |
| Class I AADs, n (%) | 5 (7) | 9 (13) | 0.22 |
| Amiodarone, n (%) | 1 (1) | 4 (6) | 0.15 |
| Bepridil, n (%) | 16 (22) | 28 (39) | 0.019 |
| β-blockers, n (%) | 49 (66) | 42 (59) | 0.37 |
| Others, n (%) | 6 (8) | 3 (4) | 0.33 |
| Redo AF ablation, n (%) | 13 (18) | 13 (18) | 0.9 |
| CTI ablation, n (%) | 3 (4) | 24 (34) | < 0.001 |
Table 2. Comparison of Intraprocedural Parameters Between the Pre-AF and Control Groups
| Pre-AF group (n = 74) | Control group (n = 71) | Pre-AF vs. control P value |
|---|
| AF: atrial fibrillation; DBP: diastolic blood pressure; HR: heart rate; LAP: left atrial pressure; MAP: mean arterial pressure; N/A: not applicable; SBP: systolic blood pressure; SR: sinus rhythm. |
| Pre-measurement | | | |
| HRpre, bpm | 82.5 ± 20.2 | 59.7 ± 9.9 | < 0.001 |
| SBPpre, mm Hg | 100.8 ± 21.5 | 108.5 ± 20.7 | 0.029 |
| DBPpre, mm Hg | 64.4 ± 12.9 | 56.5 ± 12.5 | < 0.001 |
| MAPpre, mm Hg | 78.7 ± 15.8 | 76.5 ± 16.3 | 0.39 |
| LAPpre, mm Hg | 7.9 ± 4.4 | 5.3 ± 3.3 | < 0.001 |
| Intraprocedural comparison | | | |
| Total infusion, mL | 1,120.6 ± 420.2 | 999.7 ± 379.6 | 0.071 |
| Sedatives | | | |
| Dexmedetomidine, µg | 73.8 ± 25.2 | 74.8 ± 37.2 | 0.84 |
| Fentanyl, mg | 0.16 ± 0.05 | 0.17 ± 0.06 | 0.26 |
| Diazepam, mg | 8.4 ± 3.5 | 9.1 ± 4.5 | 0.32 |
| Thiopental, mg | 90.1 ± 41.8 | N/A | N/A |
| Contrast agent, mL | 28.1 ± 11.6 | 28.2 ± 9.9 | 0.96 |
| The time after SR restoration, min | 18.5 ± 15.5 | N/A | N/A |
| Procedure time, min | 168.3 ± 46.4 | 159.5 ± 52.3 | 0.29 |
| Post-measurement | | | |
| HRpost, bpm | 66.2 ± 10.7 | 65.6 ± 10.9 | 0.71 |
| SBPpost, mm Hg | 110.7 ± 26.0 | 120.6 ± 24.5 | 0.019 |
| DBPpost, mm Hg | 65.7 ± 15.0 | 65.3 ± 13.0 | 0.86 |
| MAPpost, mm Hg | 83.7 ± 19.4 | 87.4 ± 16.7 | 0.21 |
| LAPpost, mm Hg | 12.1 ± 4.0 | 8.8 ± 3.9 | < 0.001 |
Table 3. Comparison of Intraprocedural Parameters Among the AF Classification Groups
| PAF group (n = 5) | PerAF group (n = 48) | LSPAF group (n = 21) | PAF vs. PerAF vs. LSPAF P value |
|---|
| DBP: diastolic blood pressure; HR: heart rate; LAP: left atrial pressure; LSPAF: long-standing persistent atrial fibrillation; MAP: mean arterial pressure; PAF: paroxysmal atrial fibrillation; PerAF: persistent atrial fibrillation; SBP: systolic blood pressure; SR: sinus rhythm. |
| Pre-measurement | | | | |
| HRpre, bpm | 93.4 ± 38.3 | 85.4 ± 19.8 | 73.4 ± 11.8 | 0.033 |
| SBPpre, mm Hg | 73.6 ± 15.8 | 101.9 ± 20.7 | 104.8 ± 20.6 | 0.0099 |
| DBPpre, mm Hg | 48.2 ± 11.5 | 65.6 ± 12.5 | 65.5 ± 11.8 | 0.012 |
| MAPpre, mm Hg | 59.6 ± 13.1 | 80.2 ± 15.6 | 80.0 ± 14.5 | 0.017 |
| LAPpre, mm Hg | 6.2 ± 3.0 | 8.0 ± 4.9 | 8.0 ± 3.3 | 0.67 |
| Intraprocedural comparison | | | | |
| Total infusion, mL | 1,283.2 ± 544.4 | 1,107.2 ± 418.3 | 1,112.5 ± 408.6 | 0.67 |
| Sedatives | | | | |
| Dexmedetomidine, µg | 77.6 ± 29.3 | 70.0 ± 25.5 | 81.4 ± 22.8 | 0.21 |
| Fentanyl, mg | 0.14 ± 0.065 | 0.16 ± 0.047 | 0.186 ± 0.064 | 0.21 |
| Diazepam, mg | 7.0 ± 2.0 | 8.4 ± 3.8 | 8.9 ± 3.0 | 0.54 |
| Thiopental, mg | 115.0 ± 57.6 | 87.5 ± 38.9 | 91.7 ± 44.3 | 0.375 |
| Contrast agent, mL | 29.4 ± 6.3 | 29.1 ± 11.5 | 25.6 ± 12.7 | 0.5 |
| Procedure time, min | 177.2 ± 57.7 | 165.2 ± 45.1 | 173.1 ± 48.4 | 0.73 |
| The time after SR restoration, min | 10.0 ± 6.3 | 21.5 ± 15.5 | 17.0 ± 8.1 | 0.29 |
| Post-measurement | | | | |
| HRpost, bpm | 66.8 ± 21.3 | 66.6 ± 9.6 | 65.1 ± 10.4 | 0.85 |
| SBPpost, mm Hg | 113.4 ± 28.5 | 110.7 ± 26.6 | 110.1 ± 25.1 | 0.96 |
| DBPpost, mm Hg | 62.4 ± 17.3 | 65.6 ± 13.7 | 66.8 ± 17.8 | 0.84 |
| MAPpost, mm Hg | 83.6 ± 23.1 | 83.2 ± 18.8 | 84.5 ± 20.7 | 0.97 |
| LAPpost, mm Hg | 11.8 ± 2.0 | 12.1 ± 4.7 | 12.1 ± 2.4 | 0.98 |
Table 4. Comparison of Intraprocedural Parameters Among the Quartile AF-HR Groups
| Lowest Q (n = 18) | Second Q (n = 18) | Third Q (n = 18) | Highest Q (n = 20) | P value |
|---|
| AF: atrial fibrillation; DBP: diastolic blood pressure; HR: heart rate; LAP: left atrial pressure; MAP: mean arterial pressure; Q: quartile; SBP: systolic blood pressure; SR: sinus rhythm. |
| Pre-measurement | | | | | |
| HRpre, bpm | 57.7 ± 7.4 | 74.0 ± 2.9 | 86.1 ± 6.0 | 109.3 ± 8.1 | < 0.001 |
| SBPpre, mm Hg | 102.9 ± 21.7 | 107.9 ± 23.3 | 96.2 ± 19.1 | 96.8 ± 21.2 | 0.3 |
| DBPpre, mm Hg | 60.7 ± 14.6 | 64.9 ± 12.6 | 65.3 ± 12.0 | 66.5 ± 12.5 | 0.56 |
| MAPpre, mm Hg | 75.1 ± 15.9 | 82.4 ± 16.9 | 77.9 ± 15.2 | 79.5 ± 15.7 | 0.58 |
| LAPpre, mm Hg | 7.1 ± 3.4 | 8.5 ± 5.1 | 6.6 ± 3.3 | 9.3 ± 5.1 | 0.2 |
| Intraprocedural comparison | | | | | |
| Total infusion, mL | 1,178.9 ± 496.4 | 1,150.6 ± 425.4 | 1,197.8 ± 373.1 | 971.7 ± 372.1 | 0.32 |
| Sedatives | | | | | |
| Dexmedetomidine, µg | 73.0 ± 22.0 | 70.2 ± 23.4 | 82.4 ± 27.4 | 69.8 ± 27.3 | 0.4 |
| Fentanyl, mg | 0.169 ± 0.049 | 0.181 ± 0.055 | 0.181 ± 0.057 | 0.138 ± 0.048 | 0.039 |
| Diazepam, mg | 8.1 ± 4.0 | 8.1 ± 2.6 | 10.0 ± 4.1 | 7.6 ± 2.8 | 0.19 |
| Thiopental, mg | 95.8 ± 41.3 | 81.9 ± 36.2 | 95.8 ± 46.4 | 88.8 ± 44.0 | 0.72 |
| Contrast agent, mL | 29.8 ± 6.8 | 30.2 ± 13.5 | 24.6 ± 12.8 | 27.9 ± 12.1 | 0.45 |
| Procedure time, min | 187.8 ± 49.8 | 153.6 ± 40.8 | 177.8 ± 44.6 | 155.9 ± 45.0 | 0.064 |
| The time after SR restoration, min | 17.0 ± 17.5 | 13.5 ± 8.5 | 20.0 ± 11.5 | 25.0 ± 15.8 | 0.97 |
| Post-measurement | | | | | |
| HRpost, bpm | 61.6 ± 12.2 | 64.4 ± 9.9 | 66.2 ± 8.1 | 72.1 ± 10.1 | 0.016 |
| SBPpost, mm Hg | 120.1 ± 27.2 | 115.2 ± 32.7 | 98.5 ± 17.0 | 109.4 ± 21.7 | 0.072 |
| DBPpost, mm Hg | 68.2 ± 18.4 | 66.1 ± 17.9 | 62.6 ± 10.8 | 66.1 ± 12.5 | 0.73 |
| MAPpost, mm Hg | 89.1 ± 21.6 | 85.8 ± 23.6 | 77.2 ± 13.1 | 82.6 ± 17.3 | 0.3 |
| LAPpost, mm Hg | 11.8 ± 3.2 | 13.6 ± 2.7 | 10.4 ± 3.3 | 12.5 ± 5.6 | 0.12 |
Table 5. Comparison of Intraprocedural Parameters Among the Quartile LAD Groups
| Lowest Q (n = 17) | Second Q (n = 19) | Third Q (n = 19) | Highest Q (n = 19) | P value |
|---|
| AF: atrial fibrillation; DBP: diastolic blood pressure; HR: heart rate; LAD: left atrial dimension; LAP: left atrial pressure; MAP: mean arterial pressure; Q: quartile; SBP: systolic blood pressure; SR: sinus rhythm. |
| LAD, mm | 37.0 ± 2.9 | 41.8 ± 0.8 | 45.2 ± 1.3 | 51.3 ± 3.1 | < 0.001 |
| Pre-measurement | | | | | |
| HRpre, bpm | 89.9 ± 21.9 | 89.4 ± 21.5 | 73.5 ± 13.7 | 78.1 ± 19.4 | 0.023 |
| SBPpre, mm Hg | 97.4 ± 28.2 | 106.3 ± 21.0 | 96.9 ± 17.0 | 102.4 ± 19.3 | 0.5 |
| DBPpre, mm Hg | 62.5 ± 14.5 | 69.2 ± 11.3 | 60.5 ± 10.6 | 65.1 ± 14.2 | 0.19 |
| MAPpre, mm Hg | 76.9 ± 20.1 | 84.2 ± 14.2 | 75.2 ± 12.9 | 78.4 ± 15.5 | 0.33 |
| LAPpre, mm Hg | 7.4 ± 4.6 | 8.6 ± 3.7 | 7.8 ± 4.9 | 7.7 ± 4.6 | 0.87 |
| Intraprocedural comparison | | | | | |
| Total infusion, mL | 1,087.1 ± 428.5 | 1,125.9 ± 374.2 | 1,176.8 ± 461.9 | 1,089.4 ± 440.7 | 0.91 |
| Sedatives | | | | | |
| Dexmedetomidine, µg | 71.5 ± 23.8 | 72.5 ± 22.3 | 76.4 ± 27.1 | 74.7 ± 28.9 | 0.94 |
| Fentanyl, mg | 0.156 ± 0.053 | 0.176 ± 0.061 | 0.176 ± 0.051 | 0.155 ± 0.052 | 0.45 |
| Diazepam, mg | 7.4 ± 3.4 | 9.0 ± 3.8 | 7.5 ± 2.8 | 10.0 ± 3.7 | 0.067 |
| Thiopental, mg | 89.7 ± 42.4 | 76.3 ± 32.8 | 97.4 ± 46.3 | 98.7 ± 43.7 | 0.33 |
| Contrast agent, mL | 28.4 ± 10.1 | 27.0 ± 11.7 | 30.1 ± 13.3 | 26.9 ± 11.6 | 0.82 |
| Procedure time, min | 160.5 ± 43.9 | 172.0 ± 40.9 | 165.4 ± 44.4 | 174.8 ± 57.5 | 0.8 |
| The time after SR restoration, min | 29.0 ± 14.5 | 25.0 ± 16.6 | 19.0 ± 13.6 | 17.0 ± 7.0 | 0.84 |
| Post-measurement | | | | | |
| HRpost, bpm | 66.0 ± 14.0 | 68.9 ± 9.4 | 64.6 ± 8.6 | 65.3 ± 10.8 | 0.63 |
| SBPpost, mm Hg | 108.1 ± 23.5 | 109.7 ± 23.4 | 105.8 ± 29.7 | 119.0 ± 26.7 | 0.43 |
| DBPpost, mm Hg | 61.6 ± 12.1 | 67.4 ± 13.8 | 63.3 ± 17.2 | 70.2 ± 15.9 | 0.31 |
| MAPpost, mm Hg | 81.1 ± 16.2 | 83.7 ± 18.8 | 79.9 ± 22.3 | 89.6 ± 19.5 | 0.43 |
| LAPpost, mm Hg | 10.2 ± 3.9 | 12.2 ± 4.2 | 13.9 ± 3.6 | 11.8 ± 3.7 | 0.044 |