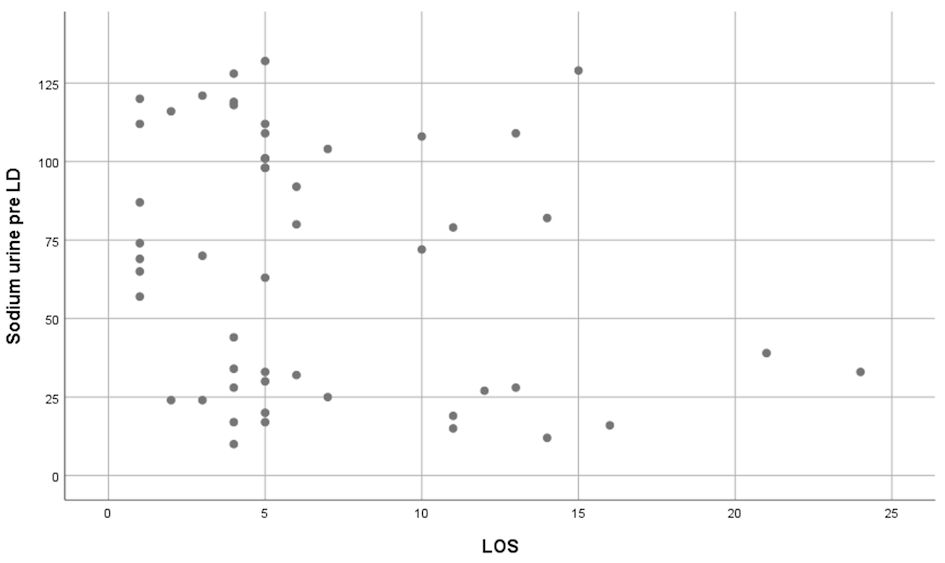
Figure 1. Pearson correlation result showing trends of significant correlation between pre-loop diuretic (LD) sodium urine and length of stay (LOS) (r = -0.238, P = 0.093).
| Cardiology Research, ISSN 1923-2829 print, 1923-2837 online, Open Access |
| Article copyright, the authors; Journal compilation copyright, Cardiol Res and Elmer Press Inc |
| Journal website https://www.cardiologyres.org |
Original Article
Volume 15, Number 5, October 2024, pages 350-357
Effect of Post-Loop Diuretic Urinary Sodium Level on Length of Stay and Rehospitalization in Acutely Decompensated Heart Failure Patients
Figures
Tables
| SD: standard deviation; ARB: angiotensin receptor blocker. | |
| Gender, n (%) | |
| Male | 40 (78.4) |
| Female | 11 (21.6) |
| Age (years), mean ± SD | 52.47 ± 13.62 |
| Left ventricular ejection fraction (%), mean ± SD | 37.53 ± 17.95 |
| Left ventricular ejection fraction category, n (%) | |
| > 50% | 14 (27.4) |
| 40-50% | 5 (9.8) |
| < 40% | 32 (62.7) |
| Systolic blood pressure (mm Hg), mean ± SD | 124.22 ± 26.35 |
| Diastolic blood pressure (mm Hg), mean ± SD | 74.76 ± 17.45 |
| Glomerular filtration rate (mL/min/1.73 m2), mean ± SD | 57.29 ± 27.25 |
| Random blood glucose (mg/dL), mean ± SD | 134.43 ± 46.83 |
| Diuretic administration strategy | |
| Nonaggressive | 21 (41.2) |
| Aggressive | 30 (58.8) |
| Angiotensin-converting enzyme inhibitors/ARB, n (%) | 40 (78.4) |
| Beta-blockers, n (%) | 36 (70.6) |
| Adherence to medication regiments, n (%) | 11 (21.6) |
| Baseline urinary and sodium levels | |
| Serum sodium (mmol/L) | |
| Pre-loop diuretic (mean ± SD) | 134.18 ± 4.55 |
| Post-loop diuretic (mean ± SD) | 135.53 ± 4.33 |
| Urinary sodium (mmol/L) | |
| Pre-loop diuretic (mean ± SD) | 67.69 ± 40.1 |
| Post-loop diuretic (mean ± SD) | 87.78 ± 36.37 |
| Pre-loop diuretic urinary sodium, n (% of subjects) | |
| < 50 mmol/L | 21(41.2) |
| > 50 mmol/L | 30 (58.8) |
| Post-loop diuretic urinary sodium, n (% of subjects) | |
| < 50 mmol/L | 12 (23.5) |
| > 50 mmol/L | 39 (76.5) |
| Length of stay (days) (mean ± SD) | P value | |
|---|---|---|
| Pre-loop diuretic urinary sodium | ||
| ≤ 50 mmol/L (n = 21) | 8.57 ± 6.161 | 0.04 |
| > 50 mmol/L (n = 30) | 5.30 ± 4.01 | |
| Post-loop diuretic urinary sodium | ||
| ≤ 50 mmol/L (n = 12) | 8.67 ± 4.14 | 0.126 |
| > 50 mmol/L (n = 39) | 6.03 ± 5.39 | |
| Gender | ||
| Male (n = 40) | 6.28 ± 4.89 | 0.417 |
| Female (n = 11) | 8.00 ± 6.34 | |
| Diuretic administration strategy | ||
| Nonaggressive (n = 21) | 6.43 ± 3.84 | 0.805 |
| Aggressive (n = 30) | 6.80 ± 6.05 |
| Rehospitalization in 30 days after discharge | P value | ||
|---|---|---|---|
| Yes (n = 9) | No (n = 42) | ||
| ACE: angiotensin-converting enzyme; SD: standard deviation; SBP: systolic blood pressure; DBP: diastolic blood pressure. | |||
| Male gender | 9 (100%) | 31 (73.8%) | 0.177 |
| Aggressive diuretic strategy | 4 (44.4%) | 25 (59.5%) | 1.00 |
| ACE inhibitor/angiotensin receptor blocker use during hospitalization | 5 (55.6%) | 35 (83.3%) | 0.087 |
| Beta-blocker use during hospitalization | 3 (33.3%) | 33 (78.6%) | 0.013 |
| Non-adherence to medication prescribed | 6 (66.67%) | 34 (80.9%) | 0.958 |
| Serum sodium pre-loop diuretic | 132.00 ± 4.183 | 134.64 ± 4.536 | 0.115 |
| Serum sodium post-loop diuretic | 133.89 ± 5.968 | 135.88 ± 3.902 | 0.362 |
| Pre-loop diuretic urinary sodium | 46.44 ± 30.99 | 72.27 ± 40.64 | 0.05 |
| ≤ 50 mmol/L (n = 21) | 5 (55.6) | 16 (38.1) | 0.46 |
| > 50 mmol/L (n = 30) | 4 (44.4) | 26 (61.9) | |
| Post-loop diuretic urinary sodium | 77.44 ± 30.67 | 90.00 ± 37.43 | 0.300 |
| ≤ 50 mmol/L (n = 12) | 2 (22.2) | 10 (23.8) | 1.000 |
| > 50 mmol/L (n = 39) | 7 (77.8) | 32 (76.2) | |
| Age (years), mean ± SD | 53.22 ± 13.24 | 49.89 ± 16.28 | 0.536 |
| Left ventricular ejection fraction (%), mean ± SD | 38.03 ± 18.16 | 35.22 ± 17.75 | 0.674 |
| SBP (mm Hg), mean ± SD | 127.45 ± 27.29 | 109.11 ± 14.56 | 0.057 |
| DBP (mm Hg), mean ± SD | 76.05 ± 18.30 | 68.78 ± 11.745 | 0.261 |
| Glomerular filtration rate, mean ± SD | 55.88 ± 27.62 | 63.89 ± 25.96 | 0.429 |
| Random blood glucose (mg/dL), median (IQR) | 137.24 ± 50.38 | 121.33 ± 22.215 | 0.361 |
| Variables | Unstandardized coefficients | Standardized coefficient | t | P value | |
|---|---|---|---|---|---|
| B | SE | B | |||
| SE: standard error. | |||||
| Glomerular filtration rate | -0.014 | 0.026 | -0.074 | -0.537 | 0.594 |
| Serum sodium pre-loop diuretic | 0.484 | 0.254 | 0.423 | 1.908 | 0.063 |
| Serum sodium post-loop diuretic | -0.387 | 0.230 | -0.322 | -1.683 | 0.099 |
| Urine sodium pre-loop diuretics | -0.026 | 0.021 | -0.202 | -1.265 | 0.212 |
| Urine sodium post-loop diuretics | -0.49 | 0.023 | -0.342 | -2.100 | 0.041 |