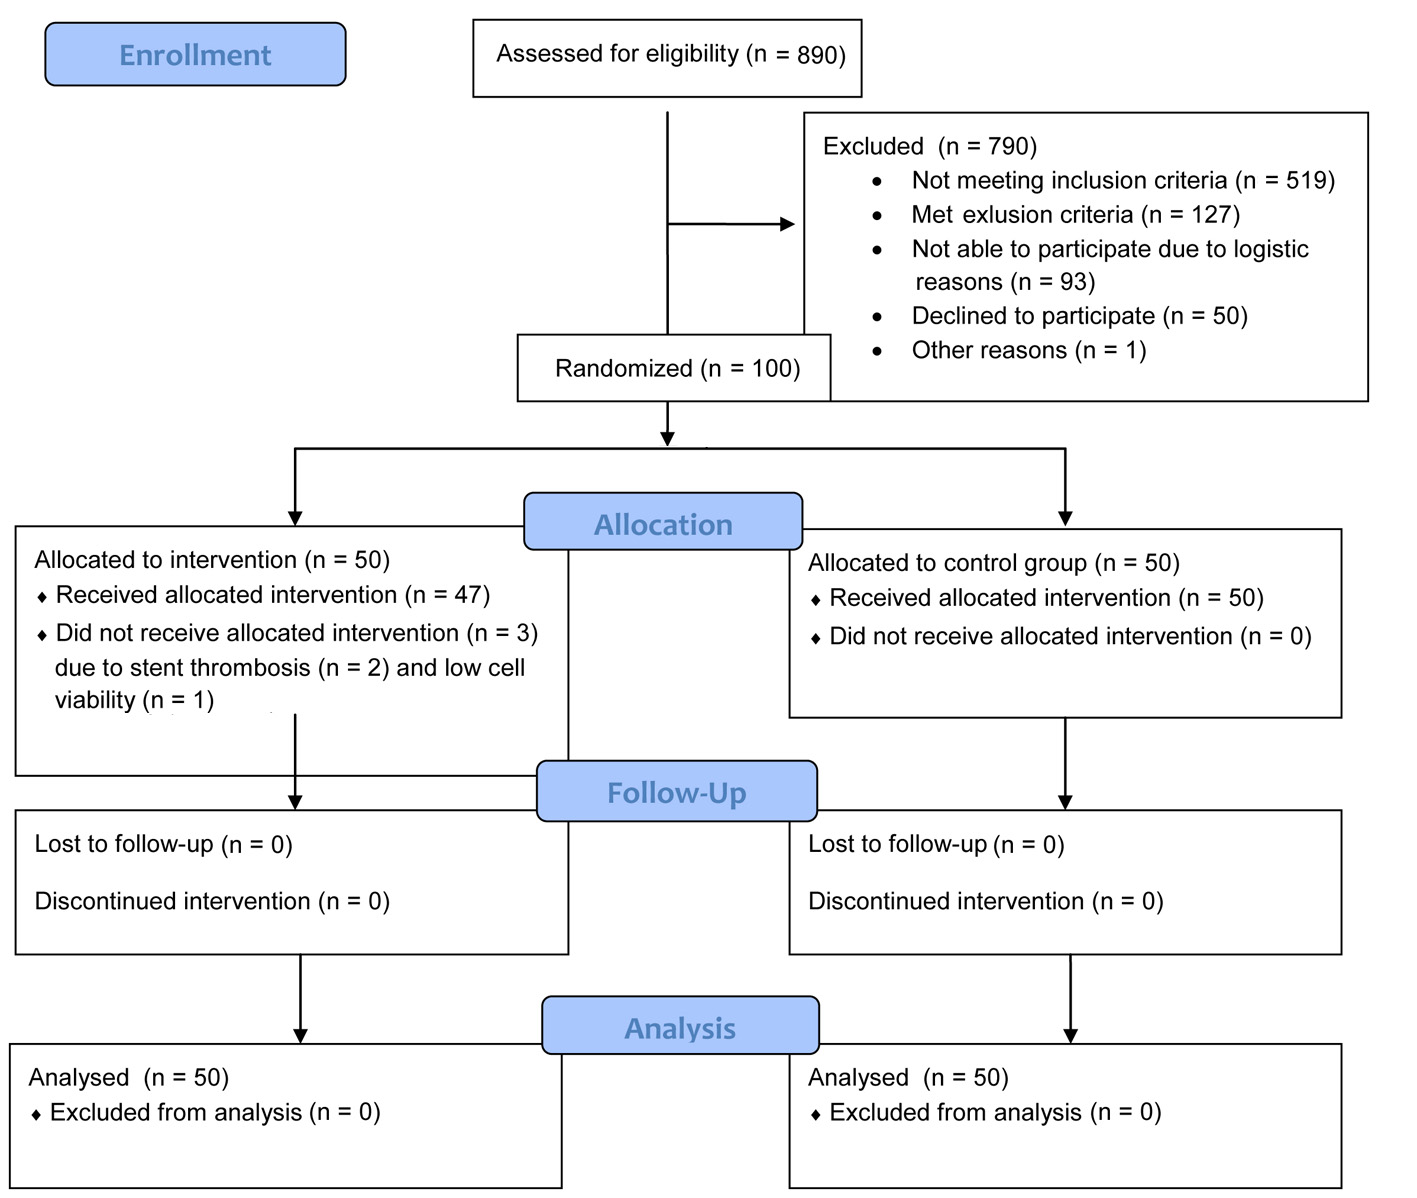
Figure 1. Flow diagram.
| Cardiology Research, ISSN 1923-2829 print, 1923-2837 online, Open Access |
| Article copyright, the authors; Journal compilation copyright, Cardiol Res and Elmer Press Inc |
| Journal website https://www.cardiologyres.org |
Original Article
Volume 6, Number 1, February 2015, pages 209-215
The Effect of Intracoronary Stem Cell Injection on Markers of Leukocyte Activation in Acute Myocardial Infarction
Figures
Tables
| mBMC group (n = 50) | Control group (n = 50) | |
|---|---|---|
| Values are given as mean (SD), proportions (n), medians (25, 75 percentiles) or percent (%). ACE-I: angiotensin-converting-enzyme inhibitor; ATII antagonist: antiotensin II antagonist; WBC: white blood cell. | ||
| Age | 58.1 (8.5) | 56.7 (9.6) |
| Sex (n of males) | 42 | 42 |
| Hypertension (n) | 17 | 17 |
| Diabetes (n) | 5 | 4 |
| Smokers (n) | 20 | 40 |
| BMI (kg/m2) | 26.3 (3.9) | 27.1 (3.5) |
| Total cholesterol (mmol/L) | 4.4 (3.7 - 5.1) | 4.5 (3.8 - 4.9) |
| LDL cholesterol (mmol/L) | 2.9 (2.3 - 3.5) | 2.9 (2.4 - 3.3) |
| HDL cholesterol (mmol/L) | 1.0 (0.8 - 1.2) | 1.0 (0.9 - 1.3) |
| Triglycerides (mmol/L) | 1.3 (1.0 - 1.7) | 1.3 (1.1 - 1.5) |
| LVEF (%) | 43 (35, 48) | 44 (34 - 49) |
| Peak CKMB (ng/L) | 400 (220.5 - 447.0) | 357 (205.0 - 423.0) |
| Baseline WBC count (109/L) | 8.1 (6.8 - 9.6) | 8.4 (7.1 - 8.9) |
| Baseline neutrophile count (109/L) | 4.6 (3.8 - 5.9) | 4.8 (4.1 - 5.9) |
| Medication at discharge | ||
| Aspirin (%) | 100 | 100 |
| Clopidogrel (%) | 100 | 100 |
| ACE-I/ATII antagonist (%) | 100 | 98 |
| Beta blocker (%) | 100 | 100 |
| Statin (%) | 100 | 100 |
| Diuretics (%) | 42 | 32 |
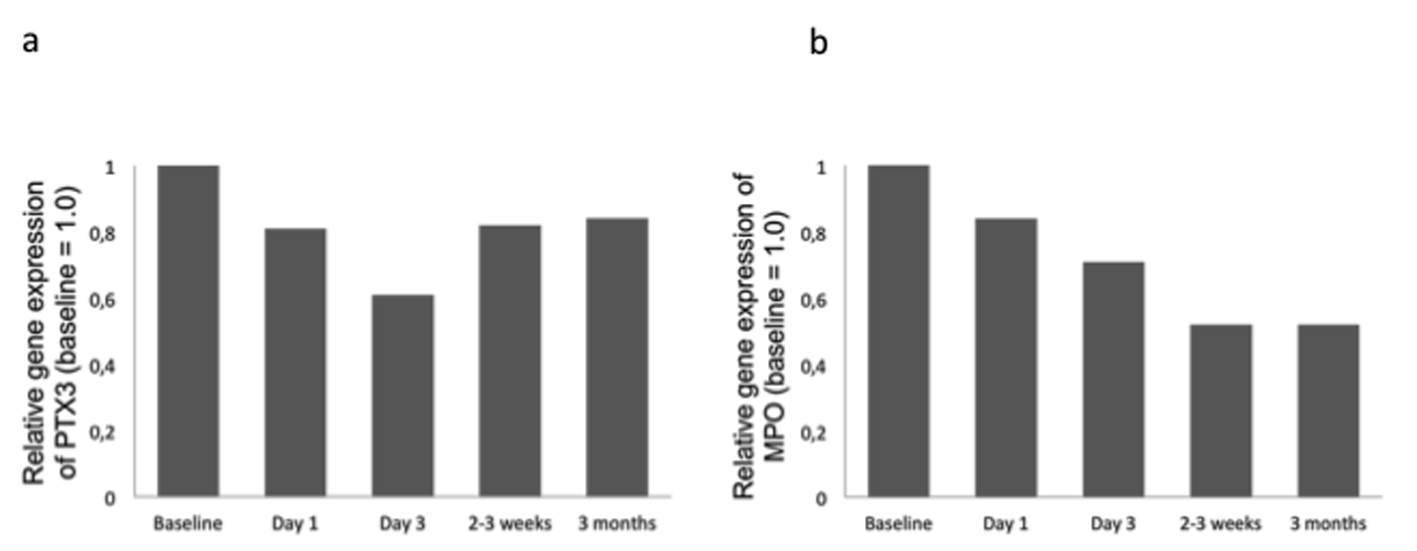
| Baseline | Day 1 | Day 3 | 2 - 3 weeks | 3 months | |
|---|---|---|---|---|---|
| Values are given as median (25, 75 pencentiles).§Difference in relative change from baseline (P < 0.05) between the groups. *Change from baseline (P < 0.05) within the respective treatment groups. | |||||
| PTX3 (ng/mL) | |||||
| mBMC group | 0.92 (0.67 - 1.38) | 0.91§ (0.68 - 1.41) | 0.84* (0.50 - 1.28) | 0.74* (0.45 - 1.31) | 0.62* (0.46 - 1.19) |
| Control group | 1.18 (0.71 - 1.33) | 0.76* (0.49 - 1.17) | 0.73* (0.47 - 1.06) | 0.68* (0.42 - 1.10) | 0.68* (0.35 - 1.06) |
| MPO (ng/mL) | |||||
| mBMC group | 80 (60 - 120) | 82* (60 - 106) | 79 (57 - 106) | 71* (54 - 98) | 69* (49 - 92) |
| Control group | 79 (59 - 115) | 76 (54 - 101) | 75* (61 - 92) | 73* (53 - 83) | 64* (48 - 88) |
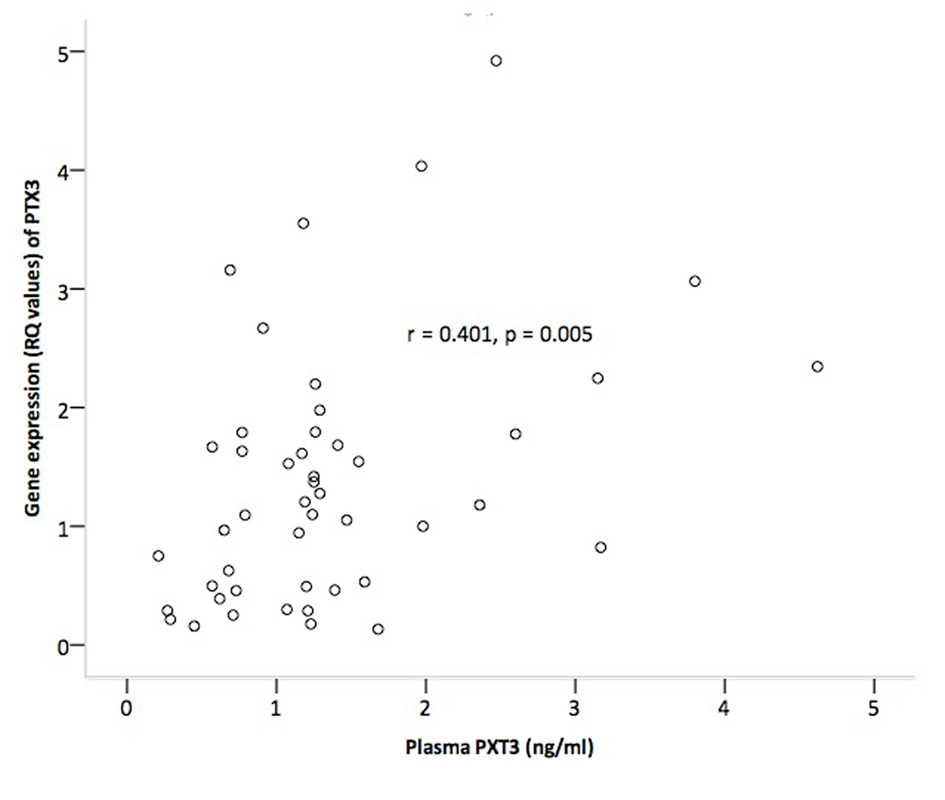
| Baseline PTX3 | Baseline MPO | |||
|---|---|---|---|---|
| r | P | r | P | |
| §SPECT. *Proportion of LAD perfusion area. | ||||
| Baseline LVEF§ | -0.110 | 0.290 | -0.229 | 0.025 |
| Infarct size* | -0.014 | 0.892 | 0.101 | 0.323 |
| Peak CKMB | 0.037 | 0.720 | 0.200 | 0.05 |