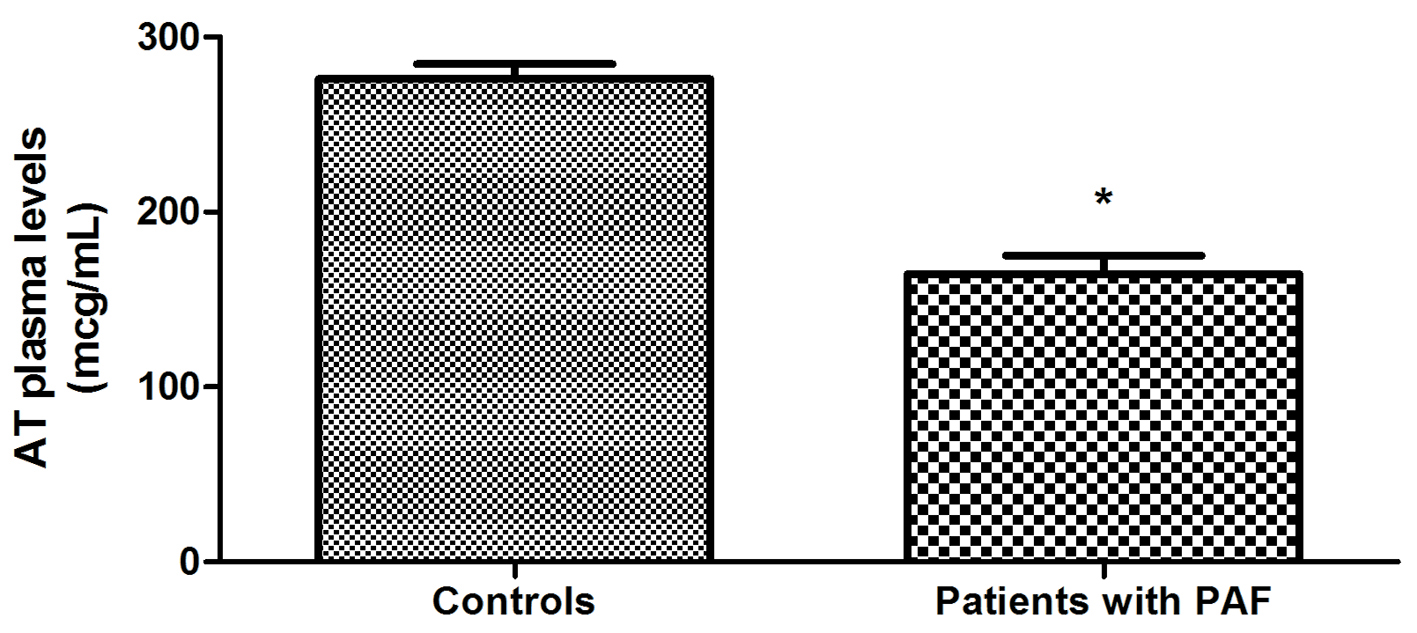
Figure 1. Comparison of AT plasma levels in patients with PAF and controls in sinus rhythm (*P < 0.001).
| Cardiology Research, ISSN 1923-2829 print, 1923-2837 online, Open Access |
| Article copyright, the authors; Journal compilation copyright, Cardiol Res and Elmer Press Inc |
| Journal website https://www.cardiologyres.org |
Original Article
Volume 7, Number 3, June 2016, pages 89-94
Early Changes in the Antithrombin and Thrombin-Antithrombin Complex in Patients With Paroxysmal Atrial Fibrillation
Figures
Tables
| Patients with PAF | Control group | P values | |
|---|---|---|---|
| *Less than 0.5 pack (10 cigarettes)/week. Hospitalized patients had not smoked at least 24 h prior to the arrhythmia. Data from controls were taken after a 48-h non-smoking period. **No more than 2 drinks/week. Hospitalized patients had at least a 48-h period without alcohol prior to the arrhythmia. Data from controls were taken after a 48-h period without alcohol. | |||
| Number of participants in the group | 51 | 52 | 0.89 |
| Mean age (years) | 59.84 ± 1.60 | 59.50 ± 1.46 | 0.87 |
| Men/women | 26/25 | 26/26 | 1/0.93 |
| Accompanying diseases | |||
| Hypertension | 37 (72.54%) | 34 (65.38%) | 0.44 |
| Diabetes mellitus type 2 | 3 (5.88%) | 2 (3.84%) | 0.62 |
| Chronic ulcer disease | 2 (3.92%) | 0 | 0.15 |
| Status after hysterectomy | 2 (3.92%) | 1 (1.92%) | 0.54 |
| Benign prostatic hyperthrophy | 1 (1.96%) | 0 | 0.32 |
| Dyslipidemia | 4 (7.84%) | 3 (5.77%) | 0.69 |
| Medicaments for hypertension and dyslipidemia | |||
| Beta blockers | 19 (37.25%) | 17 (32.69%) | 0.62 |
| ACE inhibitors | 15 (29.41%) | 14 (26.92%) | 0.78 |
| Sartans | 11 (21.57%) | 9 (17.31%) | 0.58 |
| Statins | 4 (7.84%) | 3 (5.77%) | 0.69 |
| Deleterious habits | |||
| Smoking* | 8 (15.69%) | 7 (13.46%) | 0.75 |
| Alcohol intake** | 7 (13.72%) | 6 (11.53%) | 0.74 |
| BMI (kg/m2) | 23.85 ± 0.46 | 24.95 ± 0.45 | 0.09 |
| Echocardiographic indicators | Patients with PAF | Control group | P values |
|---|---|---|---|
| LVEDD: left ventricular end-diastolic diameter; LVESD: left ventricular end-systolic diameter; EF: ejection fraction; IVS: interventricular septum; PW: posterior wall; LA: left atrium; RVEDD: right ventricular end-diastolic volume. | |||
| LVEDD (mm) | 52.57 ± 0.58 | 52.29 ± 0.57 | 0.73 |
| LVESD (mm) | 34.43 ± 0.56 | 34.73 ± 0.48 | 0.69 |
| EF (%) | 62.98 ± 0.70 | 61.54 ± 0.58 | 0.12 |
| IVS (mm) | 10.37 ± 0.23 | 9.92 ± 0.26 | 0.20 |
| PW (mm) | 10.24 ± 0.21 | 9.73 ± 0.28 | 0.16 |
| LA volume (mL/m2) | 22.81 ± 0.45 | 23.82 ± 0.48 | 0.13 |
| RVEDD (mm) | 30.54 ± 1.58 | 29.17 ± 1.52 | 0.18 |