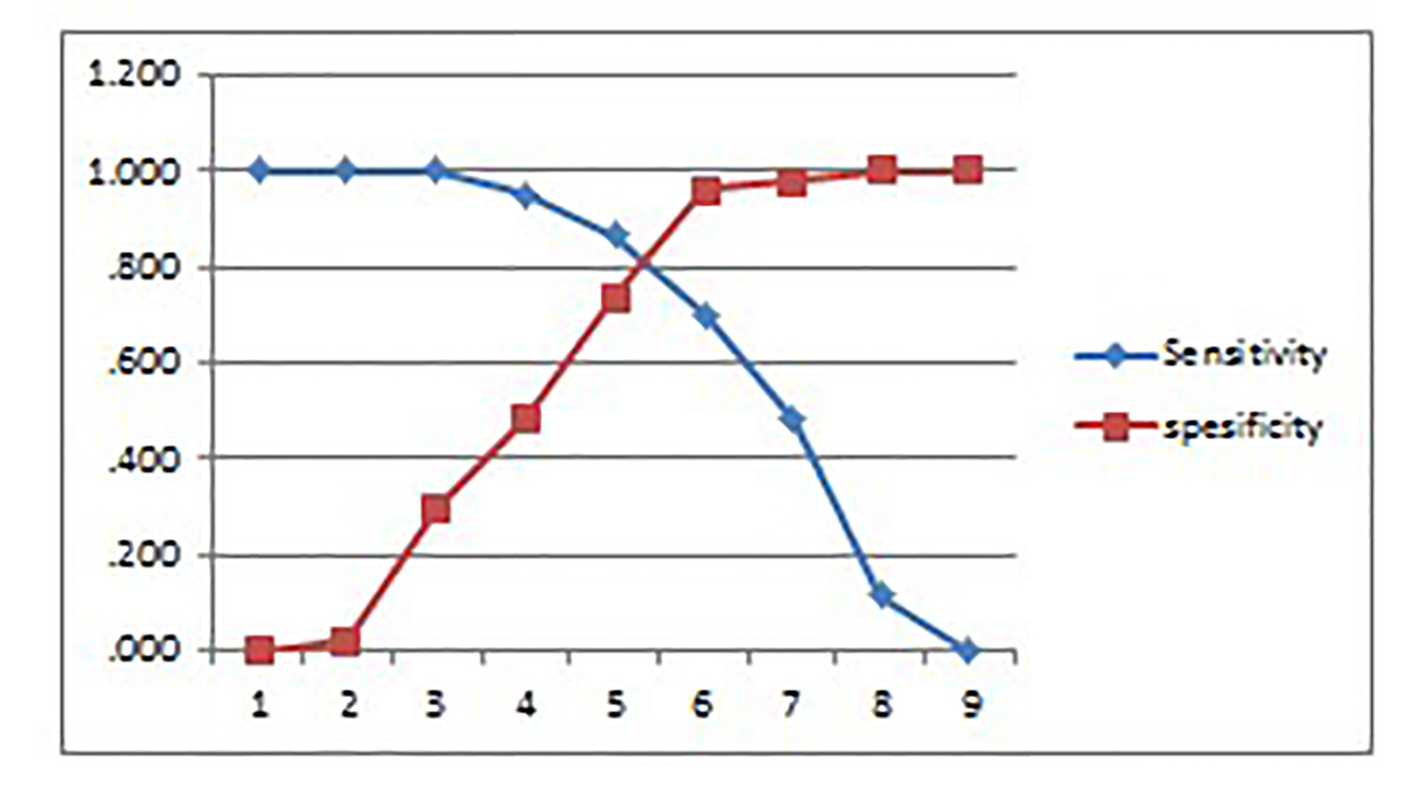
Figure 1. The sensitivity and specificity based on a cut-off point derived from the ROC curve analysis.
| Cardiology Research, ISSN 1923-2829 print, 1923-2837 online, Open Access |
| Article copyright, the authors; Journal compilation copyright, Cardiol Res and Elmer Press Inc |
| Journal website https://www.cardiologyres.org |
Original Article
Volume 7, Number 3, June 2016, pages 110-116
Scoring System Based on Electrocardiogram Features to Predict the Type of Heart Failure in Patients With Chronic Heart Failure
Figure
Tables
| Variable | HFpEF (n = 50) | HFrEF (n = 60) | Total (n = 110) | P |
|---|---|---|---|---|
| HFpEF: heart failure preserved ejection fraction; HFrEF: heart failure reduced ejection fraction; DM: diabetes mellitus; ACE-I: angiotensin converting enzyme inhibitor; ARB: angiotensin receptor blocker; CCB: calcium channel blocker. | ||||
| Age, years (± SD) | 59.7 ± 9.2 | 57.9 ± 10.1 | 58.6 ± 9.9 | 0.29 |
| Sex | 0.003 | |||
| Male, n (%) | 28 (56) | 49 (81.7) | 77 (70) | |
| Female, n (%) | 22 (44) | 11 (18.3) | 33 (30) | |
| Risk factor | ||||
| Hypertension, n (%) | 46 (92) | 39 (65) | 85 (77.2) | 0.001 |
| DM, n (%) | 19 (38) | 13 (21.7) | 32 (29.1) | 0.06 |
| Smoker, n (%) | 11 (22) | 29 (48.3) | 40 (36.3) | 0.004 |
| Therapy | ||||
| ACE-I/ARB, n (%) | 50 (100) | 60 (100) | 110 (100) | 1.000 |
| Diuretic, n (%) | 37 (74) | 57 (95) | 94 (85.4) | 0.002 |
| Beta blocker, n (%) | 21 (42) | 30 (50) | 51 (46.3) | 0.042 |
| CCB, n (%) | 22 (44) | 6 (10) | 28 (25.4) | < 0.0001 |
| Variables | HFpEF (n = 50) | HFrEF (n = 60) | P |
|---|---|---|---|
| LA: left atrium; LVIDd: left ventricular internal diameter end diastole; IVSd: Interventricular septal end diastole; EF: ejection fraction; LVMI: left ventricular mass index; LAVI: left atrial volume index; DT: deceleration time; TAPSE: tricuspid annular plane systolic excursion; RVSP: right ventricle systolic pressure. | |||
| LA diameter, mm (± SD) | 34.3 ± 5.2 | 41.5 ± 6.2 | < 0.0001 |
| LVIDd, mm (± SD) | 49.2 ± 7.1 | 64.9 ± 7.9 | < 0.0001 |
| IVSd, mm (± SD) | 12.5 ± 2.1 | 10.3 ± 2.6 | < 0.0001 |
| EF Simpson, % (± SD) | 59.2 ± 8.5 | 29.4 ± 6.8 | < 0.0001 |
| LVMI, g/m2 (± SD) | 133.3 ± 40.2 | 170.3 ± 46.7 | < 0.0001 |
| Septal e’ | 5.09 ± 1.1 | 4.3 ± 1.2 | < 0.0001 |
| Lateral e’ | 6.21 ± 1.6 | 5.6 ± 2.5 | 0.146 |
| LAVI, mL/m2 (± SD) | 34.5 ± 4.3 | 47.1 ± 14.4 | < 0.0001 |
| E/A ratio | 0.77 ± 0.2 | 1.8 ± 1.2 | < 0.0001 |
| DT, ms (± SD) | 234 ± 53.3 | 158.4 ± 52.8 | < 0.0001 |
| Diastolic dysfunction | 1.000 | ||
| Relaxation, n | 39 | 16 | |
| Pseudonormal, n | 11 | 15 | |
| Restrictive, n | 0 | 29 | |
| TAPSE, mm (± SD) | 23.2 ± 3.1 | 18.1 ± 4.3 | < 0.0001 |
| RVSP, mm Hg (± SD) | 6.64 ± 9.1 | 26.8 ± 22.6 | < 0.0001 |
| Myocard kinetic disturbance | < 0.0001 | ||
| Yes | 15 | 60 | |
| No | 35 | 0 | |
| Heart rate, /min (± SD) | 71.8 ± 12.8 | 81.7 ± 15 | 0.135 |
| ECG parameter | HFpEF (n = 50) | HFrEF (n = 60) | Total (n = 110) | P |
|---|---|---|---|---|
| LAH: left atrial hypertrophy; LVH: left ventricular hypertrophy; LAD: left axis deviation; RAD: right axis deviation; LBBB: left bundle branch block; RBBB: right bundle branch block. | ||||
| LAH, n (%) | 6 (12) | 22 (36.7) | 28 (25.5) | 0.003 |
| LVH, n (%) | 15 (30) | 33 (55) | 48 (43.6) | 0.008 |
| Poor R wave, n (%) | 5 (10) | 30 (50) | 35 (31.8) | < 0.0001 |
| LAD, n (%) | 15 (30) | 27 (45) | 42 (38.2) | 0.107 |
| RAD, n (%) | - | 3 (5) | 3 (2.7) | 0.249 |
| Q wave, n (%) | 9 (18) | 17 (28.3) | 26 (23.6) | 0.204 |
| Wide QRS, n (%) | 10 (20) | 43 (71.7) | 53 (48.2) | < 0.0001 |
| QRS duration, ms (± SD) | 97.3 ± 20.7 | 124 ± 30.4 | ||
| LBBB, n (%) | - | 12 (20) | 12 (10.9) | 0.001 |
| RBBB, n (%) | 7 (14) | 3 (5) | 10 (9.1) | 0.181 |
| ST-T changes, n (%) | 19 (38) | 42 (70) | 61 (55.4) | 0.001 |
| Prolong QT, n (%) | 19 (38) | 50 (83.3) | 69 (62.7) | < 0.0001 |
| Interval QTc, ms (± SD) | 453.2 ± 42.8 | 499 ± 50.9 | ||
| ECG parameter | OR | IK 95% | P |
|---|---|---|---|
| *Statistically significant. #n.a. LAH: left atrial hypertrophy; LVH: left ventricular hypertrophy; LAD: left axis deviation; RAD: right axis deviation; LBBB: left bundle branch block; RBBB: right bundle branch block. | |||
| LVH | 1.24 | 0.284 - 5.407 | 0.774 |
| Poor R wave | 2.004 | 0.423 - 9.494 | 0.381 |
| LAD | 0.661 | 0.161 - 2.708 | 0.565 |
| RAD | # | # | # |
| Q wave | 3.756 | 0.947 - 14.891 | 0.060 |
| LBBB | # | # | # |
| LAH | 4.449 | 1.109 - 17.848 | 0.035* |
| Wide QRS | 12.657 | 3.277 - 48.895 | < 0.0001* |
| RBBB | 0.109 | 0.012 - 0.986 | 0.049* |
| ST-T changes | 4.35 | 1.277 - 14.817 | 0.019* |
| Prolong QT | 7.401 | 2.134 - 25.672 | 0.002* |
| ECG parameter | B | SE | B/SE | (B/SE)/x | Score |
|---|---|---|---|---|---|
| LAH: left atrial hypertrophy; RBBB: right bundle branch block. | |||||
| LAH | 1.493 | 0.709 | 2.105 | 1.068 | 1 |
| Wide QRS | 2.538 | 0.69 | 3.678 | 1.865 | 2 |
| RBBB | -2.214 | 1.123 | -1.971 | -1 | -1 |
| ST-T changes | 1.47 | 0.625 | 2.352 | 1.192 | 1 |
| Prolong QT | 2.002 | 0.635 | 3.152 | 1.599 | 2 |
| Score | Probability (%) |
|---|---|
| -1 | 0.9 |
| 0 | 3.16 |
| 1 | 10.4 |
| 2 | 29.3 |
| 3 | 59.6 |
| 4 | 84 |
| 5 | 94.9 |
| 6 | 98.5 |
| No. | Positive if greater than or equal to | Sensitivity | 1 - specificity | Sensitivity | Specificity |
|---|---|---|---|---|---|
| 1 | -2.0000 | 1.000 | 1.000 | 1.000 | 0.000 |
| 2 | -0.5000 | 1.000 | 0.980 | 1.000 | 0.020 |
| 3 | 0.5000 | 1.000 | 0.700 | 1.000 | 0.300 |
| 4 | 1.5000 | 0.950 | 0.520 | 0.950 | 0.480 |
| 5 | 2.5000 | 0.867 | 0.260 | 0.867 | 0.740 |
| 6 | 3.5000 | 0.700 | 0.040 | 0.700 | 0.960 |
| 7 | 4.5000 | 0.483 | 0.020 | 0.483 | 0.980 |
| 8 | 5.5000 | 0.117 | 0.000 | 0.117 | 1.000 |
| 9 | 7.0000 | 0.000 | 0.000 | 0.000 | 1.000 |
| Scoring system | ECHO (gold standard) | |
|---|---|---|
| HFrEF (EF ≤ 40%) | HFpEF (EF > 40%) | |
| HFpEF: heart failure preserved ejection fraction; HFrEF: heart failure reduced ejection fraction. | ||
| HFrEF (+4 SD +6) | 19 | 1 |
| HFpEF (-1 SD +3) | 6 | 24 |