Figures
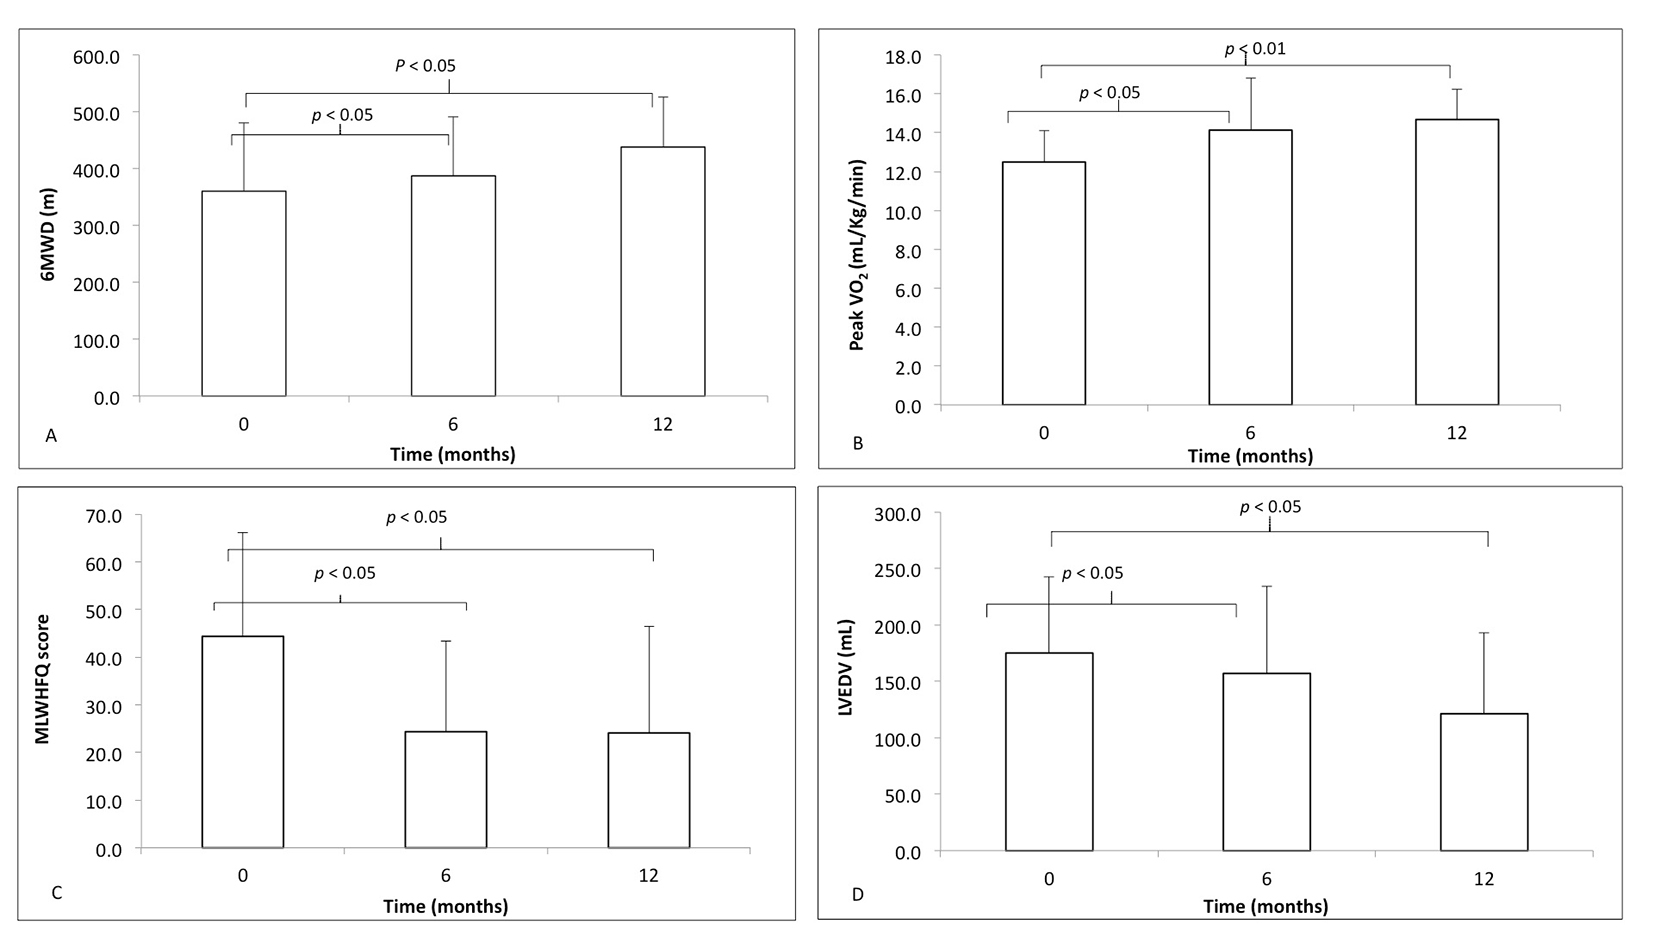
Figure 1. The markers of response to cardiac resynchronization therapy, at time zero (baseline) before implantation, 6 and 12 months following CRT implantation in responders (white): (A) 6-minute walk distance (6MWD); (B) peak VO2; (C) Minnesota Living With Heart Failure Questionnaire (MLWHFQ) score; (D) left ventricular end-diastolic volume (LVEDV). Differences in data from baseline to 6 and 12 months compared using one-way ANOVA with repeated measures.
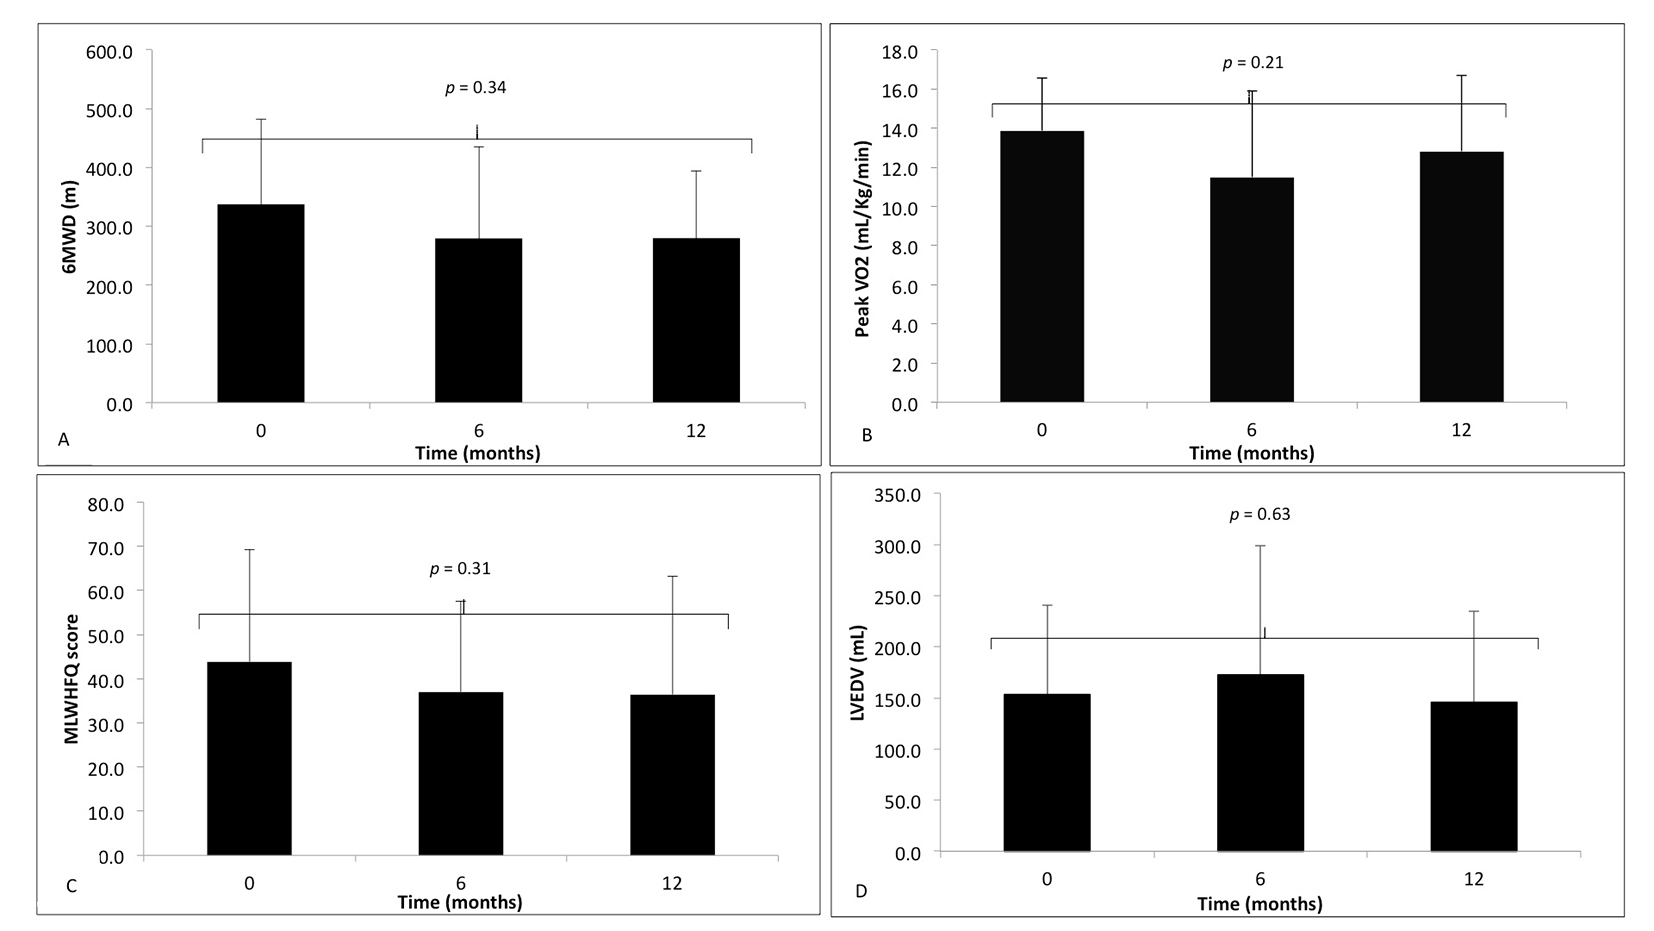
Figure 2. The markers of response to cardiac resynchronization therapy, at time zero (baseline) before implantation, 6 and 12 months following CRT implantation in non-responders (black). (A) 6-minute walk distance (6MWD); (B) peak VO2; (C) Minnesota Living With Heart Failure Questionnaire (MLWHFQ) score; (D) left ventricular end-diastolic volume (LVEDV). Data during follow-up compared using one-way ANOVA with repeated measures, with no significant difference.
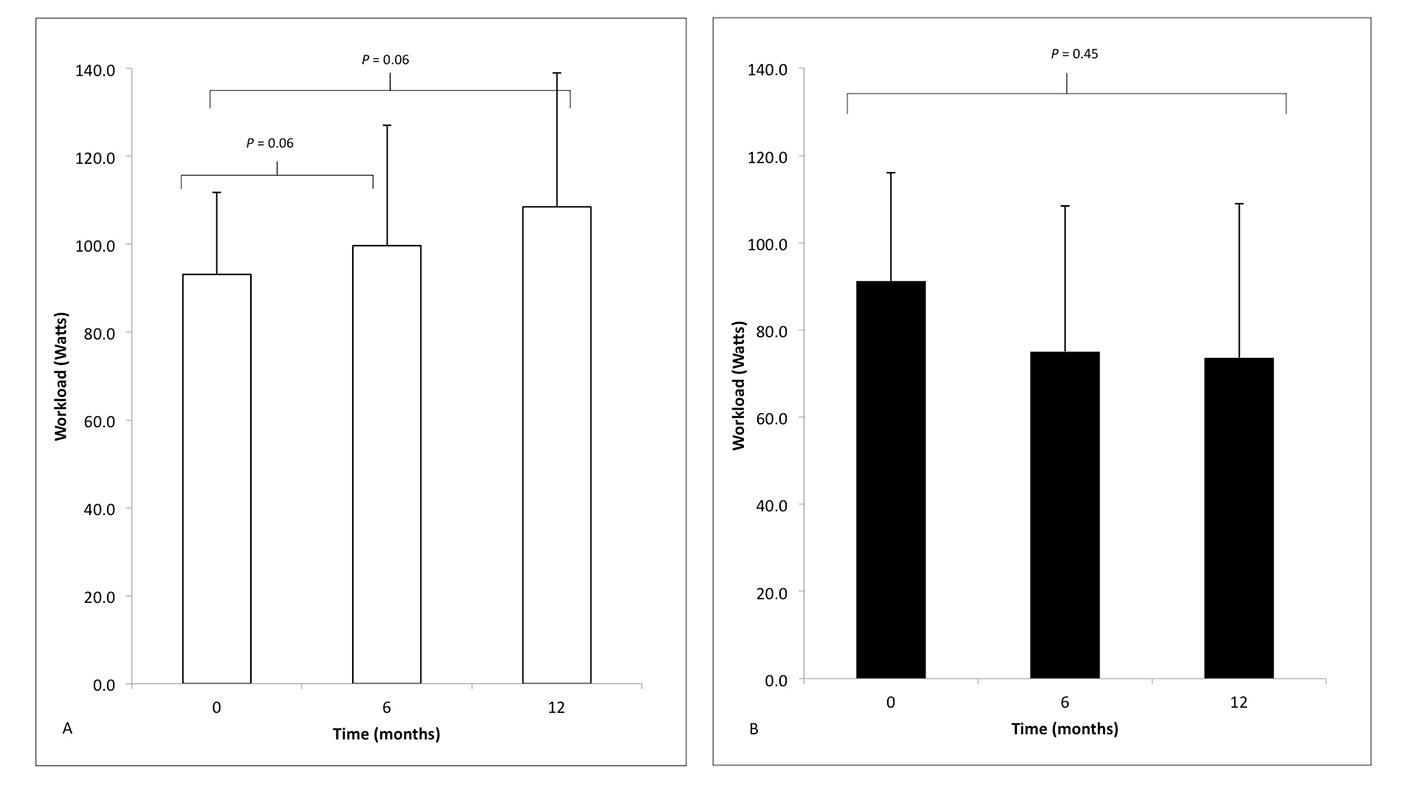
Figure 3. The peak workload (watts) measured during cardiopulmonary exercise testing in (A) responders (white) and (B) non-responders (black) at time zero (baseline) before implantation and then 6 and 12 months following CRT, compared using one-way ANOVA with repeated measures.
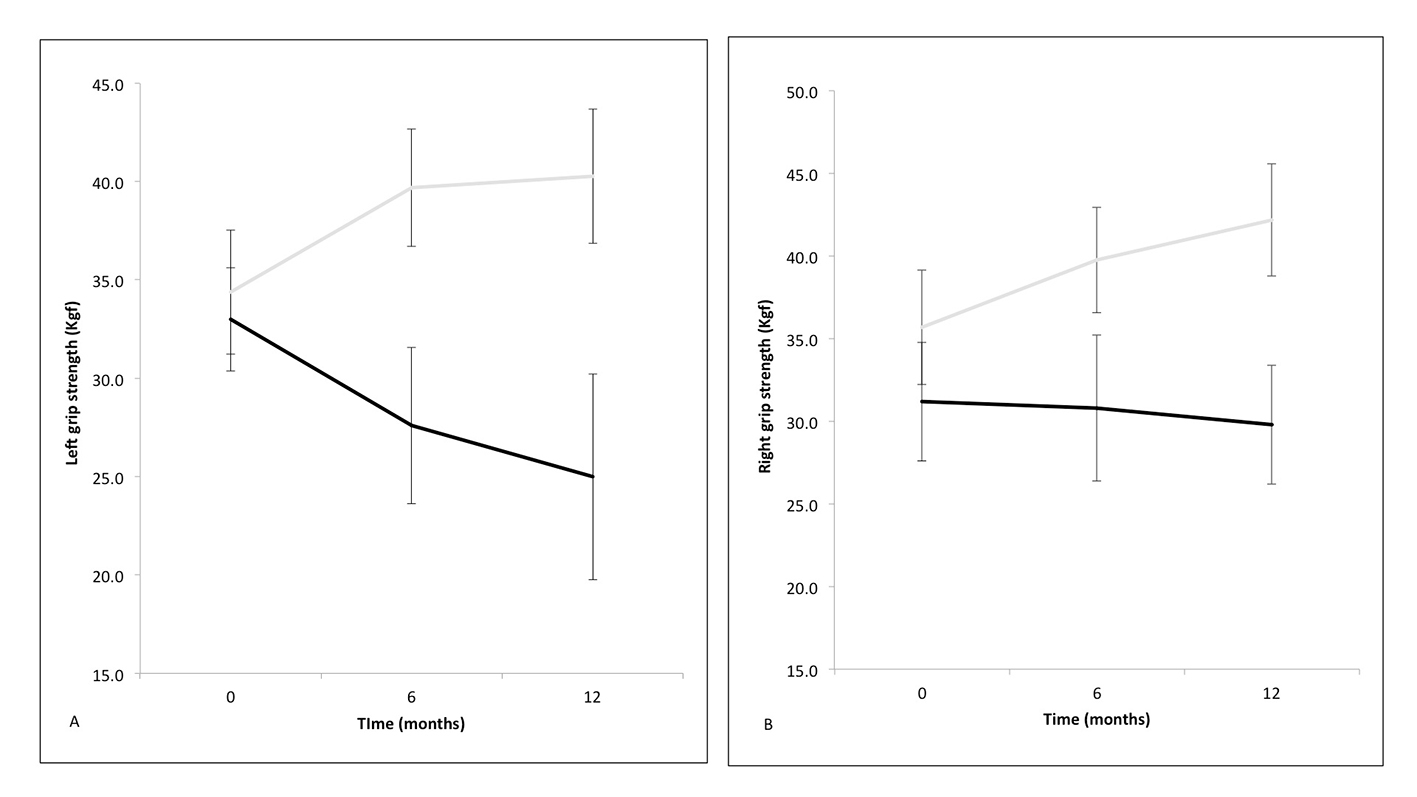
Figure 4. Mean handgrip strength in the left (A) and right hand (B) at zero (baseline), 6 and 12 months following cardiac resynchronization therapy (responders in solid gray line and non-responders in solid black line) with standard error bars.
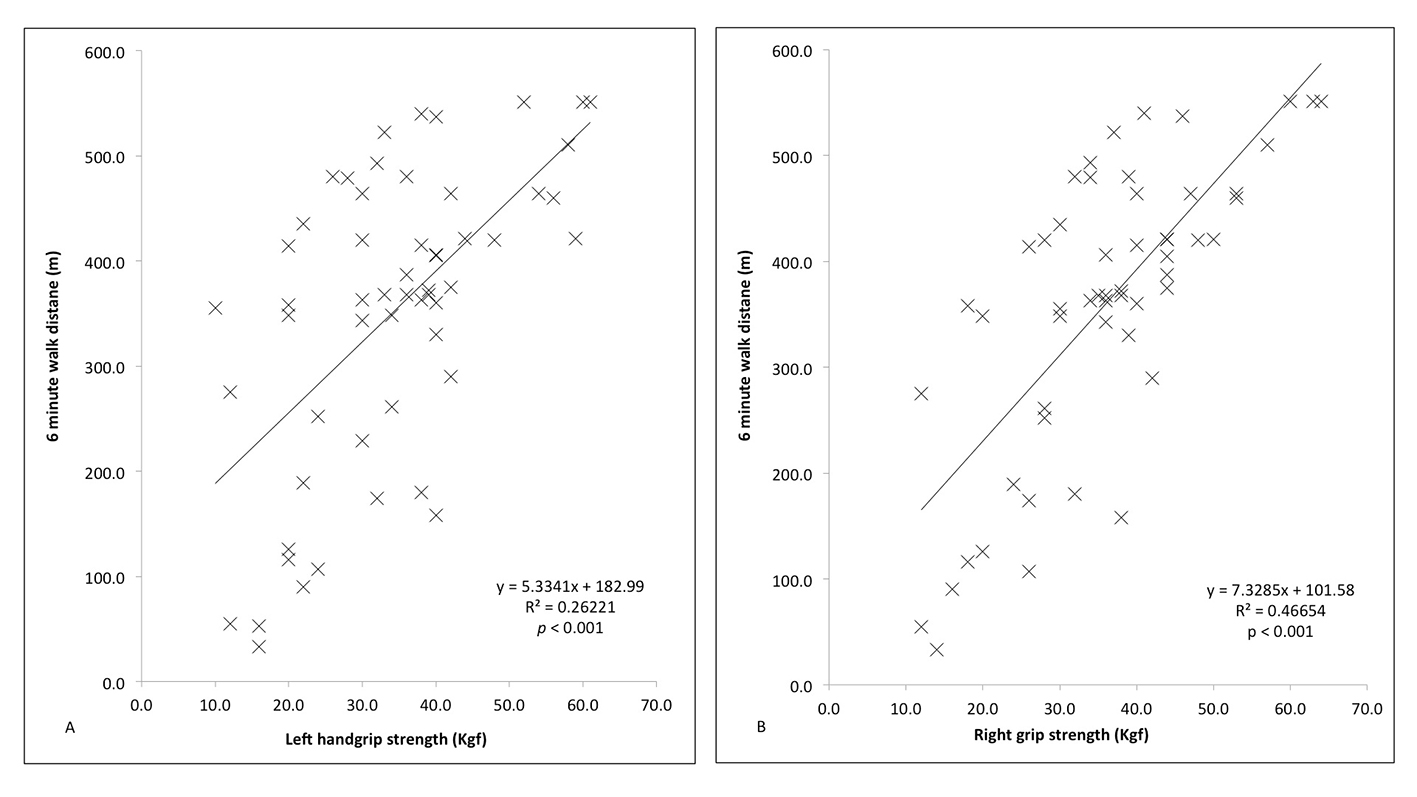
Figure 5. Correlation between handgrip strength (right and left) and 6-minute walk distance (6MWD) in the left (A) and right (B) hands both responders and non-responders, compared using Pearson’s correlation coefficient.
Tables
Table 1. Baseline Characteristics of Responders and Non-Responders Pre-CRT Implantation
| Responders (N = 14) | Non-responders (N = 5) | P value |
|---|
| Mean or number given in right hand column and % or SD given in left hand column. ^Comparisons between groups analyzed using two-tailed unpaired Student’s t-test unless categorical data (*) compared using Fisher’s exact test. ACE: angiotensin converting enzyme inhibitor; ARB: angiotensin receptor blocker; CRT: cardiac resynchronization therapy; ECG: electrocardiography; EF: ejection fraction; LVEDV: left ventricular end-diastolic volume; QRSd: QRS duration. |
| Demographics | | | | | |
| Age (years) | 68.4 | 9.8 | 71.8 | 4.2 | 0.53 |
| Gender (male) | 13 | 93% | 5 | 100% | 0.99* |
| Handedness (right) | 14 | 100% | 5 | 100% | 0.99* |
| Body mass index (kg/m2) | 29.6 | 3.98 | 26.5 | 4.41 | 0.18 |
| Ischemic heart disease | 8 | 57% | 3 | 60% | 0.99* |
| Hypercholesterolemia | 10 | 72% | 4 | 80% | 0.99* |
| Hypertension | 7 | 50% | 2 | 40% | 0.99* |
| Chronic kidney disease | 4 | 29% | 4 | 80% | 0.11* |
| Diabetes | 5 | 36% | 1 | 20% | 0.99* |
| ECG/echocardiography | | | | | |
| QRSd (ms) | 163.0 | 22.8 | 155.5 | 20.9 | 0.55 |
| EF (%) | 25.6 | 8.0 | 25.8 | 8.5 | 0.44 |
| Medications | | | | | |
| ACEI/ARB | 13 | 93% | 5 | 100% | 0.99* |
| Beta-blocker | 12 | 86% | 5 | 100% | 0.99* |
| Loop diuretic | 14 | 100% | 5 | 100% | 0.99* |
| Spironolactone | 9 | 64% | 4 | 80% | 0.99* |
| Markers of response | | | | | |
| 6MWD (m) | 374.0 | 112.8 | 337.0 | 144.7 | 0.23 |
| LVEDV (mL) | 201.5 | 72.5 | 159.0 | 80.8 | 0.37 |
| MLWHFQ | 44.4 | 22.9 | 52.8 | 22.7 | 0.33 |
| Peak VO2 (mL/kg/min) | 12.5 | 1.6 | 13.9 | 2.7 | 0.25 |
| Hand grip strength (kgf) | | | | | |
| Left | 34.4 | 11.4 | 33.0 | 5.3 | 0.42 |
| Right | 35.7 | 12.5 | 31.2 | 12.2 | 0.25 |
Table 2. Markers of Response at 0 (Baseline), 6 and 12 Months Follow-Up in Responders and Non-Responders
| Markers of response | Baseline, mean ± SD | 6 months, mean ± SD | 12 months, mean ± SD | One-way ANOVA with repeated measures P value |
|---|
| Baseline vs. 6 months | Baseline vs. 12 months |
|---|
| LVEDV: left ventricular end-diastolic volume; MLWHFQ: Minnesota Living With Heart Failure Questionnaire; 6MWD: 6-minute walk distance. |
| Responders (N = 14) | | | | | |
| 6MWD (m) | 374.0 ± 112.8 | 391.0 ± 108.1 | 418.1 ± 105.3 | < 0.05 | < 0.05 |
| LVEDV (mL) | 175.1 ± 67.2 | 157.0 ± 77.3 | 121.3 ± 72.0 | < 0.05 | < 0.05 |
| MLWHFQ/105 | 44.4 ± 22.9 | 24.4 ± 19.1 | 24.1 ± 21.3 | < 0.05 | < 0.05 |
| Peak VO2 (mL/kg/min) | 12.5 ± 1.6 | 14.1 ± 2.7 | 14.7 ± 1.5 | < 0.05 | < 0.01 |
| Non-responders (N = 5) | | | | | |
| 6MWD (m) | 337.0 ± 144.7 | 279.2 ± 155.5 | 279.6 ± 113.8 | 0.34 |
| LVEDV (mL) | 159.0 ± 80.8 | 172.4 ± 126.2 | 145.6 ± 88.8 | 0.63 |
| MLWHFQ/105 | 52.8 ± 22.7 | 37.0 ± 20.6 | 36.4 ± 26.7 | 0.31 |
| Peak VO2 (mL/kg/min) | 13.9 ± 2.7 | 11.5 ± 4.1 | 12.8 ± 3.9 | 0.21 |
Table 3. Handgrip Strength at 0 (Baseline), 6 and 12 Months Follow-Up in Responders and Non-Responders
| Handgrip strength | Baseline, mean ± SD | 6 months, mean ± SD | 12 months, mean ± SD | One way ANOVA with repeated measures P value |
|---|
| Baseline vs. 6 months | Baseline vs. 12 months |
|---|
| kgf: kilograms of force; SD: standard deviation. |
| Responders (N = 14) | | | | | |
| Left (kgf) | 34.4 ± 11.4 | 39.7 ± 10.8 | 40.3 ± 11.3 | < 0.01 | < 0.001 |
| Right (kgf) | 35.7 ± 12.5 | 39.8 ± 11.5 | 42.2 ± 11.2 | < 0.01 | < 0.001 |
| Non-responders (N = 5) | | | | | |
| Left (kgf) | 33.0 ± 5.3 | 27.6 ± 8.9 | 25.0 ± 11.7 | 0.30 |
| Right (kgf) | 31.2 ± 12.2 | 30.8 ± 9.9 | 29.8 ± 8.1 | 0.66 |