Cardiology Research, ISSN 1923-2829 print, 1923-2837 online, Open Access
Article copyright, the authors; Journal compilation copyright, Cardiol Res and Elmer Press Inc
Journal website https://www.cardiologyres.org

Original Article

Volume 8, Number 2, April 2017, pages 44-51


Left Ventricular Velocity of Propagation: A Useful Non-Invasive Measurement When Assessing Hemodynamic Alterations in Pulmonary Arterial Hypertension

Figures

Figure 1.
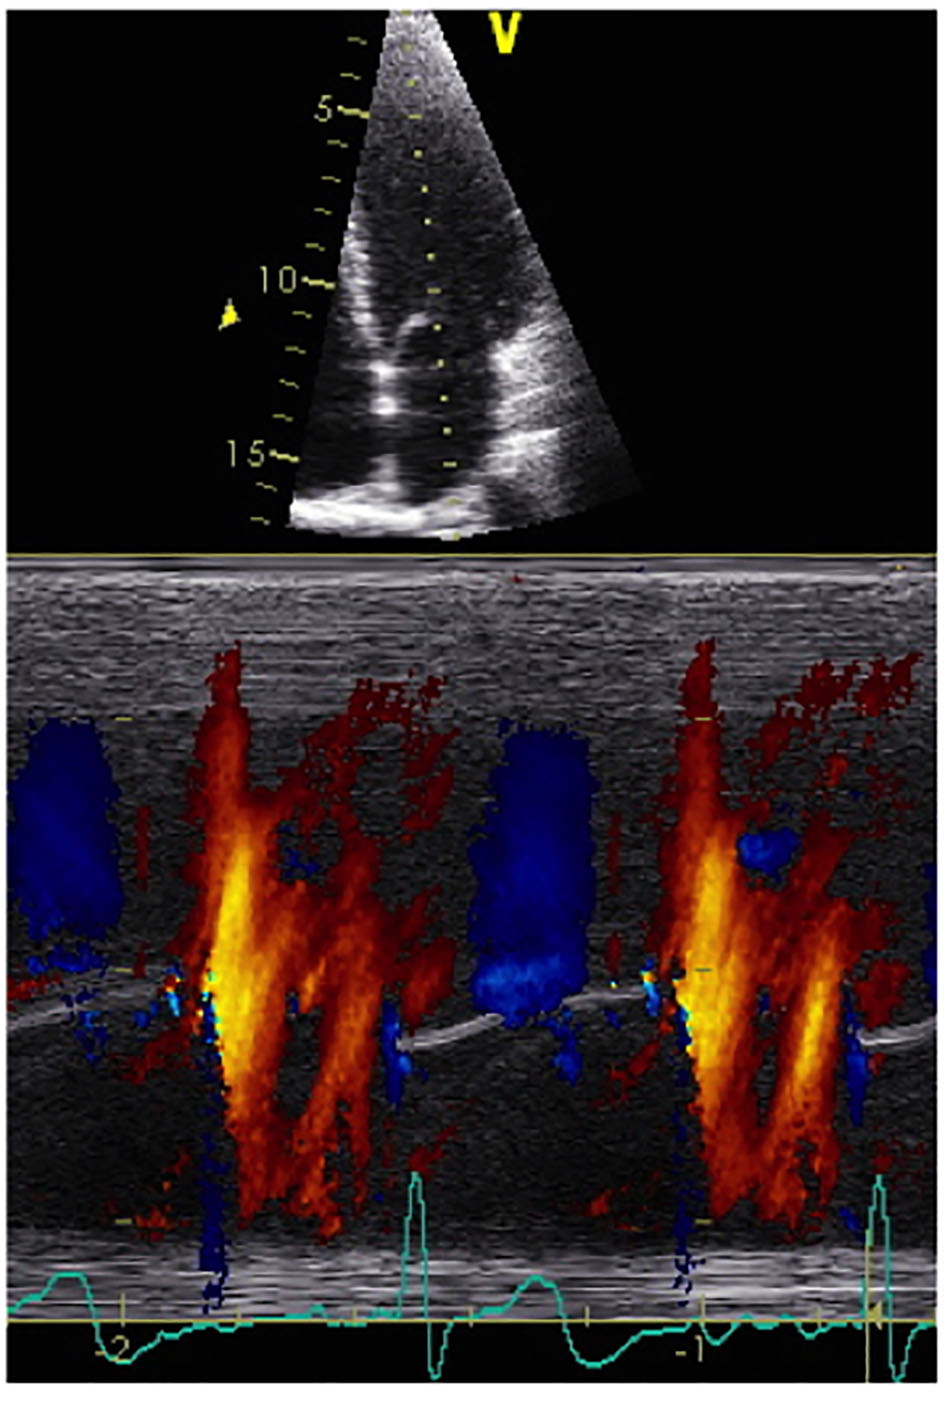
Figure 1. A representative normal color M-mode image is shown with a temporal resolution of approximately 5 ms, a spatial resolution (depth) of approximately 1 mm and a velocity resolution of approximately 4 cm/s, according to the Nyquist limit. The resultant spatio-temporal velocity information is expressed as a distance to time ratio more commonly expressed as cm/s.
Figure 2.
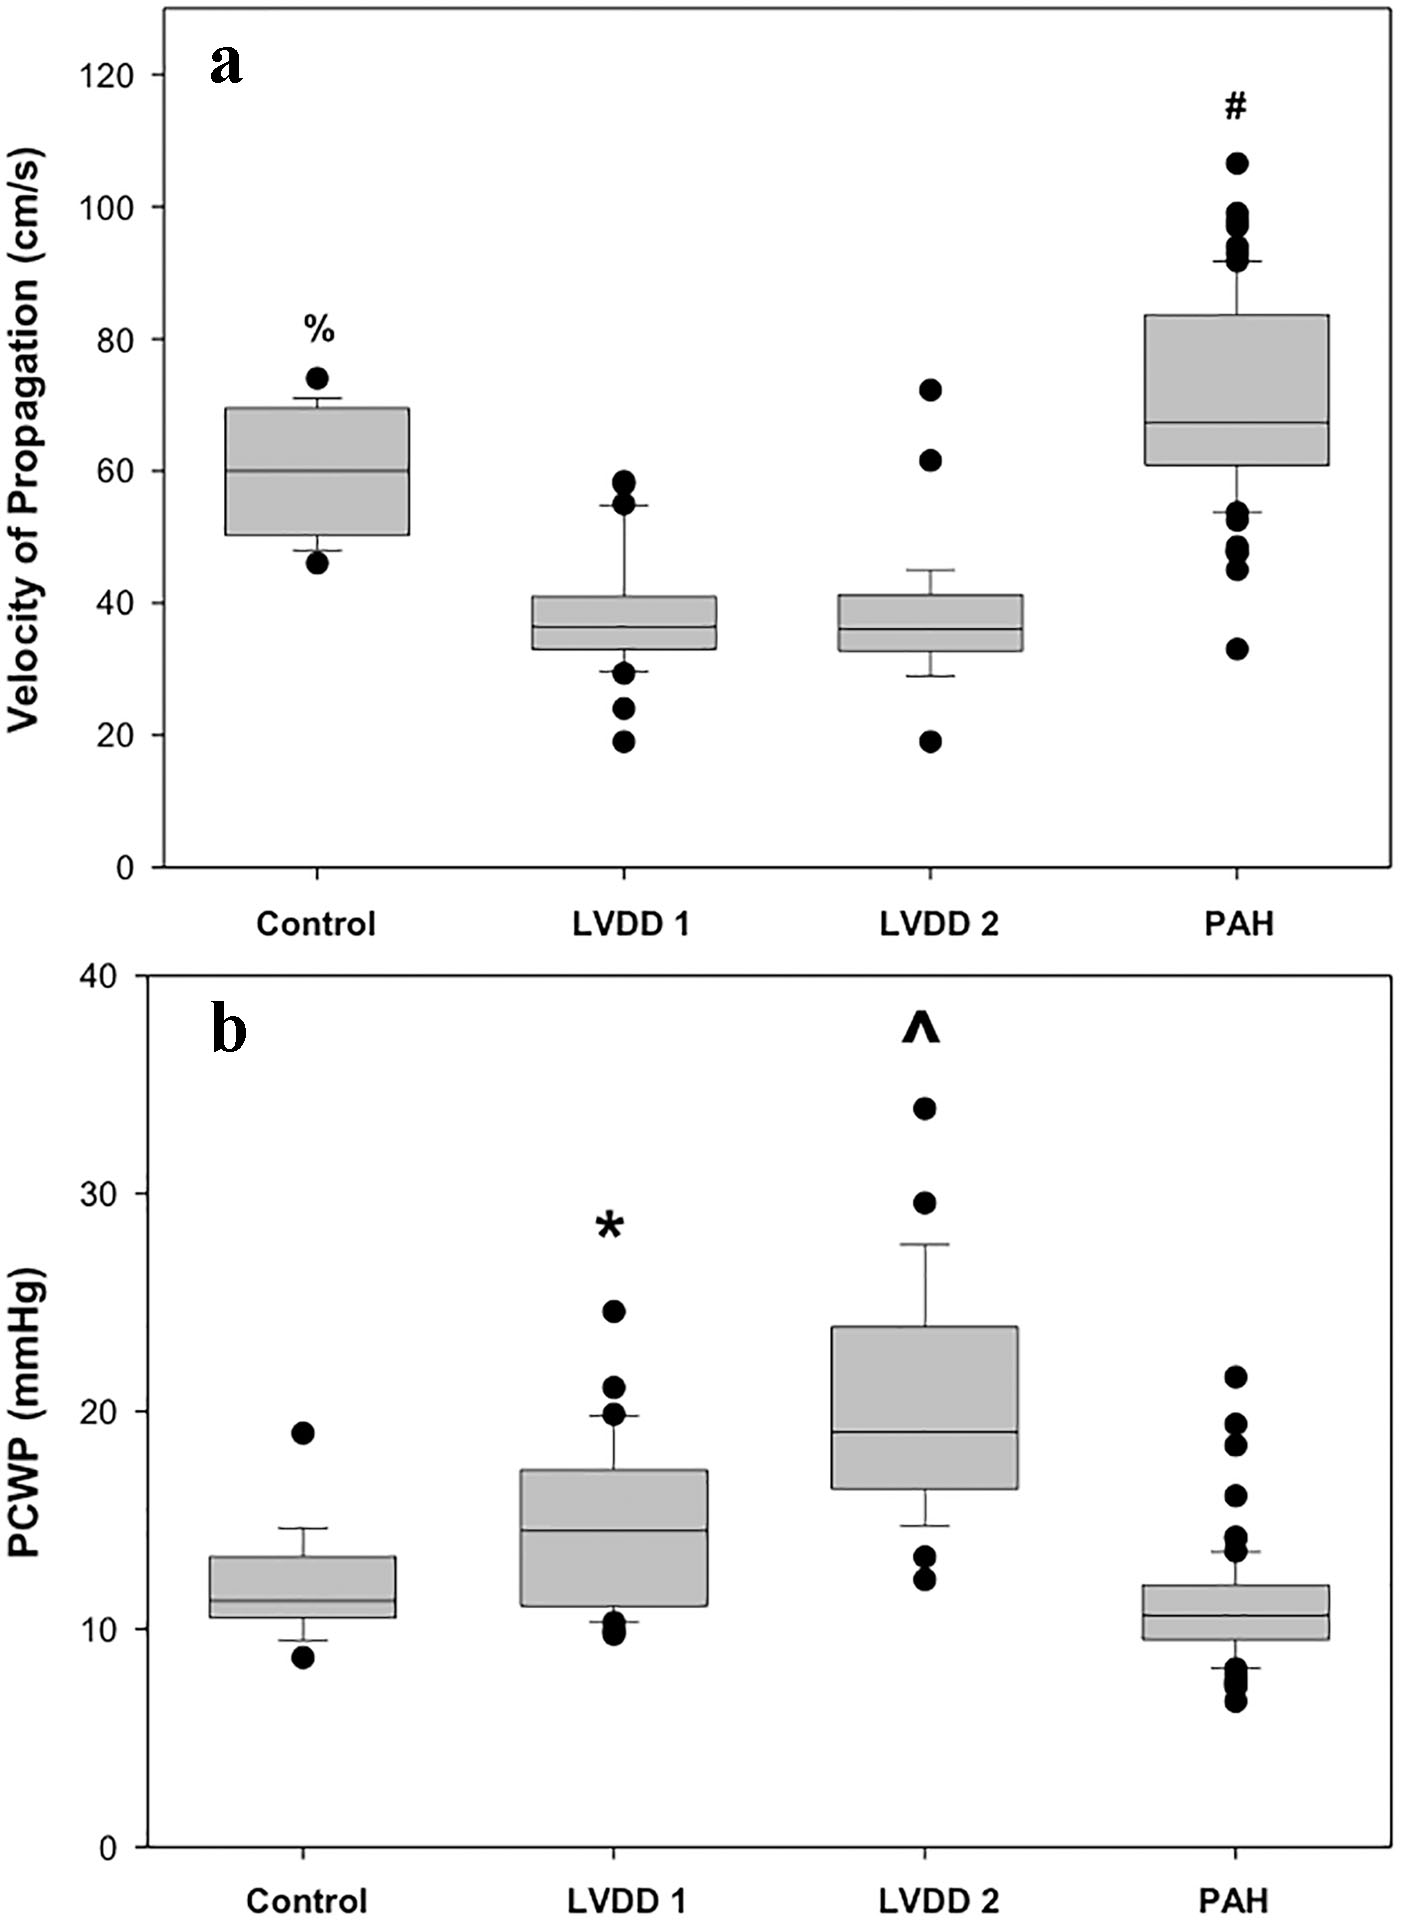
Figure 2. (a) Box plot representation of Vp values from all four groups. Bonferroni test indicates significant differences (P < 0.05) between: (#) PAH and control, LVDD 1, LVDD 2 and (%) control and LVDD 1, LVDD 2 groups. (b) Box plot representation of PCWP values from all four groups. Bonferroni test indicates significant differences (P < 0.05) between: (^)LVDD 2 and control, LVDD 1, PAH and (*) LVDD 1 and control, PAH groups.
Figure 3.
Figure 3. Representative color M-mode Vp images for the four studied groups.
Figure 4.
Figure 4. Scatter plot graphs showing the relationship between Vp and PCWP for all study groups.

Tables

Table 1. Relevant Echocardiographic Data of the Studied Population
 
VariablesGroup I (n = 15)Group II (n = 27)Group III (n = 27)Group IV (n = 66)P-value
LV: left ventricle; LVESV: LV end-systolic volume; LVEDV: LV end-diastolic volume; LVEF: LV ejection fraction; MA: mitral annulus; MV: mitral valve. Bonferroni test indicates significant differences (P < 0.05) between group II and groups I, III, IV. Group III and group II, §Group III and groups I, II, IV and βGroup IV and groups I, II, II.
LVESV (cm3)40 ± 1540 ± 2773 ± 54§34 ± 17< 0.01
LVEDV (cm3)119 ± 30112 ± 30145 ± 6681 ± 35β< 0.01
LVEF (%)67 ± 767 ± 1357 ± 13§59 ± 9β< 0.01
MA E/A ratio1.3 ± 0.30.8 ± 0.11.7 ± 0.7§1.2 ± 0.6< 0.01
MV E/MA E' ratio7 ± 39 ± 317 ± 6§10 ± 12< 0.01


Table 2. Simple Linear Regression Analysis to Determine the Association Between Important Echocardiographic Variables
 
VariablesCoefficient (P-value)
Group IGroup IIGroup IIIGroup IV
Vp: velocity of propagation; PCWP: pulmonary capillary wedge pressure; MA: mitral annulus; MV: mitral valve.
Vp vs. PCWP- 0.8213 (0.46)- 1.4200 (< 0.01)- 1.5520 (< 0.01)- 3.2673 (< 0.01)
Vp vs. MV E/MA E' ratio1.1685 (0.22)- 0.8431 (0.12)- 0.2637 (0.64)- 0.2192 (0.18)
Vp vs. MA E'- 0.5117 (0.56)1.9742 (0.02)2.2038 (0.29)- 0.1049 (0.41)
MV E/Vp vs. MV E/MA E' ratio0.1188 (< 0.01)0.1416 (< 0.01)0.1257 (< 0.01)0.0146 (< 0.01)