Cardiology Research, ISSN 1923-2829 print, 1923-2837 online, Open Access
Article copyright, the authors; Journal compilation copyright, Cardiol Res and Elmer Press Inc
Journal website https://www.cardiologyres.org

Original Article

Volume 8, Number 2, April 2017, pages 36-43


Arterial Velocity Pulse Index as a Novel Marker of Atherosclerosis Using Pulse Wave Analysis on High Sensitivity Troponin T in Hypertensive Patients

Figures

Figure 1.
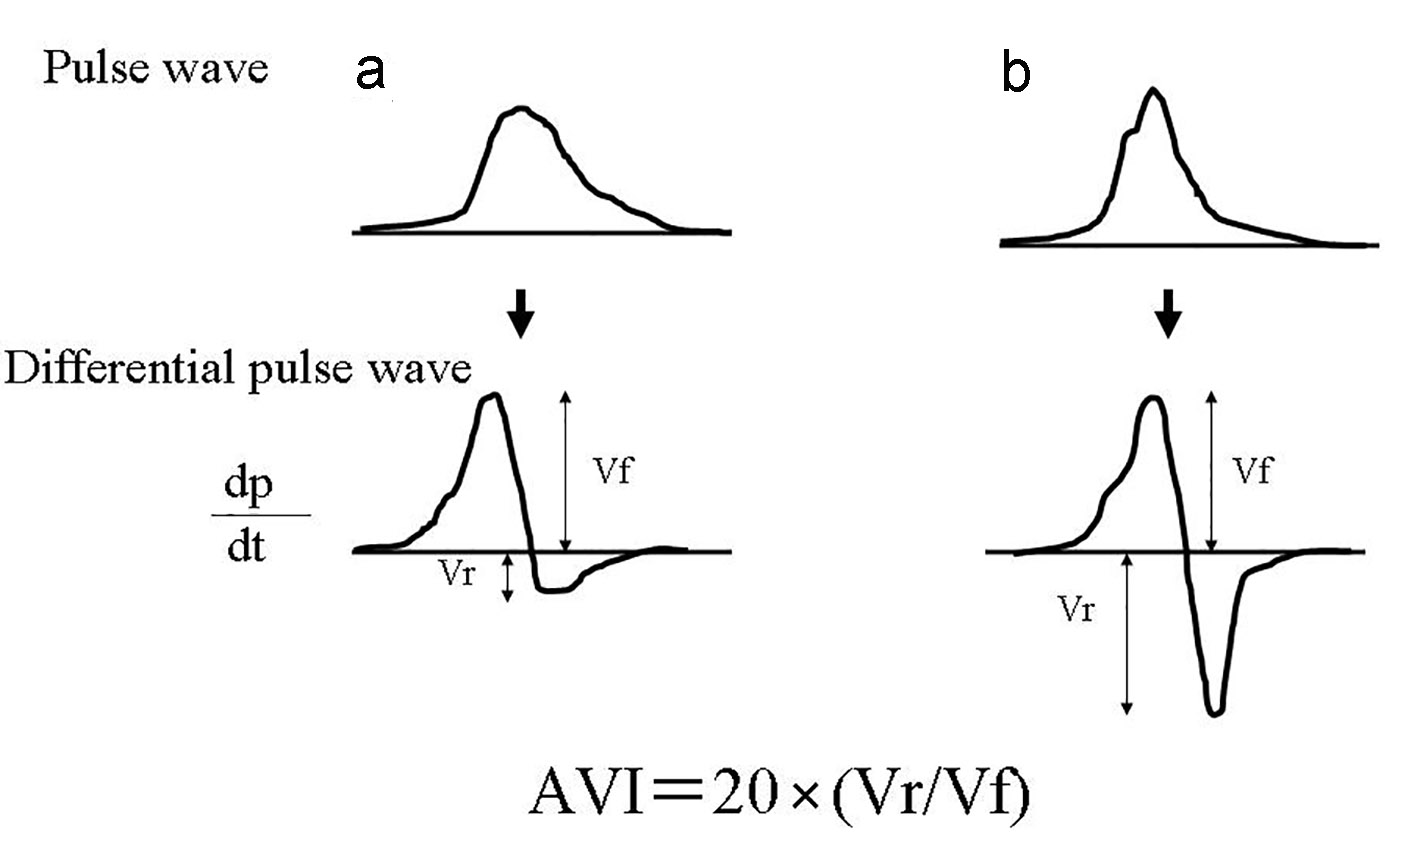
Figure 1. The measurement theory of AVI. (a) indicates normal pattern pulse wave pattern, and (b) indicates abnormal pulse wave pattern by increase of arterial reflection wave. AVI is automatically calculated as 20 × (Vr /Vf), wherein Vf is the first peak of the differentiated waveform between pulse wave and time and Vr is the absolute value of the bottom of the valley of differentiated waveforms between pulse wave and time. The systolic latter waveform rapidly increases and decreases in response to the reflected wave. However, the initial waveform is not influenced by the reflected wave. Vf reflects the initial waveform, and Vr reflects the decreased waveform. Therefore, as waves reflections increase, AVI increases in parallel with the increase in Vr unlike the normal pulse wave pattern. hs-cTnT: high-sensitivity cardiac troponin T; BP: blood pressure; FBG: fasting blood glucose; IRI: immunoreactive insulin; HOMA-IR: homeostatic model assessment of insulin resistance; LDL: low-density lipoprotein; HDL: high-density lipoprotein; eGFR: estimated glomerular filtration rate; BNP: brain natriuretic peptide; hs-CRP: high-sensitivity C-reactive protein; d-ROMs: derivatives of reactive oxygen metabolites; AVI: arterial velocity pulse index; CCB: calcium channel blocker; RAS: renin-angiotensin system.
Figure 2.
Figure 2. Histogram of AVI values. AVI ranged from 11 to 49, and the median value was 28. The distribution AVI was nearly normal. hs-cTnT: high-sensitivity cardiac troponin T; BP: blood pressure; FBG: fasting blood glucose; IRI: immunoreactive insulin; HOMA-IR: homeostatic model assessment of insulin resistance; LDL: low-density lipoprotein; HDL: high-density lipoprotein; eGFR: estimated glomerular filtration rate; BNP: brain natriuretic peptide; hs-CRP: high-sensitivity C-reactive protein; d-ROMs: derivatives of reactive oxygen metabolites; AVI: arterial velocity pulse index; CCB: calcium channel blocker; RAS: renin-angiotensin system.

Tables

Table 1. Patient Characteristics
 
Overallhs-cTnT non-detectionhs-cTnT detectionP value
Data are expressed as mean ± SD. hs-cTnT: high-sensitivity cardiac troponin T; BP: blood pressure; FBG: fasting blood glucose; IRI: immunoreactive insulin; HOMA-IR: homeostatic model assessment of insulin resistance; LDL: low-density lipoprotein; HDL: high-density lipoprotein; eGFR: estimated glomerular filtration rate; BNP: brain natriuretic peptide; hs-CRP: high-sensitivity C-reactive protein; d-ROMs: derivatives of reactive oxygen metabolites; AVI: arterial velocity pulse index; CCB: calcium channel blocker; RAS: renin-angiotensin system.
n (male/female)455 (181/274)50 (20/30)405 (161/244)0.973
Age (years)65 ± 1161 ± 1166 ± 11< 0.01
Height (m)1.6 ± 0.11.6 ± 0.11.6 ± 0.10.873
Body weight (kg)57 ± 1054 ± 1158 ± 11< 0.05
Body mass index (kg/m2)22 ± 421 ± 323 ± 4< 0.05
Smoking, n (%)109 (24)13 (26)96 (24)0.720
Systolic BP (mm Hg)157 ± 8157 ± 10157 ± 80.953
Diastolic BP (mm Hg)91 ± 991 ± 991 ± 100.572
Pulse rate (mm Hg)68 ± 1170 ± 1168 ± 100.129
Cornell voltage (mm)15 ± 612 ± 715 ± 5< 0.001
Diabetes mellitus (%)189 (42)20 (40)169 (42)0.816
FBG (mg/dL)113 ± 24112 ± 20113 ± 240.819
IRI (μg/mL)7.3 ± 4.47.5 ± 4.87.3 ± 4.40.626
HOMA-IR2.1 ± 1.42.1 ± 1.32.1 ± 1.40.864
Dyslipidemia (%)346 (76)29 (54)317 (64)0.172
Total cholesterol (mg/dL)221 ± 42219 ± 42221 ± 410.541
LDL cholesterol (mg/dL)137 ± 37136 ± 40137 ± 380.658
Triglyceride (mg/dL)177 ± 72170 ± 83179 ± 690.279
HDL cholesterol (mg/dL)49 ± 1649 ± 1448 ± 160.62
eGFR (mL/min/1.73 m2)64 ± 2169 ± 2163 ± 18< 0.05
Log-urinary albumin (mg/gCr)1.5 ± 0.51.3±0.51.6 ± 0.5< 0.01
Log-BNP (pg/mL)86 ± 6757±5589 ± 67< 0.01
Log-hs-CRP (mg/L)-1.2 ± 0.6-1.2±0.6-1.2 ± 0.60.331
d-ROMs test (U. Carr)355 ± 93330±97359 ± 92< 0.01
AVI28 ± 724±828 ± 7< 0.001
Log-hs-cTnT (ng/mL)-1.9 ± 0.2--1.9 ± 0.2-
Medication
CCB, n (%)332 (73)36 (72)296 (73)0.652
RAS inhibitor, n (%)223 (49)25 (50)198 (49)0.753
Statin, n (%)155 (34)17 (34)138 (34)0.889


Table 2. Correlation Between hs-cTnT, AVI and Clinical Parameters in hs-cTnT Detectable Patients
 
r
Log-hs-cTnTAVI
r is correlation coefficient. *P < 0.001, **P < 0.01, ***P < 0.05. hs-cTnT: high-sensitivity cardiac troponin T; BP: blood pressure; FBG: fasting blood glucose; IRI: immunoreactive insulin; HOMA-IR: homeostatic model assessment of insulin resistance; LDL: low-density lipoprotein; HDL: high-density lipoprotein; eGFR: estimated glomerular filtration rate; BNP: brain natriuretic peptide; hs-CRP: high-sensitivity C-reactive protein; d-ROMs: derivatives of reactive oxygen metabolites; AVI: arterial velocity pulse index; CCB: calcium channel blocker; RAS: renin-angiotensin system.
Sex (female = 0, male = 1)-0.06-0.13**
Age0.40*0.36*
Height0.06-0.32*
Body weight0.09-0.18*
Body mass index0.10***-0.08
Smoking (no = 0, yes = 1)0.020.09
Systolic BP0.080.12**
Diastolic BP0.050.08
Pulse rate0.040.26*
Cornell voltage0.21*0.35*
Diabetes mellitus (no = 0, yes = 1)0.070.08
FBG0.030.09
IRI0.040.07
Log-HOMA-IR0.060.06
Dyslipidemia (no = 0, yes = 1)-0.03-0.01
Total cholesterol-0.060.05
LDL cholesterol-0.050.04
Triglyceride-0.030.06
HDL cholesterol-0.06-0.04
eGFR-0.13**-0.10***
Log-urinary albumin0.20*0.29*
Log-BNP0.25*0.35***
Log-hs-CRP0.10***0.11***
d-ROMs test0.35*0.37*
AVI0.42*-
Log-hs-cTnT-0.42*
CCB (no = 0, yes = 1)-0.06-0.05
RAS inhibitor (no = 0, yes = 1)-0.06-0.05
Statin (no = 0, yes = 1)-0.03-0.02


Table 3. Multiple Regression Analysis
 
Dependent variableβt valueP value
(A) Subordinate factor is log-hs-cTnT. R2 = 0.23, F = 12.5, P < 0.001. (B) Subordinate factor is AVI. R2 = 0.43, F = 22.7, P < 0.001. hs-cTnT: high-sensitivity cardiac troponin T; BP: blood pressure; FBG: fasting blood glucose; IRI: immunoreactive insulin; HOMA-IR: homeostatic model assessment of insulin resistance; LDL: low-density lipoprotein; HDL: high-density lipoprotein; eGFR: estimated glomerular filtration rate; BNP: brain natriuretic peptide; hs-CRP: high-sensitivity C-reactive protein; d-ROMs: derivatives of reactive oxygen metabolites; AVI: arterial velocity pulse index; CCB: calcium channel blocker; RAS: renin-angiotensin system.
(A) AVI0.356.6< 0.001
  Age0.336.0< 0.001
  BNP0.143.0< 0.01
  Log-urinary albumin0.122.5< 0.01
  d-ROMs test0.112.3< 0.01
  Cornell voltage0.102.1< 0.05
  eGFR-0.07-1.50.152
  Log-hs-CRP0.061.40.148
  Body mass index0.020.30.730
(B) Log-hs-cTnT0.276.3< 0.001
  Age0.256.0< 0.001
  Cornell voltage0.235.6< 0.001
  Height-0.22-3.6< 0.001
  Log-urinary albumin0.122.9< 0.01
  Pulse rate-0.11-2.8< 0.01
  d-ROMs test0.112.7< 0.01
  BNP0.091.90.063
  Sex0.091.80.132
  Systolic BP0.061.50.168
  Log-hs-CRP0.061.40.173
  eGFR-0.04-1.20.289
  Body weight-0.09-1.90.058