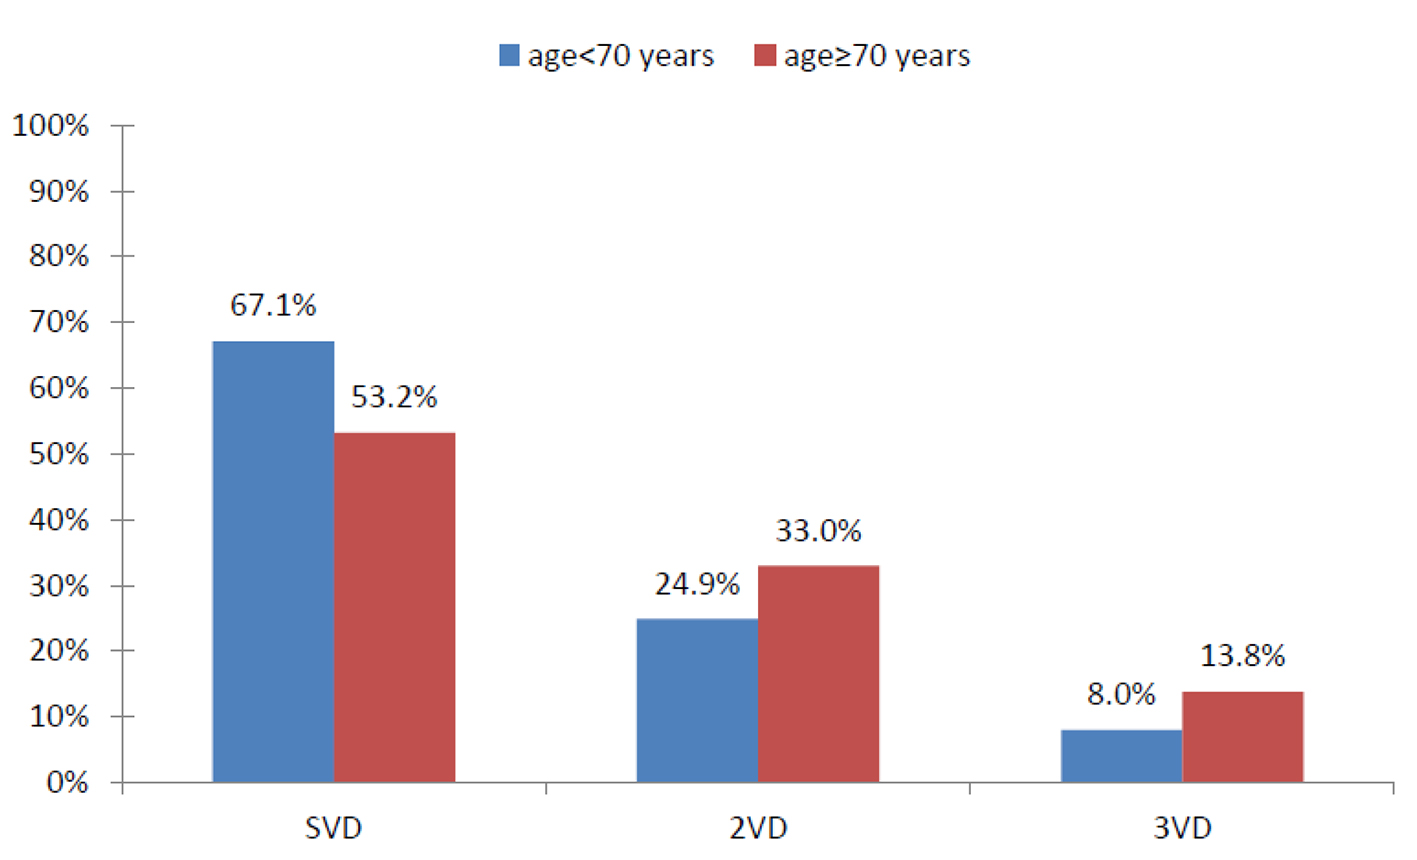
Figure 1. Ratio of the frequency of coronary artery atherosclerosis in two age groups.
| Cardiology Research, ISSN 1923-2829 print, 1923-2837 online, Open Access |
| Article copyright, the authors; Journal compilation copyright, Cardiol Res and Elmer Press Inc |
| Journal website https://www.cardiologyres.org |
Original Article
Volume 8, Number 5, October 2017, pages 199-205
In-Hospital Clinical Outcomes and Procedural Complications of Percutaneous Coronary Intervention in Elderly Patients
Figures
Tables
| Variables | Total | Age < 70 years | Age ≥ 70 years | P-value |
|---|---|---|---|---|
| Number | 468 | 374 (79.9%) | 94 (20.1%) | - |
| Mean age | 60.01 ± 10.84 | 55.93 ± 7.64 | 76.28 ± 4.59 | < 0.0001 |
| Male | 290 (62%) | 421 (64.4%) | 49 (52.1%) | 0.028 |
| Blood pressure | 349 (74.69%) | 276 (74.0%) | 73 (77.7%) | 0.465 |
| Dyslipidemia | 261 (55.8%) | 215 (57.6%) | 46 (48.9%) | 0.129 |
| Diabetes | 189 (40.4%) | 153 (41.0%) | 36 (38.3%) | 0.631 |
| Chronic renal failure | 53 (11.3%) | 30 (8.0%) | 23 (24.5%) | < 0.0001 |
| Smoking (current or previously) | 169 (36.3%) | 144 (38.5%) | 25 (26.6%) | 0.041 |
| History of ICH | 1 (0.2%) | 0.00 | 1 (1.1%) | 0.201 |
| History of CVA | 9 (1.9%) | 8 (2.1%) | 1 (1.1%) | 0.695 |
| History of MI | 88 (18.8%) | 70 (18.7%) | 18 (19.1%) | 0.924 |
| History of PCI | 50 (10.7%) | 41 (11.0%) | 9 (9.6%) | 0.697 |
| History of CABG | 17 (3.6%) | 15 (4.0%) | 2 (2.1%) | 0.544 |
| Heart failure | 32 (6.8%) | 20 (5.3%) | 12 (12.8%) | 0.011 |
| Atrial fibrillation | 8 (1.7%) | 5 (1.3%) | 3 (3.2%) | 0.204 |
| Cardiogenic shock | 5 (1.1%) | 5 (1.3%) | 0.00 | 0.588 |
| LVEF | 46.98 ± 10.17 | 47.62 ± 9.82 | 44.41 ± 11.18 | 0.080 |
| Left ventricular dysfunction | 105 (22.4%) | 75 (20.1%) | 30 (31.9%) | 0.014 |
| Variable | Total | Age < 70 years | Age ≥ 70 years | P-value |
|---|---|---|---|---|
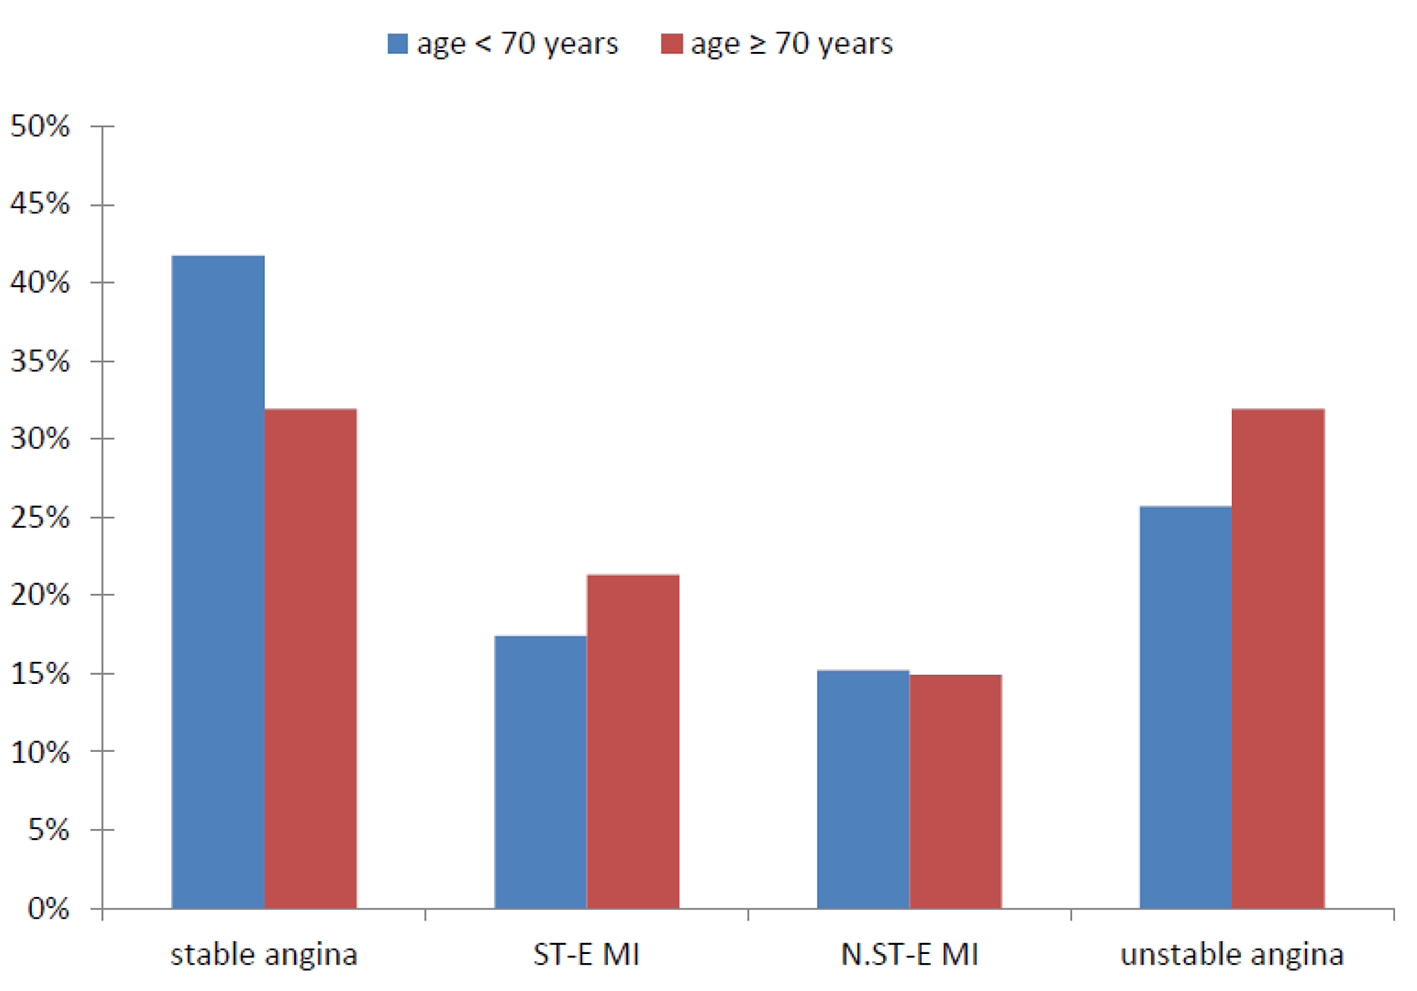
| Acute coronary syndrome | 282 (60.3%) | 218 (58.3%) | 64 (68.1%) | - |
| Unstable angina | 126 (26.9%) | 96 (25.7%) | 30 (31.9%) | |
| NSTEM | 71 (15.2%) | 57 (15.2%) | 14 (14.9%) | 0.316 |
| STEM | 85 (18.2%) | 65 (17.4%) | 20 (21.3%) | |
| Stable angina | 186 (39.7%) | 156 (41.7%) | 30 (31.9%) | |
| SVD | 301 (64.3) | 251 (67.1%) | 50 (53.2%) | |
| 2VD | 124 (26.5) | 93 (24.9%) | 31 (33.0%) | 0.032 |
| 3VD | 43 (9.2%) | 30 (8.0%) | 13 (13.8%) | |
| PCI method | - | - | - | |
| DES use | 461 (98.5%) | 370 (98.9%) | 91 (96.8%) | 0.148 |
| BMS use | 7 (1.5%) | 4 (1.1%) | 3 (3.2%) |
| Variables | Total | Age < 70 years | Age ≥ 70 years | P-value |
|---|---|---|---|---|
| Uncomplicated | 455 (97.2%) | 371 (99.2%) | 84 (89.4%) | |
| Long hospitalization | 5 (1.1%) | 0.00 | 5 (5.3%) | 0.0001 |
| Contrast-induced kidney damage | 5 (1.1%) | 2 (0.5%) | 3 (3.2%) | |
| ACS | 1 (0.2%) | 0.00 | 1 (1.1%) | |
| Emergency revascularization with CABG | 1 (0.2%) | 1 (0.3%) | 0.00 | |
| Occurrence of death for any cause | 1 (0.2%) | 0.00 | 1 (1.1%) |
| Variables | OR | 95% CI | P-value |
|---|---|---|---|
| Aging (+70) | 0.00 | 0.00 | 0.999 |
| Male | 0.37 | 0.03 - 3.93 | 0.416 |
| Dyslipidemia | 2.81 | 0.23 - 34.02 | 0.416 |
| Hypertension | 1.87 | 0.21 - 16.41 | 0.571 |
| Diabetes mellitus | 0.81 | 0.10 - 6.06 | 0.838 |
| History of CVA | 0.74 | 0.00 - 54.39 | 0.621 |
| Smoking | 3.71 | 0.28 - 47.94 | 0.315 |
| History of MI | 0.84 | 0.17 - 3.98 | 0.827 |
| Arterial fibrillation | 0.02 | 0.00 - 0.54 | 0.018 |
| Heart failure | 0.98 | 0.00 - 3.13 | 0.205 |
| Multi-vessel coronary disease | 1.33 | 0.23 - 5.27 | 0.883 |
| LV dysfunction | 4.14 | 0.17 - 9.99 | 0.381 |
| Variable | Pearson’s correlation coefficient (rs) | P-value |
|---|---|---|
| Age (< 70 vs. ≥ 70) | 0.132 | 0.004 |
| Age (< 70 vs. ≥ 75) | 0.190 | 0.000 |
| Male gender | 0.011 | 0.812 |
| ACS | 0.011 | 0.815 |
| Cardiogenic shock | 0.012 | 0.798 |
| Dyslipidemia | 0.014 | 0.771 |
| Hypertension | 0.021 | 0.648 |
| Diabetes mellitus | 0.022 | 0.633 |
| Chronic kidney injury | 0.041 | 0.379 |
| Smoking | 0.046 | 0.319 |
| History of MI | 0.006 | 0.893 |
| History of CVI | 0.122 | 0.008 |
| History of ICH | 0.005 | 0.909 |
| Heart failure | 0.120 | 0.010 |
| Arterial fibrillation | 0.278 | 0.000 |
| LV dysfunction | 0.030 | 0.521 |
| History of PCI | 0.039 | 0.395 |
| History of CBAG | 0.022 | 0.633 |
| Injured coronary artery | 0.037 | 0.430 |
| PCI approach | 0.014 | 0.762 |