Figures
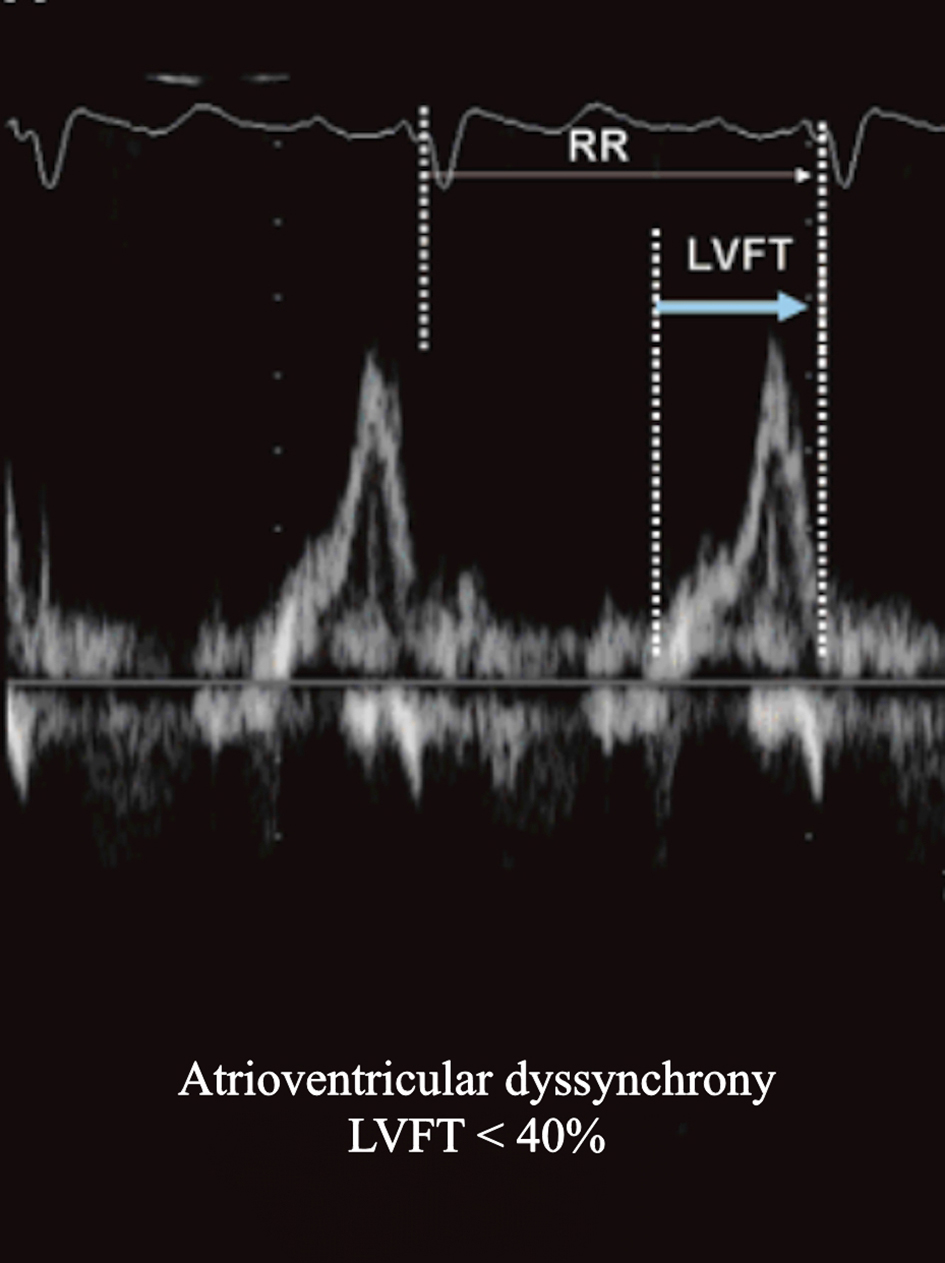
Figure 1. Transthoracic echocardiography with pulsed wave (PW) Doppler of the transmitral flow showing atrioventricular dyssynchrony with a left ventricular filling time (LVFT) < 40% of the R-R interval (cardiac cycle). Adapted from Kapoor [3].
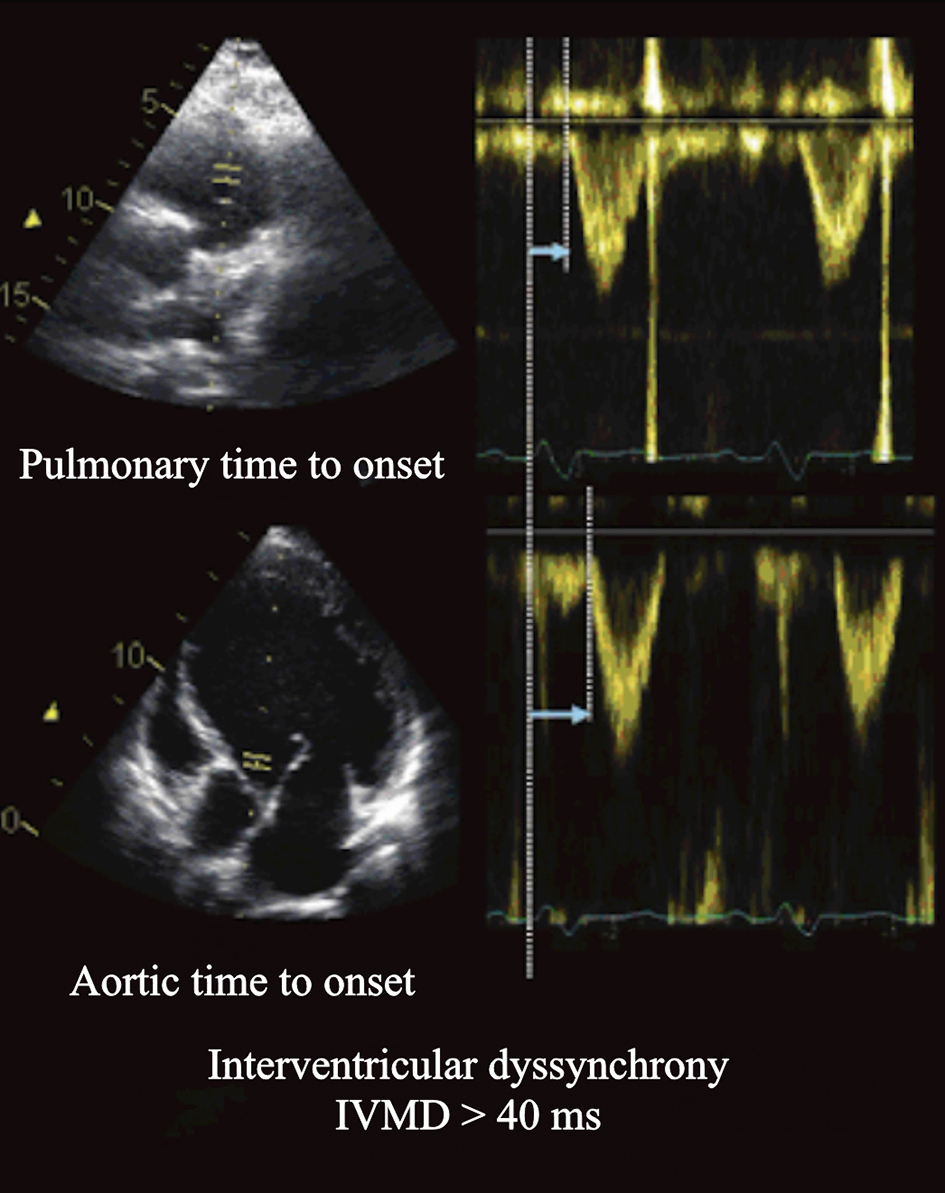
Figure 2. Parasternal short-axis view of transthoracic echocardiography with PW Doppler image of pulmonary flow velocity (right ventricular outflow tract) and apical five-chamber view with PW Doppler image of aortic flow velocity (left ventricular outflow tract). Assessment of interventricular dyssynchrony by measuring the time delay between the onset of the right and left ventricular ejections. Adapted from Kapoor [3]
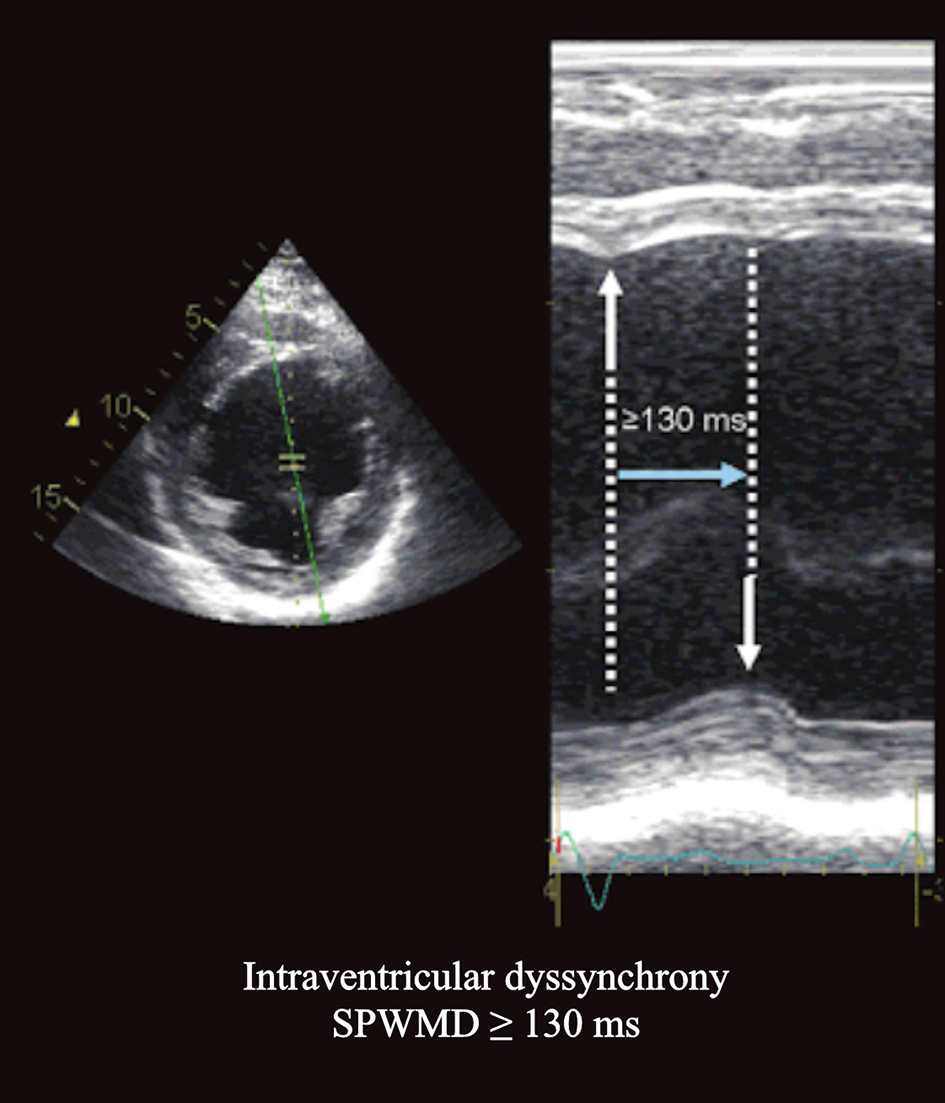
Figure 3. Parasternal short-axis view at the papillary muscle level M-mode tracing showing the systolic septal inward motion occurring > 130 ms earlier than the posterior inward motion. Adapted from Kapoor [3]
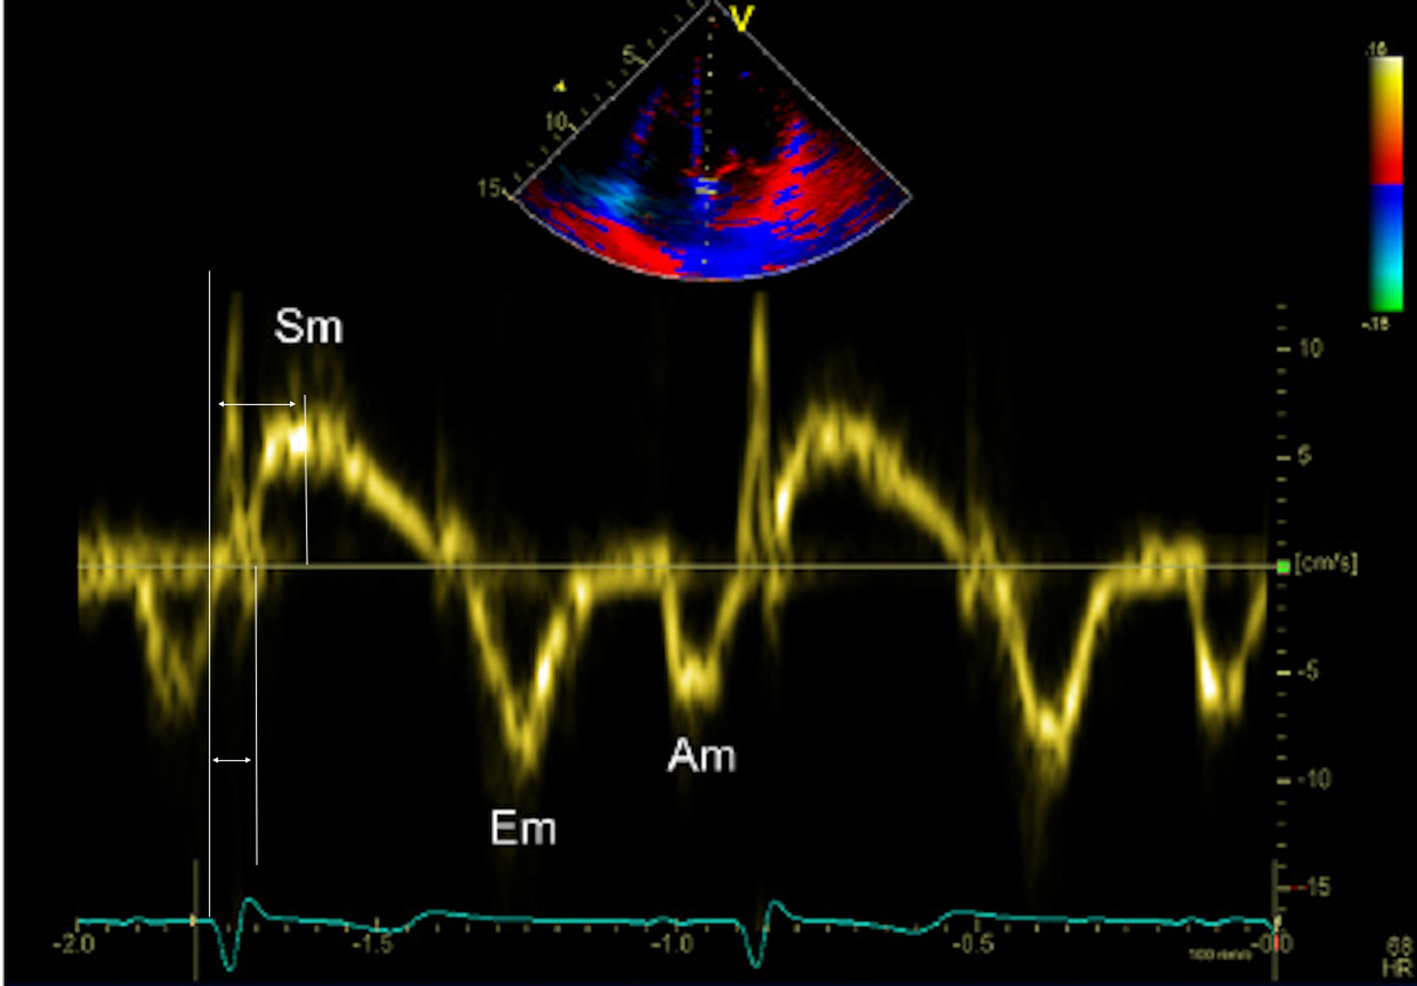
Figure 4. Methodology for measuring pulsed wave tissue Doppler derived time to peak Sm and time to onset Sm. Am: late diastolic velocity; Em: early diastolic velocity; Sm: peak systolic velocity.
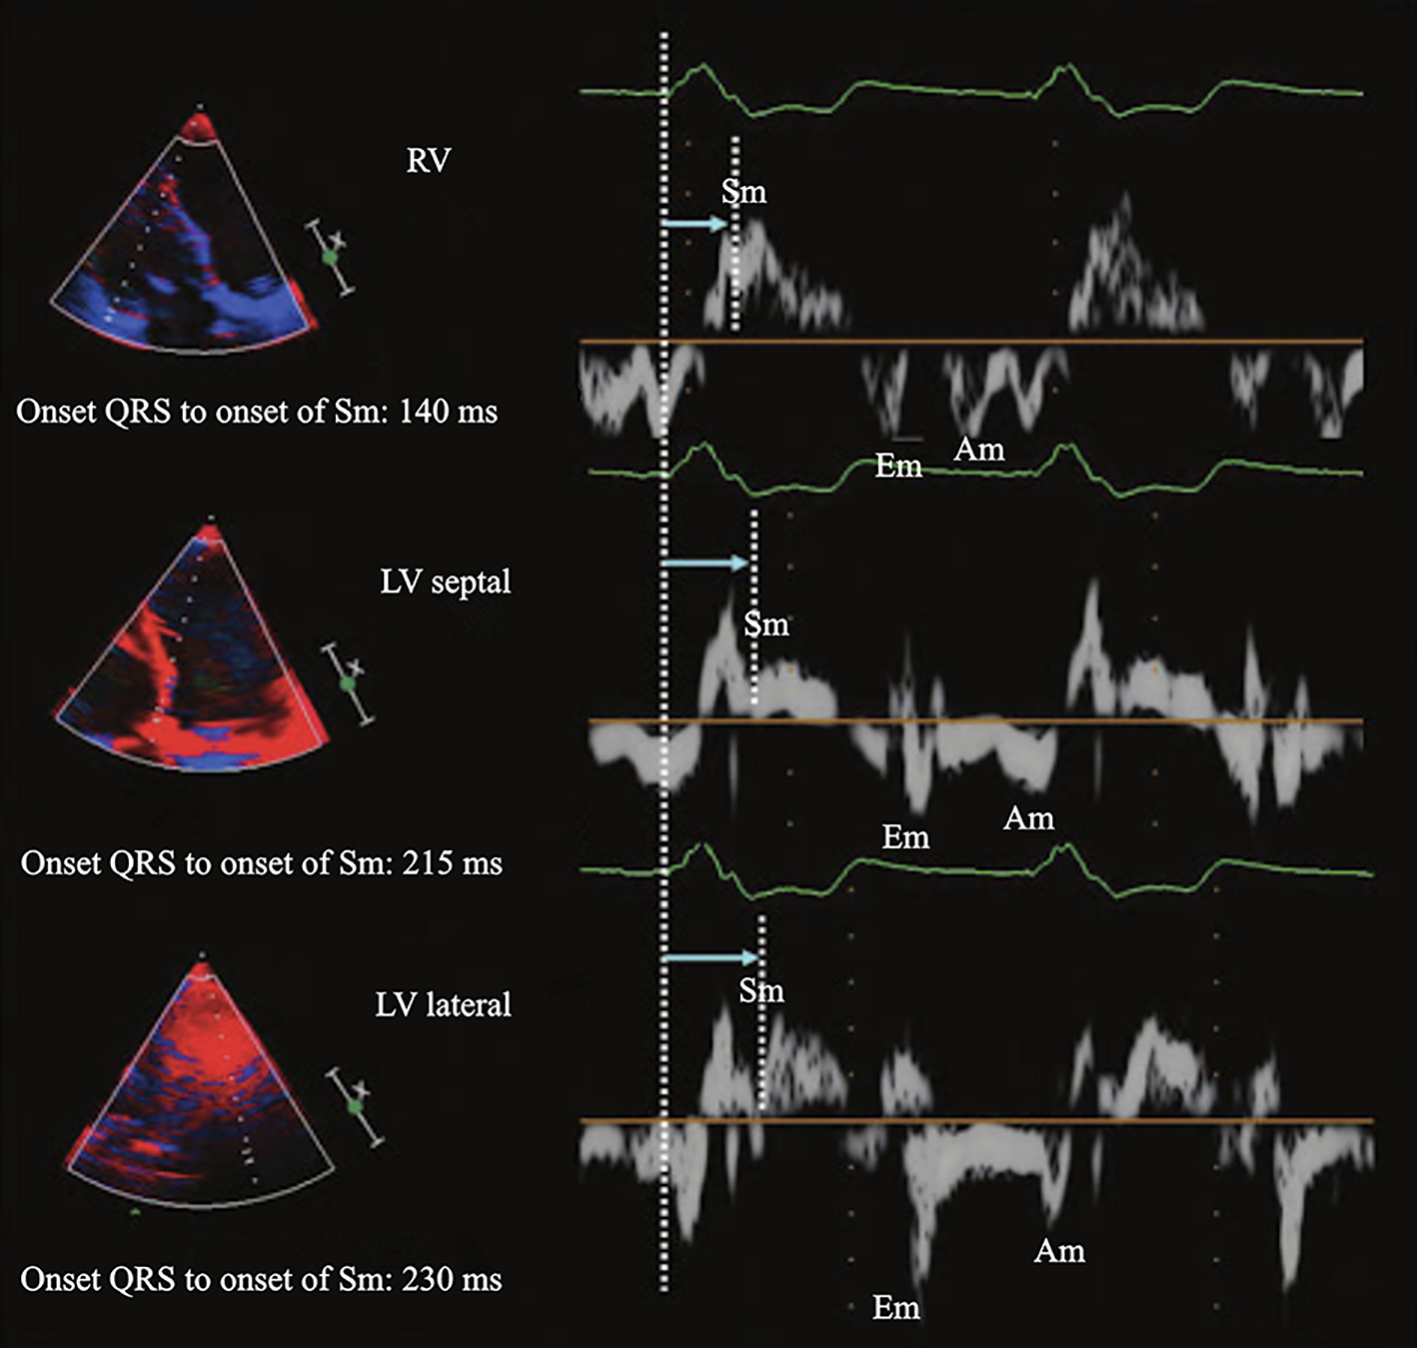
Figure 5. Example of left ventricular (LV) dyssynchrony assessed with pulsed wave tissue Doppler imaging showing substantial interventricular dyssynchrony (right ventricular free wall to LV lateral wall delay of 90 ms) but not LV dyssynchrony with a time delay of 15 ms between LV septal and lateral walls.
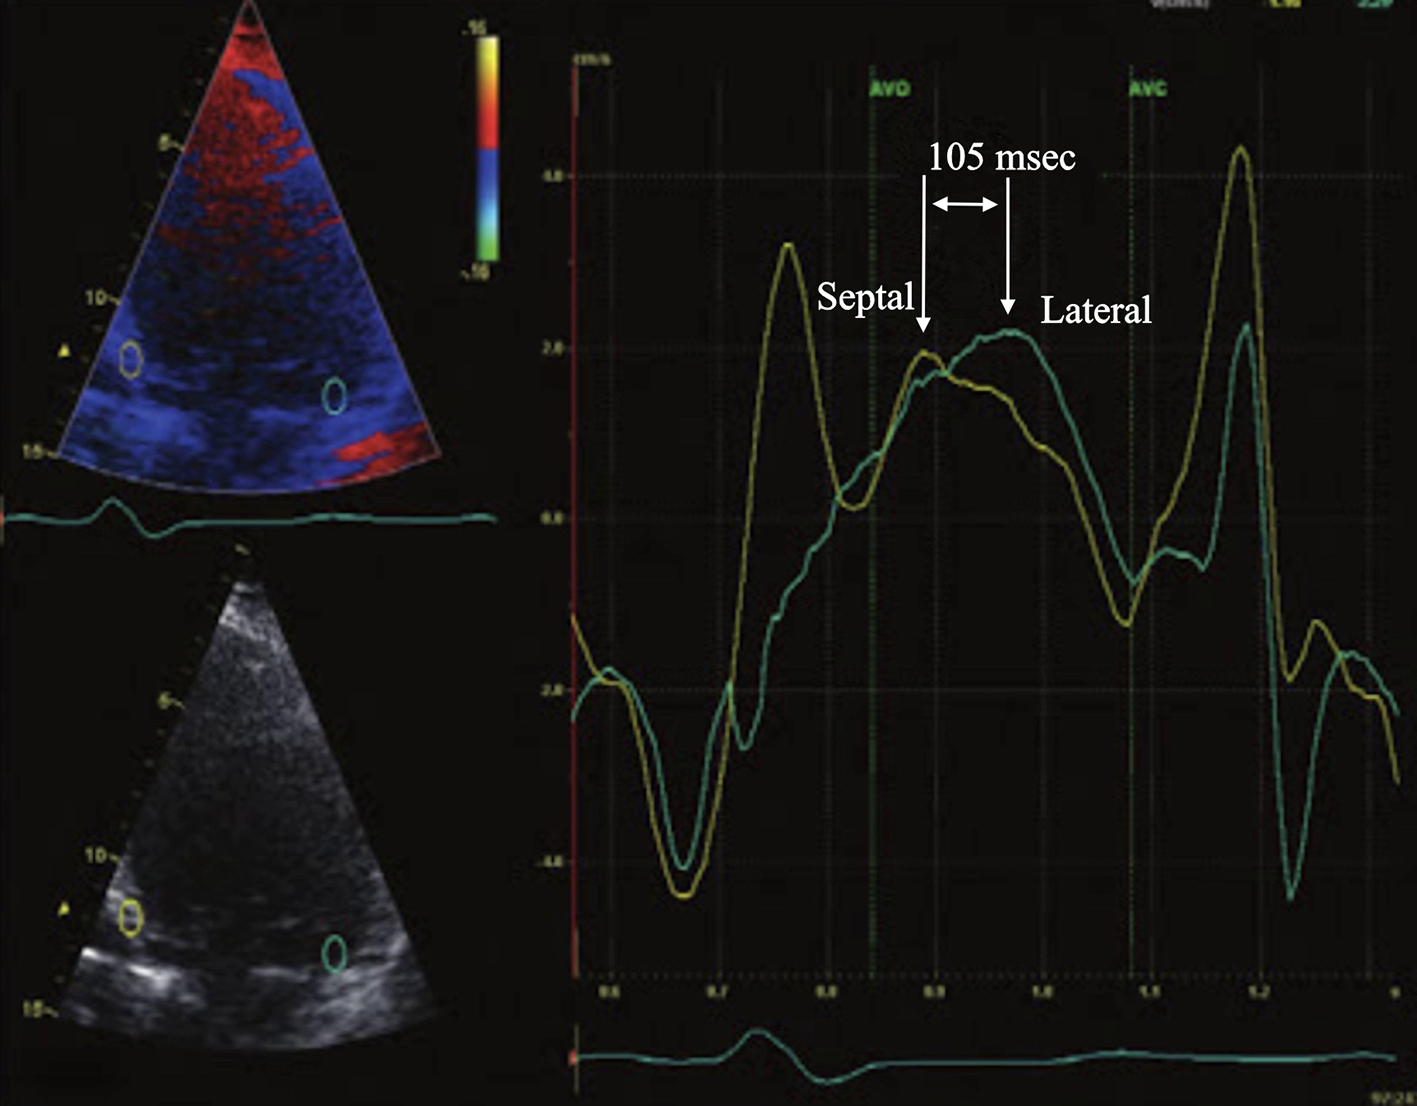
Figure 6. Apical four-chamber view of transthoracic echocardiography with color-coded tissue Doppler imaging showing significant time delay between the septal and the lateral wall (> 65 ms).
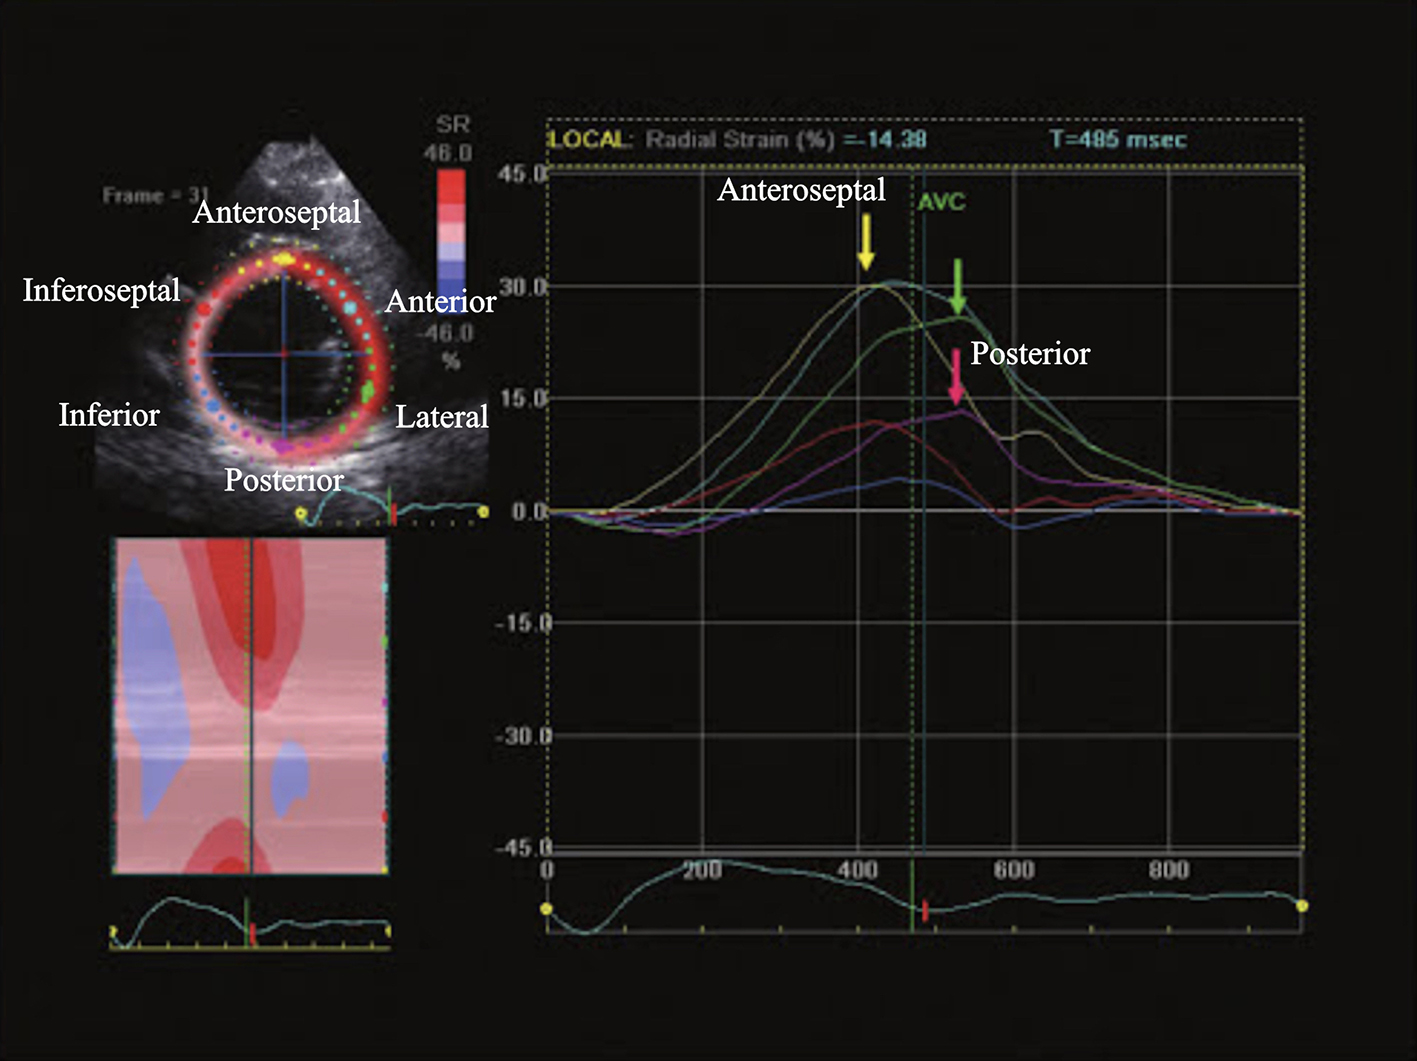
Figure 7. Parasternal short-axis view of transthoracic echocardiography, time-radial strain tracing. A time delay of ≥ 130 ms between peak radial strain of the anteroseptal (yellow arrow) and the posterior (purple arrow) segments demonstrate the presence of left ventricular dyssynchrony. Adapted from Kapoor [3]
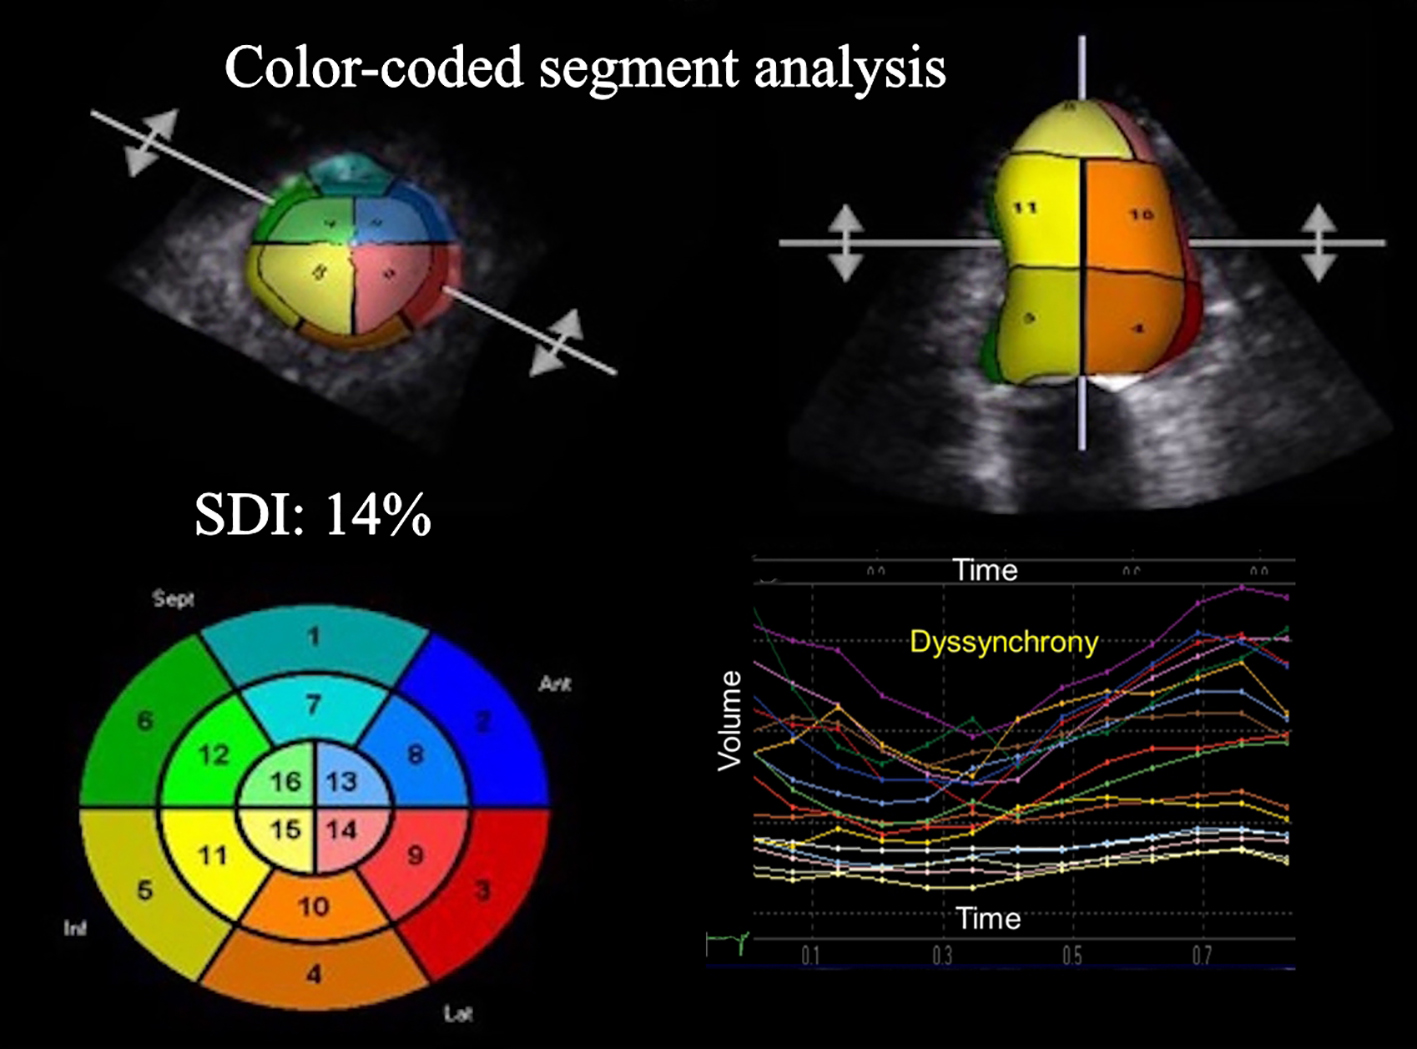
Figure 8. 3D echocardiography color-coded polar map showing the most delayed areas (left ventricular dyssynchrony, SDI 14%). SDI: systolic dyssynchrony index derived from the standard deviation of the average of time intervals needed by multiple LV segments to reach minimal end-systolic volume.