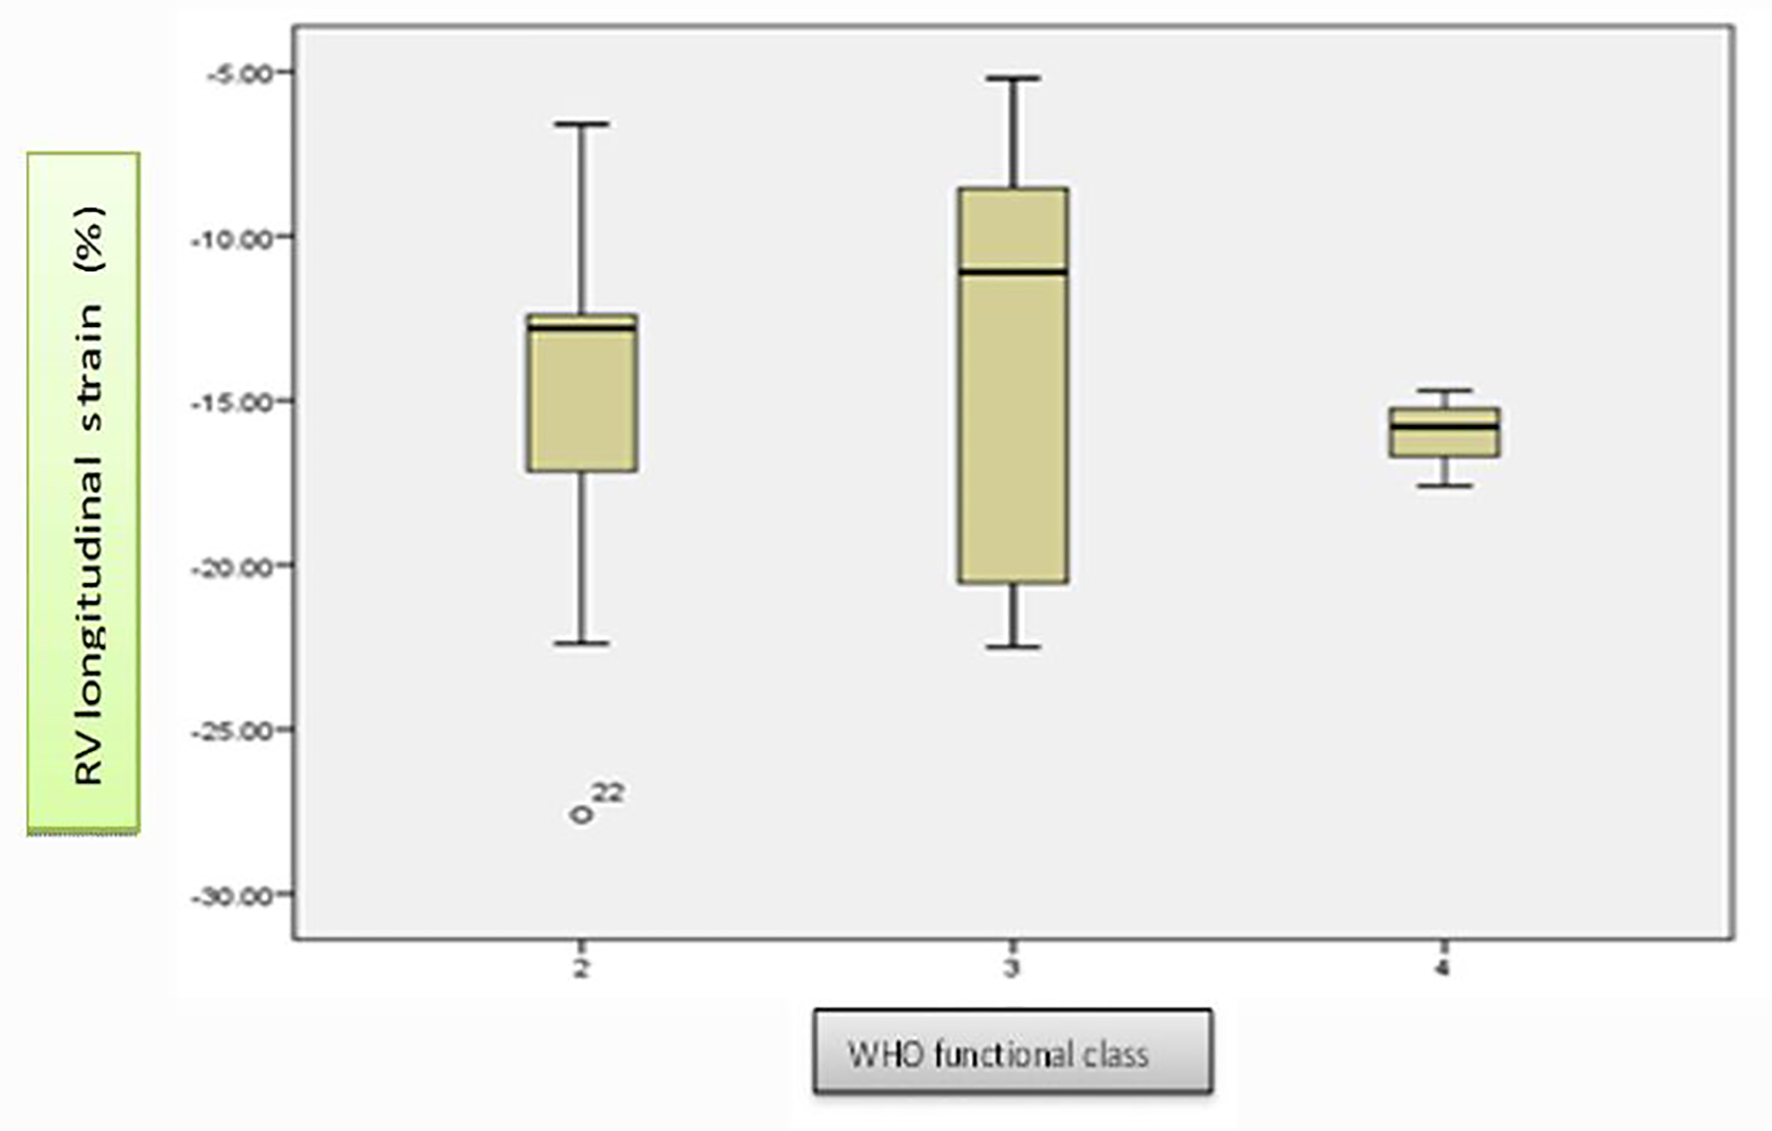
Figure 1. Whisker plot diagrams showing distribution of RV longitudinal strain in different WHO functional class at baseline. At baseline, there was no significant interclass difference in mean RV longitudinal strain distribution (P = 0.0781).
| Cardiology Research, ISSN 1923-2829 print, 1923-2837 online, Open Access |
| Article copyright, the authors; Journal compilation copyright, Cardiol Res and Elmer Press Inc |
| Journal website https://www.cardiologyres.org |
Original Article
Volume 8, Number 5, October 2017, pages 214-219
Assessment of Right Ventricular Function by Newer Imaging in Echocardiography in Idiopathic Pulmonary Arterial Hypertension
Figures
Tables
| Parameters | N | Status | Mean rank | Mean | Standard deviation | Chi-square | df | P |
|---|---|---|---|---|---|---|---|---|
| The average change in no parameter achieved significance level with change in severity of PAH at 6 months with comparison to baseline. Out of 22 patients, one is yet to come for follow-up at 6 months. | ||||||||
| SpO2 | 21 | No change: 11 | 10.14 | 0.52 | 1.53 | 3.804 | 2 | 0.149 |
| Improved: 7 | 12.79 | |||||||
| Worsened: 3 | 4.50 | |||||||
| 6MWD | 21 | No change: 11 | 11.23 | -9.00 | 29.55 | 2.514 | 2 | 0.284 |
| Improved: 7 | 8.07 | |||||||
| Worsened: 3 | 15.00 | |||||||
| RA area | 21 | No change: 11 | 11.18 | 0.08 | 3.70 | 0.457 | 2 | 0.796 |
| Improved: 7 | 9.29 | |||||||
| Worsened: 3 | 11.00 | |||||||
| RA pressure | 21 | No change: 11 | 10.18 | -0.52 | 2.44 | 0.124 | 2 | 0.940 |
| Improved: 7 | 10.86 | |||||||
| Worsened: 3 | 11.00 | |||||||
| RV E/A | 21 | No change: 11 | 9.64 | -0.02 | 0.22 | 0.589 | 2 | 0.745 |
| Improved: 7 | 11.29 | |||||||
| Worsened: 3 | 12.50 | |||||||
| RV basal diameter | 21 | No change: 11 | 10.32 | -0.66 | 1.21 | 1.121 | 2 | 0.571 |
| Improved: 7 | 9.64 | |||||||
| Worsened: 3 | 14.50 | |||||||
| RV long diameter | 21 | No change: 11 | 7.91 | -0.50 | 0.82 | 5.137 | 2 | 0.077 |
| Improved: 7 | 13.57 | |||||||
| Worsened: 3 | 14.00 | |||||||
| FAC | 21 | No change:11 | 10.73 | -2.15 | 1.47 | 5.097 | 2 | 0.078 |
| Improved: 7 | 7.86 | |||||||
| Worsened: 3 | 18.50 | |||||||
| TAPSE | 21 | No change: 11 | 10.27 | -0.96 | 1.70 | 2.682 | 2 | 0.262 |
| Improved: 7 | 9.14 | |||||||
| Worsened: 3 | 16.50 | |||||||
| RIMP | 21 | No change: 11 | 10.00 | -4.48 | 3.19 | 5.369 | 2 | 0.068 |
| Improved: 7 | 8.71 | |||||||
| Worsened: 3 | 19.50 | |||||||
| RVLS | 21 | No change: 11 | 10.14 | 1.38 | 1.27 | 6.002 | 2 | 0.050 |
| Improved: 7 | 13.50 | |||||||
| Worsened: 3 | 2.00 | |||||||
| Parameters | N | Status | Mean rank | Mean | Standard deviation | Chi-square | df | P |
|---|---|---|---|---|---|---|---|---|
| The average change in no parameter achieved significance level with change in severity of PAH at 12 months with comparison to 6 months. Out of 21 patients, nine patients yet to reach their 12 months follow-up and three patients expired at 6 months follow-up. | ||||||||
| SpO2 | 9 | No change: 6 | 4.50 | -0.27 | 0.78 | 0.727 | 2 | 0.695 |
| Improved: 1 | 6.00 | |||||||
| Worsened: 2 | 6.00 | |||||||
| 6MWD | 9 | No change: 6 | 4.50 | -7.54 | 15.39 | 0.807 | 2 | 0.668 |
| Improved: 1 | 5.00 | |||||||
| Worsened: 2 | 6.50 | |||||||
| RA area | 9 | No change: 6 | 5.00 | 0.14 | 0.69 | 0.202 | 2 | 0.904 |
| Improved: 1 | 6.00 | |||||||
| Worsened: 2 | 4.50 | |||||||
| RA pressure | 9 | No change: 6 | 4.50 | -0.90 | 2.21 | 1.125 | 2 | 0.570 |
| Improved: 1 | 6.00 | |||||||
| Worsened: 2 | 6.00 | |||||||
| RV E/A | 9 | No change: 6 | 4.17 | -0.03 | 0.19 | 2.779 | 2 | 0.249 |
| Improved: 1 | 9.00 | |||||||
| Worsened: 2 | 5.50 | |||||||
| RV basal diameter | 9 | No change: 6 | 4.33 | -0.27 | 1.19 | 1.786 | 2 | 0.409 |
| Improved: 1 | 8.00 | |||||||
| Worsened: 2 | 5.50 | |||||||
| RV long diameter | 9 | No change: 6 | 5.67 | 0.22 | 1.50 | 1.786 | 2 | 0.409 |
| Improved: 1 | 2.00 | |||||||
| Worsened: 2 | 4.50 | |||||||
| FAC | 9 | No change: 6 | 4.50 | -2.70 | 2.12 | 5.647 | 2 | 0.059 |
| Improved: 1 | 1.00 | |||||||
| Worsened: 2 | 8.50 | |||||||
| TAPSE | 9 | No change: 6 | 4.67 | -1.45 | 1.86 | 1.810 | 2 | 0.405 |
| Improved: 1 | 3.00 | |||||||
| Worsened: 2 | 7.00 | |||||||
| RIMP | 9 | No change: 6 | 4.00 | -2.80 | 2.17 | 4.421 | 2 | 0.110 |
| Improved: 1 | 4.00 | |||||||
| Worsened: 2 | 8.50 | |||||||
| RVLS | 9 | No change: 6 | 5.50 | 1.33 | 1.56 | 5.695 | 2 | 0.058 |
| Improved: 1 | 9.00 | |||||||
| Worsened: 2 | 1.50 | |||||||