Cardiology Research, ISSN 1923-2829 print, 1923-2837 online, Open Access
Article copyright, the authors; Journal compilation copyright, Cardiol Res and Elmer Press Inc
Journal website https://www.cardiologyres.org

Original Article

Volume 8, Number 5, October 2017, pages 220-227


Breast Arterial Calcifications on Mammography Do Not Predict Myocardial Ischemia on Myocardial Perfusion Single-Photon Emission Computed Tomography

Figure

Figure 1.
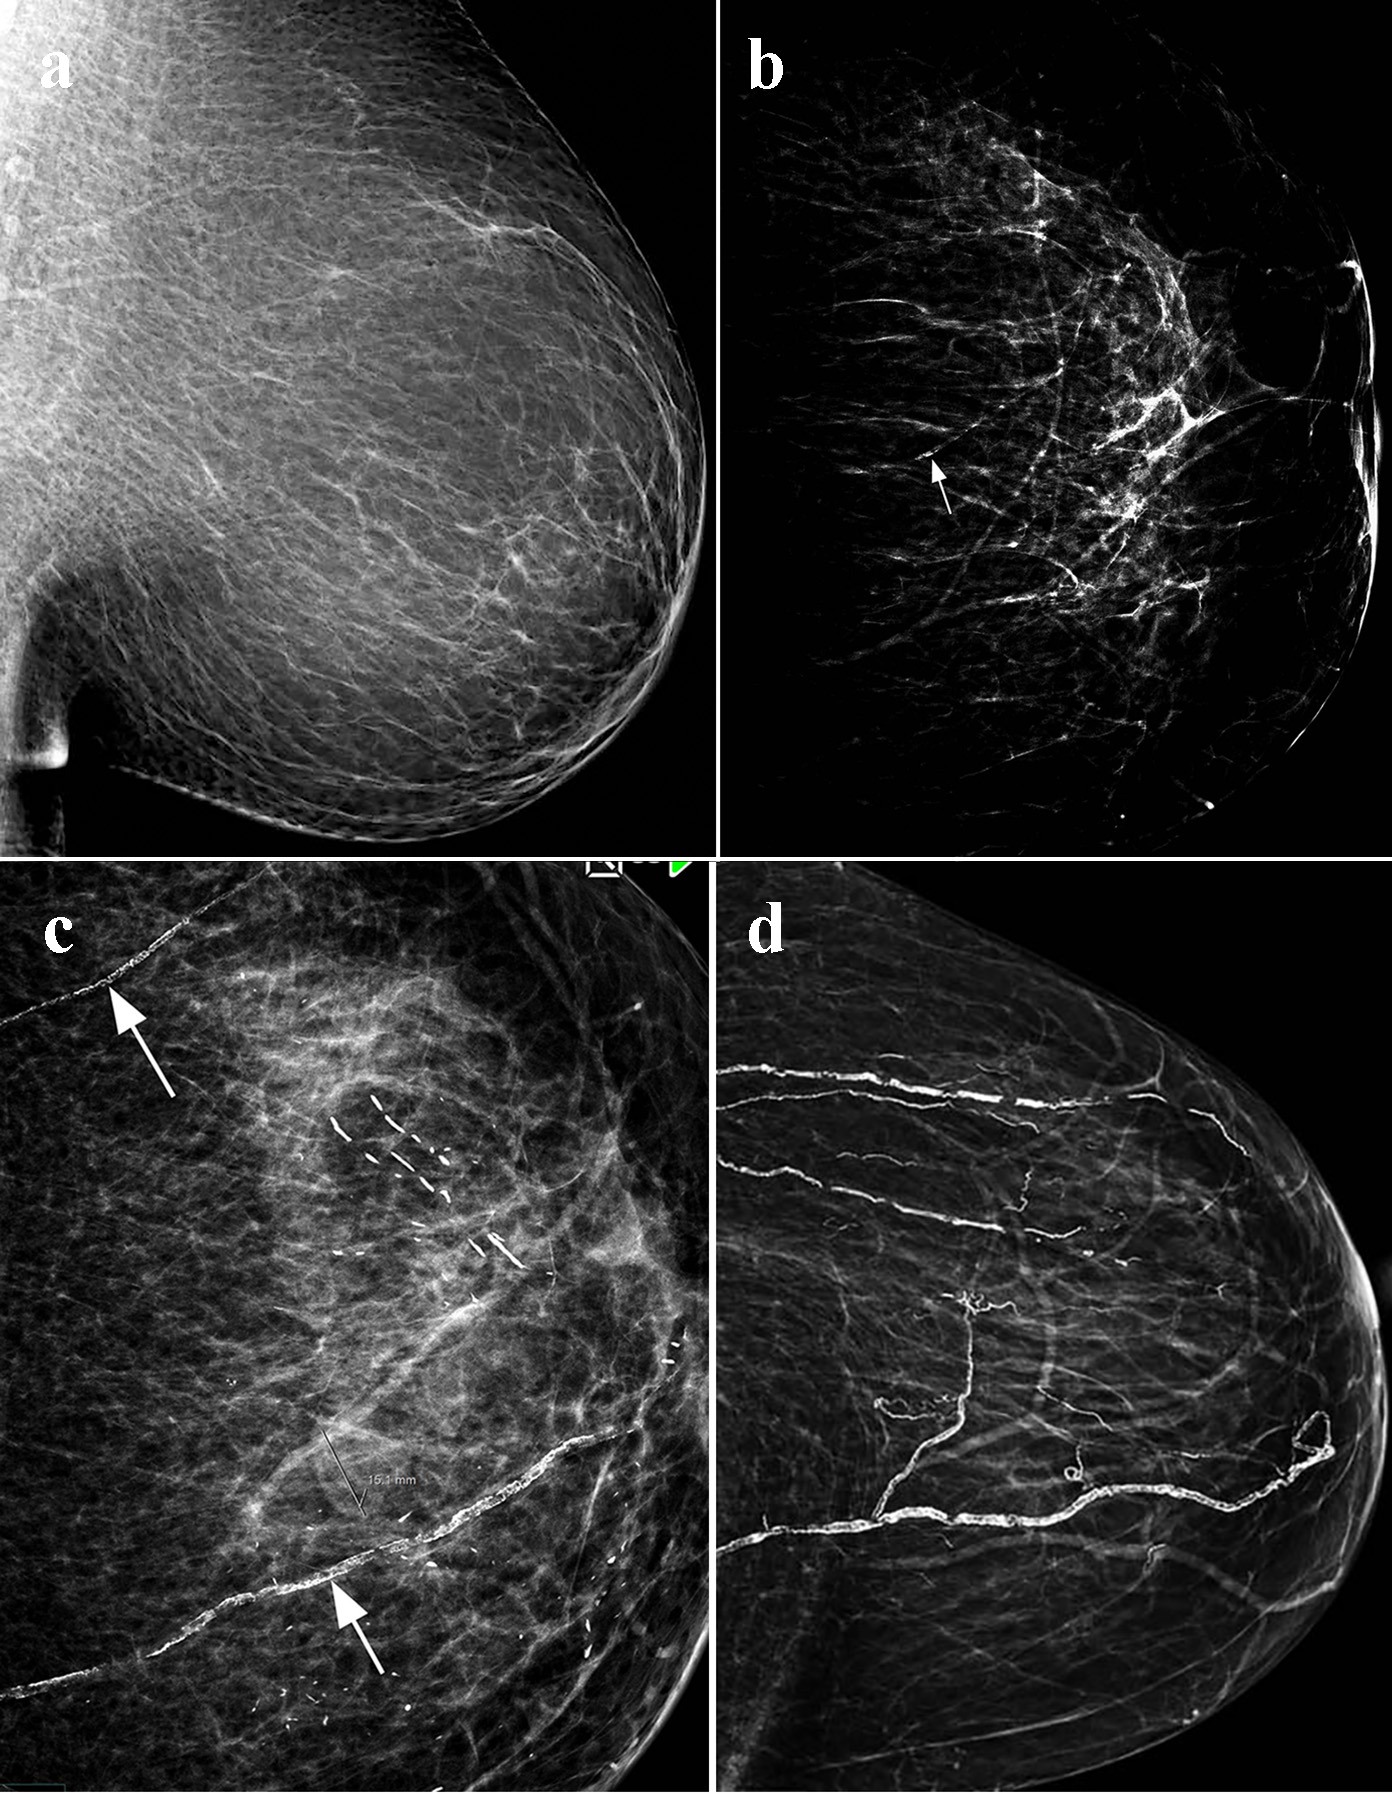
Figure 1. Visual scoring of breast arterial calcification (BAC): (a) no BAC (score 0); (b) mild BAC, one vessle (arrow), single wall, and less than one-third of the vessel length (score 3); (c) moderate BAC: two vessels (arrows), two wall with visualization of the vessels lumen and less than two-thirds of the vessel length (score 8); (d) severe BAC: multiple vessels, dense calcification with obliteration of the vessels lumen, and more than two-thirds of the vessels length (score 13).

Tables

Table 1. Patient Characteristics and Comparison of Presence and Absence of BAC Based on CAD Risk Factors
 
AllAbsence of BACPresence of BACP-value
N435177 (41%)258 (95%)
Age, years (mean ± SD)58 ± 855 ± 761 ± 80.0001
Diabets mellitus237841830.0148
Hyprtension291108410.0309
Smoking2200.087
Hyerlipidemia194811130.6856
Chronic kidney disease176491270.0001
Family history10460.9642


Table 2. Comparison of Normal MPS and Abnormal MPS Based on CAD Risk Factors
 
AllNormal MPS, 380 (87%)Abnormal MPS, 55 (13%)P-value
N435380 (87%)55 (13%)
Absence of BAC177155 (36%)22 (5%)
Presence of BAC258225 (51%)33 (8%)0.3069
Diabetes mellitus237199380.0199
Hypertension291250410.1971
Smoking2110.1111
Hyperlipidemia194162320.0301
Chronic kidney disease176145310.0101
Family history10910.7991


Table 3. Comparison of Normal MPS and Abnormal MPS Based on the Age and Left Ventricular Function
 
AllNormal MPS, 380Abnormal MPSP-value
N435380 (87%)55 (13%)
Age, years (mean ± SD)58 ± 858 ± 860 ± 80.0425
Left ventricular function, % (mean ± SD)63 ± 964 ± 857 ± 120.0001


Table 4. Relationship Between Breast Arterial Calcification Based on the Number of the Arteries, Density of Calcification, and Length of the Vessels, and Total BAC Score and MPS
 
Number (%)P-value
Number of involved breast arteries0.3668
  0177 (41%)
  181 (19%)
  250 (12%)
  3124 (29%)
  41 (0.2%)
  51 (0.2%)
  61 (0.2%)
Density of calcification0.1693
  0177 (40)
  194 (22%)
  255 (13%)
  357 (13%)
  453 (12%)
Length of vessels0.4954
  0177 (41%)
  181 (19%)
  250 (12%)
  3126 (28%)
Total score of arterial calcification0.2095
  Patient with normal MPS (mean ± SD)5 ± 5
  Patient with abnormal MPS (mean ± SD)6 ± 6


Table 5. Relationship Between BAC Score Categories and MPS
 
BAC score categoryNormal MPSAbnormal MPSP-value
Zero155 (36%)22 (5%)
Mild (1 - 4)45 (6%)1 (%)
Moderate (5 - 8)60 (14%)7 (2%)
Severe (9 - 13)120 (28%)23 (5%)0.3069


Table 6. Multivariate Predictors of Abnormal MPS Result
 
P-value
Age (years)0.0342
Diabetes0.3081
Hyperlipidemia0.1541
Chronic kidney disease0.0778
Mean left ventricular function< 0.0001