Figures
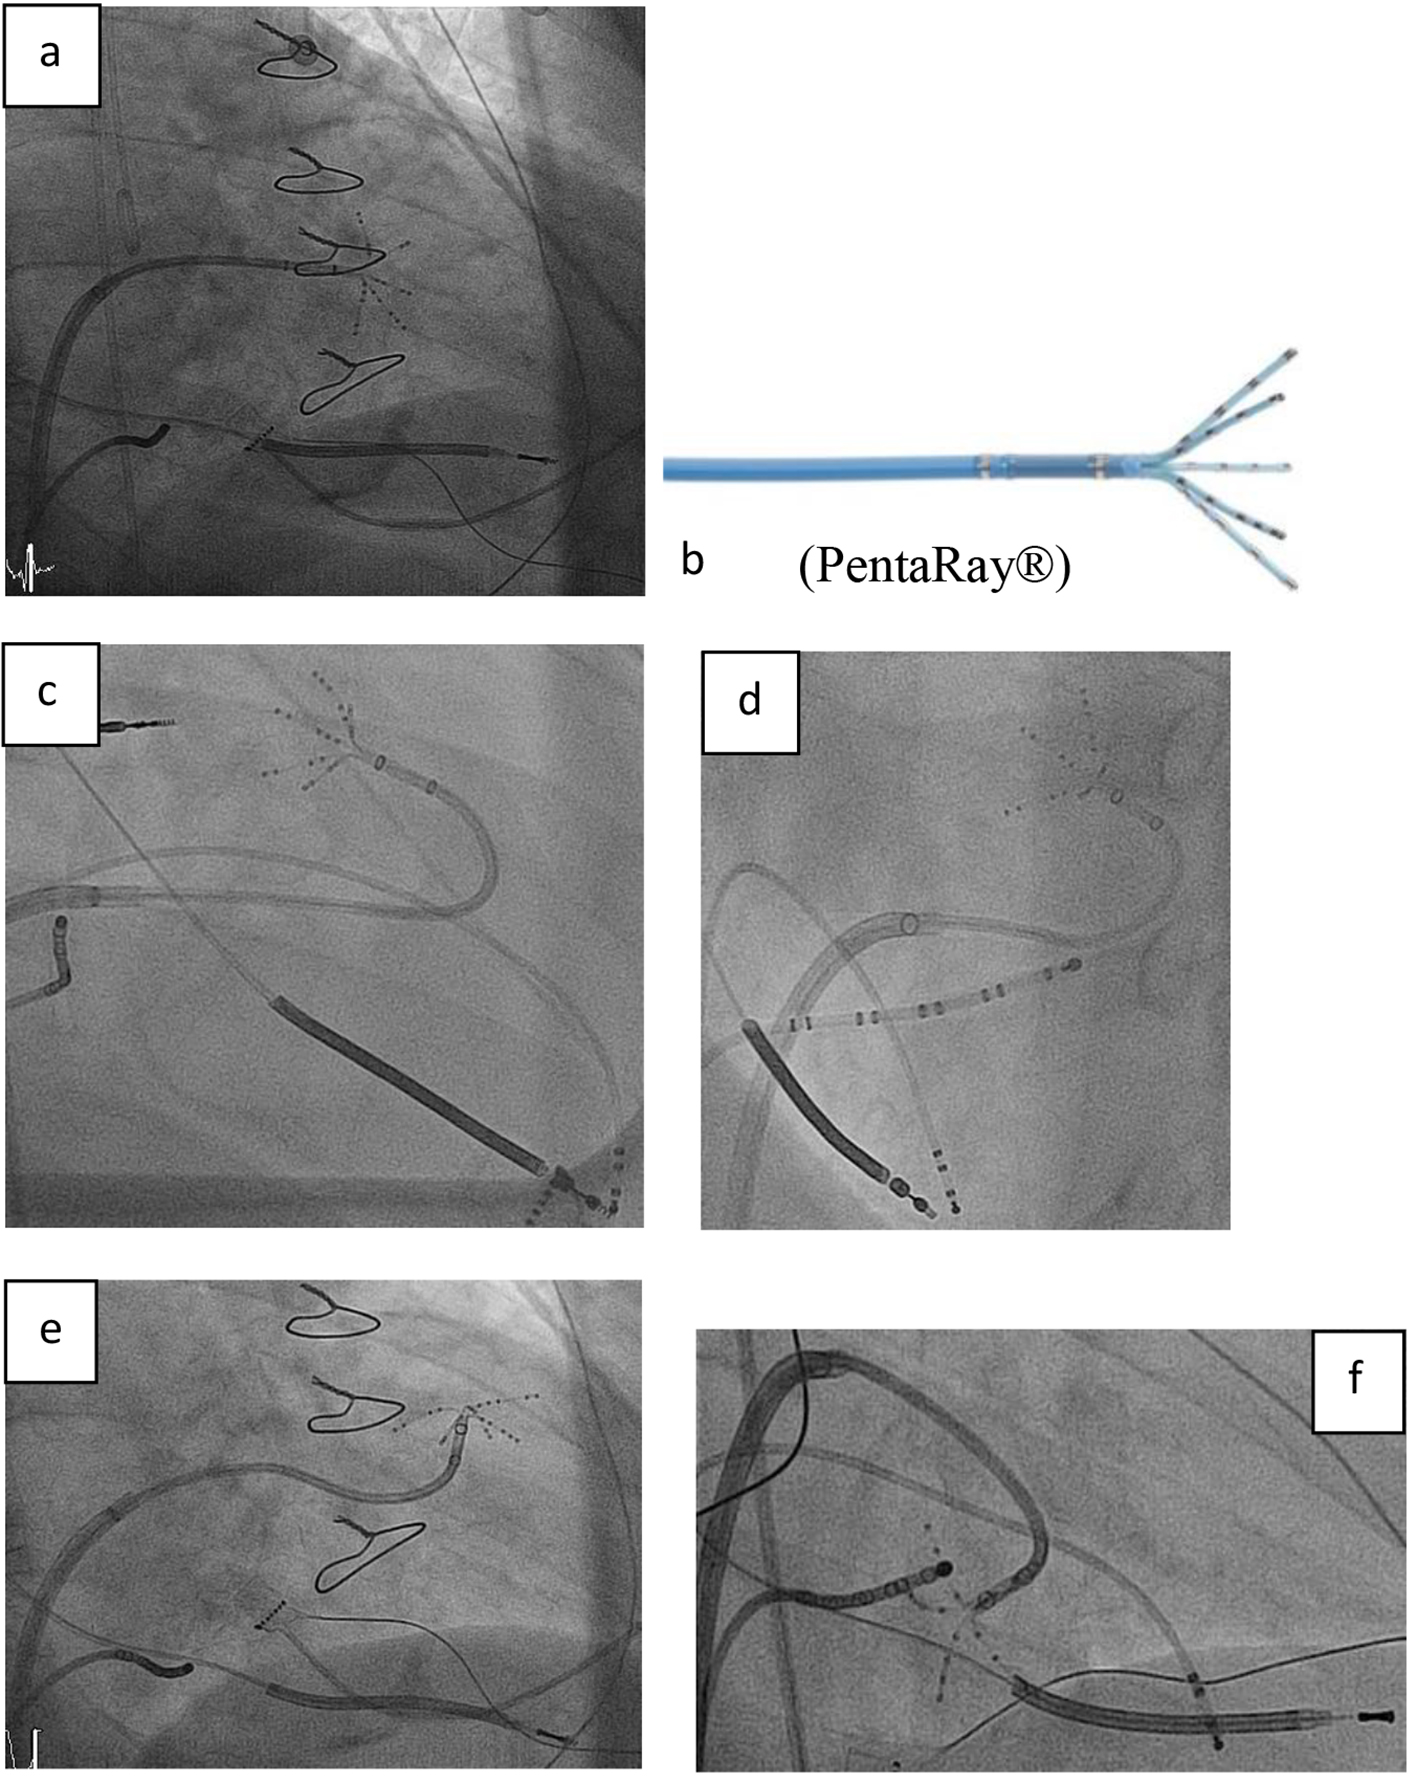
Figure 1. (a, b) Right anterior oblique (RAO) view showing the steerable sheath (large curve Agilis™, SJM), and the 20-pole steerable catheter PentaRay® with 1 mm electrodes distributed over five soft, radiating spines (2-6-2 mm interelectrode spacing) entering the left ventricle by passing the mitral valve. (c-f) Fluoroscopy images in RAO and left anterior oblique (LAO) view showing the various 180° of unidirectional flexion of the PentaRay® with its soft and very flexible branches allowing reaching any region in the left ventricle.
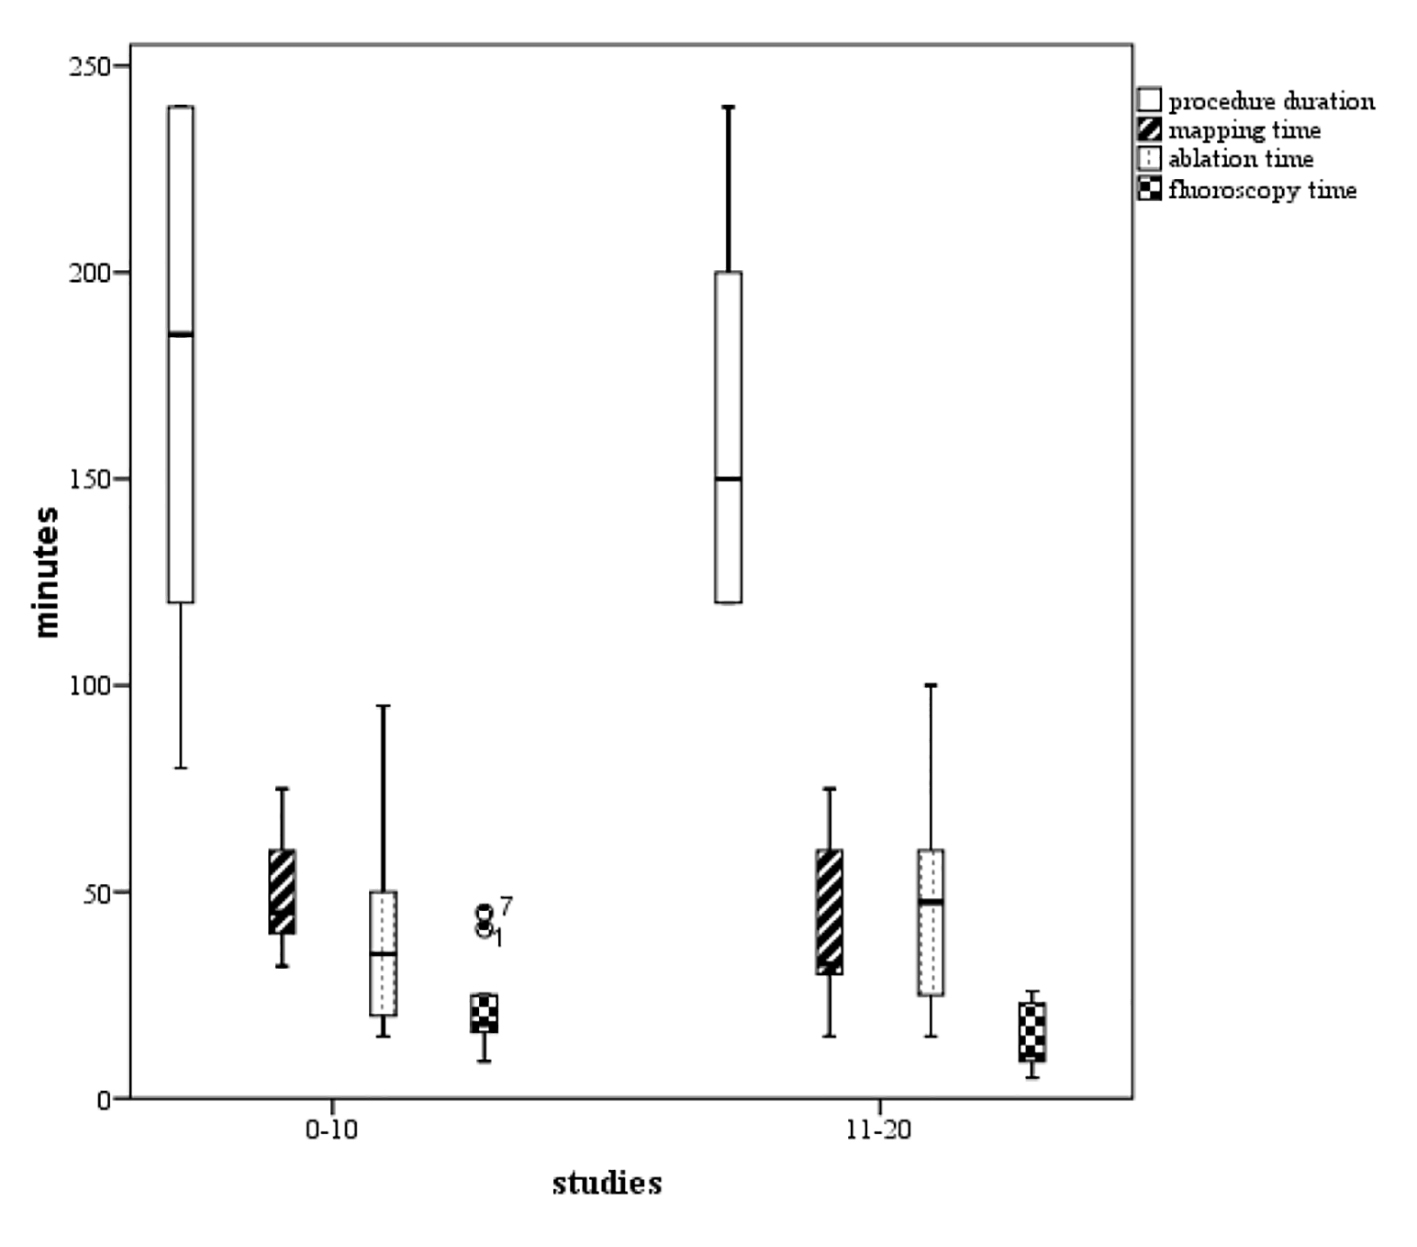
Figure 2. Boxplots of the procedure duration, mapping time, ablation time, and fluoroscopy time. We found a tendency to increased competence with the technology (P not significant), comparing phase 1 (the initial 10 cases) representing the learning curve, and phase 2 (the next 10 cases).
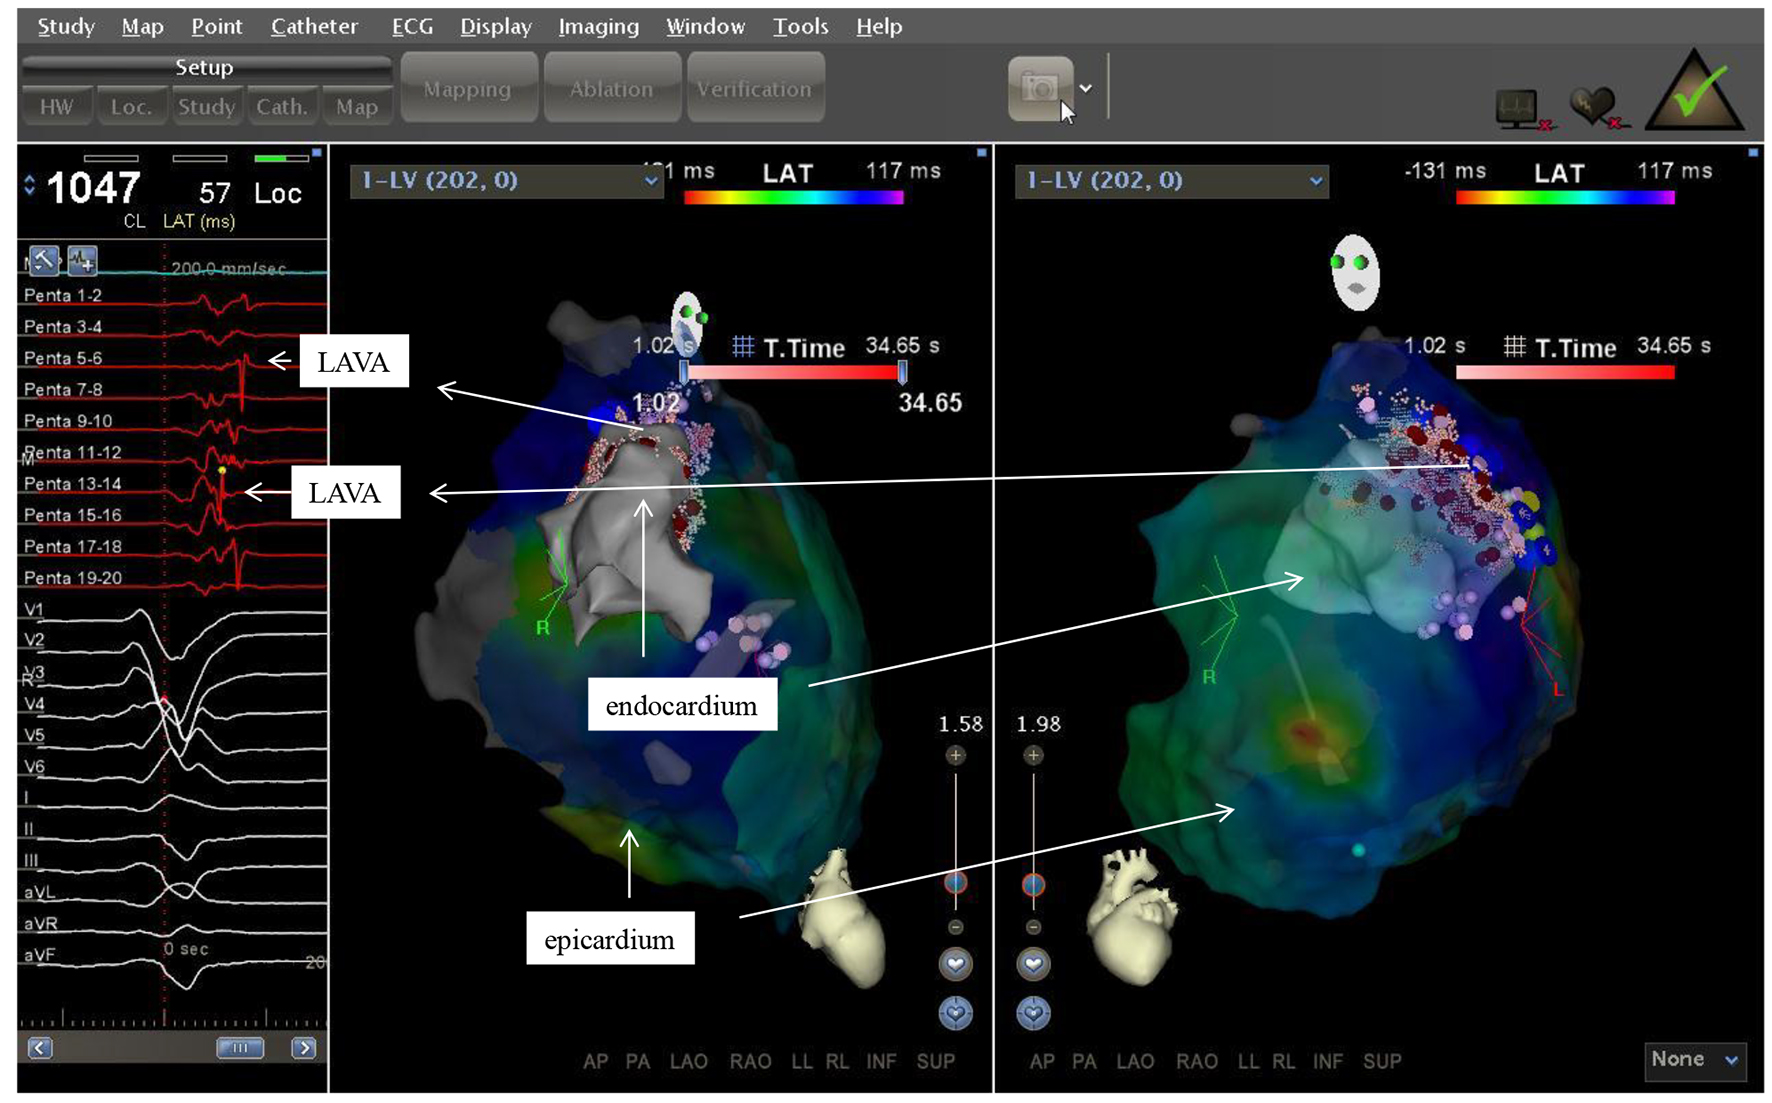
Figure 3. Two electroanatomic map of a patient with non ischemic cardiomyopathy. Left lateral and right anterior oblique views of the epicardium and a part of the left ventricle are depicted. Substratemap of the pericardium obtained with the PentaRay® was set at 45% transparency, so that each recorded bipolar electrogram, its morphology and timing in relation to QRS complex could be related to the underlying tissue.
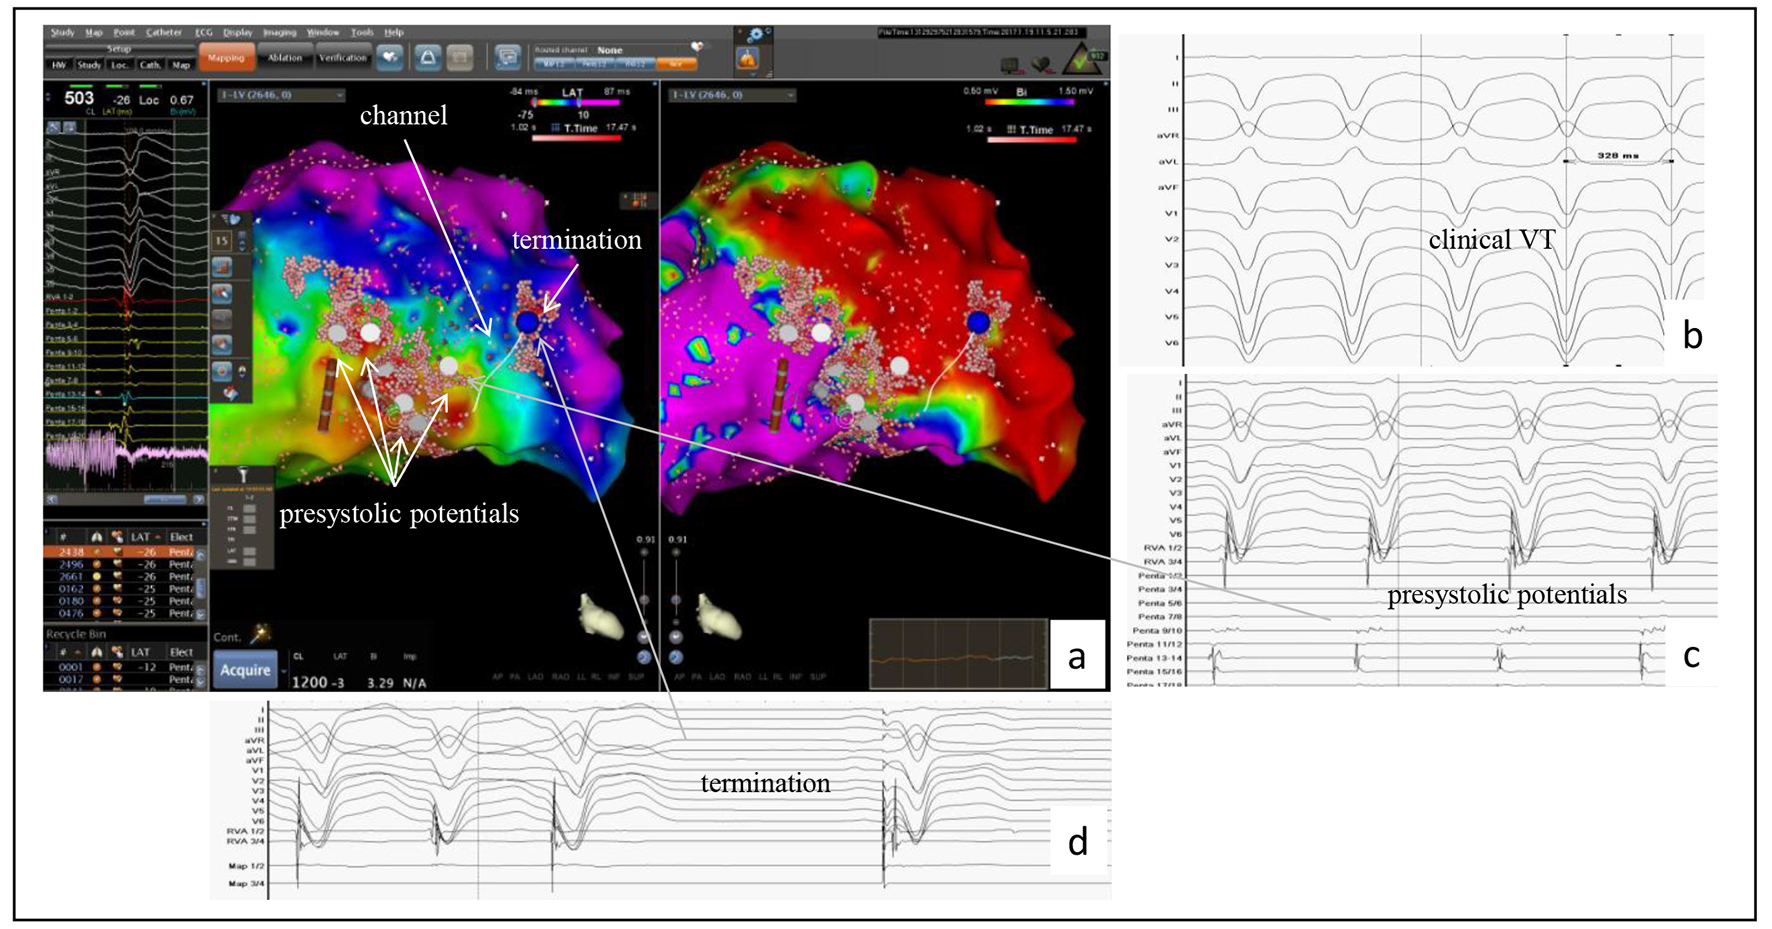
Figure 4. Example of the accuracy of the PentaRay® mapping catheter identifying a channel in a patient with a prior anterior wall myocardial infarction. (a) CARTO®3-guided electroanatomic map (EAM) of the left ventricle: activation map left sided, in which the area with the latest activation appears in blue, and the voltage map right sided with identification of a large dense scar in the anterior wall; to the left the bipolar signals of LAVAs at the center showing the latest activities suggesting a channel identified by the PentaRay® (white line in the EAM). This channel yields from inside the dense scar into the border zone and was identified as ablation target. (b) At baseline, VT was successful induced and well tolerated (CL 330 ms). (c) During VT, in the border zone, prasystolic fractionated signals but not mid-diastolic potentials (gray arrow) were recorded with the PentaRay® and annotated on the EAM (white points and gray arrow). Mapping the dense scar, the channel was then found inside dense scar and also annotated on the EAM (EAM, arrow). (d) VT terminates under radiofrequency ablation (blue point in the maps); the first beat is a paced rhythm.
Tables
Table 1. Clinical Characteristics of PentaRay® Patients
| Variable | N = 26 |
|---|
| CABG: coronary artery bypass graft; ICD: internal cardioverter defibrillator; NYHA: New York Heart Association; VT: ventricular tachycardia. Values are expressed as mean ± SD or n (%). |
| Age, years | 61.8 ± 10.1 |
| Sex, males | 22 (84.6%) |
| Device | 25 (97.2%) |
| Single chamber ICD | 15 (57.7%) |
| Dual chamber ICD | 6 (23.1%) |
| Cardiac resynchronization therapy with ICD | 4 (15.4%) |
| Ischemic cardiomyopathy | 18 (69.2%) |
| Three-vessel disease and/or CABG | 12 (46.1%) |
| Anterior wall/septal myocardial infarction | 13 (50.0%) |
| Posterior/inferior wall myocardial infarction | 11 (42.3%) |
| Lateral wall myocardial infarction | 2 (7.7%) |
| Sustained VT and/or ICD shock | 8 (30.8%) |
| Electrical storm | 2 (7.7%) |
| Slow VT | 4 (15.4%) |
| Non-ischemic cardiomyopathy | 8 (30.8%) |
| Sustained VT and/or ICD shock | 2 (7.7%) |
| Electrical storm | 3 (11.5%) |
| Ejection fraction < 35% | 23 (88.4%) |
| Ejection fraction in mean, % | 28.2 ± 11.5 |
| Atrial fibrillation | 10 (38.5%) |
| NYHA ≥ 3 | 14 (53.9%) |
| ≥ 2 prior VT ablation | 13 (50%) |
| ≥ 2 scars (patchy pattern and/or dens scar) | 15 (57.7%) |
| Hypertension | 23 (88.5%) |
| Diabetes | 11 (42.3%) |
| Hyperlipidemia | 22 (84.6%) |
| Smoking | 10 (38.5%) |
| Antiarrhythmic therapy | 22 (91.7%) |
| Beta-blocker | 25 (96.2%) |
| Amiodarone | 11 (42.3%) |
| Sotalol | 1 (3.8%) |
Table 2. Procedural Data of the PentaRay® Patients
| Variable | N = 26 |
|---|
| ICM: ischemic cardiomyopathy; LV: left ventricle; NICM: non-ischemic cardiomyopathy; VT: ventricular tachycardia. Values are expressed as mean ± SD or n (%). |
| Total area LV in cm2 | 311.7 ± 100.5 |
| Number of VT ≥ 2 | 7 (26.9%) |
| VT cycle length in ms | |
| VT 1 cycle length in ms | 366.2 ± 90.5 |
| VT 2 cycle length in ms | 402.8 ± 114.1 |
| ≥ 1 scar in voltage map | 15 (57.6%) |
| Ischemic cardiomyopathy | 9 (34.6%) |
| Non-ischemic cardiomyopathy | 6 (23.1%) |
| LV approach | |
| Retrograd | 6 (23.1%) |
| Transseptal | 24 (92.3%) |
| Epicardial | 4 (15.4%) |
| Programmed ventricular stimulation pre-ablation | 24 (92.3%) |
| Inducible VT | 17 (65.4%) |
| ICM | 14 (53.9%) |
| NICM | 3 (11.5%) |
| Non-inducibility in programmed ventricular stimulation | 7 (26.9%) |
| Programmed ventricular stimulation post-ablation | 12 (46.2%) |
| Hemodynamic stability during VT | 9 (34.6%) |
| Hemodynamic instability during VT | 17 (65.4%) |
| Complication | 0 (0%) |
| Procedure success | |
| Complete | 12 (46.2%) |
| Partial | 14 (53.9%) |
| Failure | 0 (0%) |
| Entrainment maneuver | 3 (11.5%) |
| Procedure time, min (range 80 - 300 min) | 175.4 ± 52.0 |
| Mapping time (range 15 - 160 min) | 55.6 ± 34.4 |
| Ablation time (range 15 - 130 min) | 50.7 ± 30.1 |
| Mapping points | 1,085.9 ± 726.1 |
| Fluoroscopy time | 22.1 ± 13.7 |
Table 3. Follow-Up of the PentaRay® Patients
| Variable | N = 26 |
|---|
| ICM: ischemic cardiomyopathy; LV: left ventricle; NICM: non-ischemic cardiomyopathy; VT: ventricular tachycardia. Values are expressed as mean ± SD or n (%). |
| Follow-up in months (range 1 - 33) | 14.7 ± 8.5 |
| Lost to follow-up | 1 (3.8%) |
| Recurrence of VT | |
| None | 17 (65.4%) |
| Non-sustained VT with amiodarone | 3 (11.5%) |
| Sustained VT | 5 (19.2%) |
| Further ablation due to recurrences of VT | 5 (19.2%) |
| Non-sustained VT with amiodarone after 3 months | 1 (3.8%) |
| Sustained VT with amiodarone after 6 months | 4 (15.4%) |
| Death | 4 (15.4%) |