
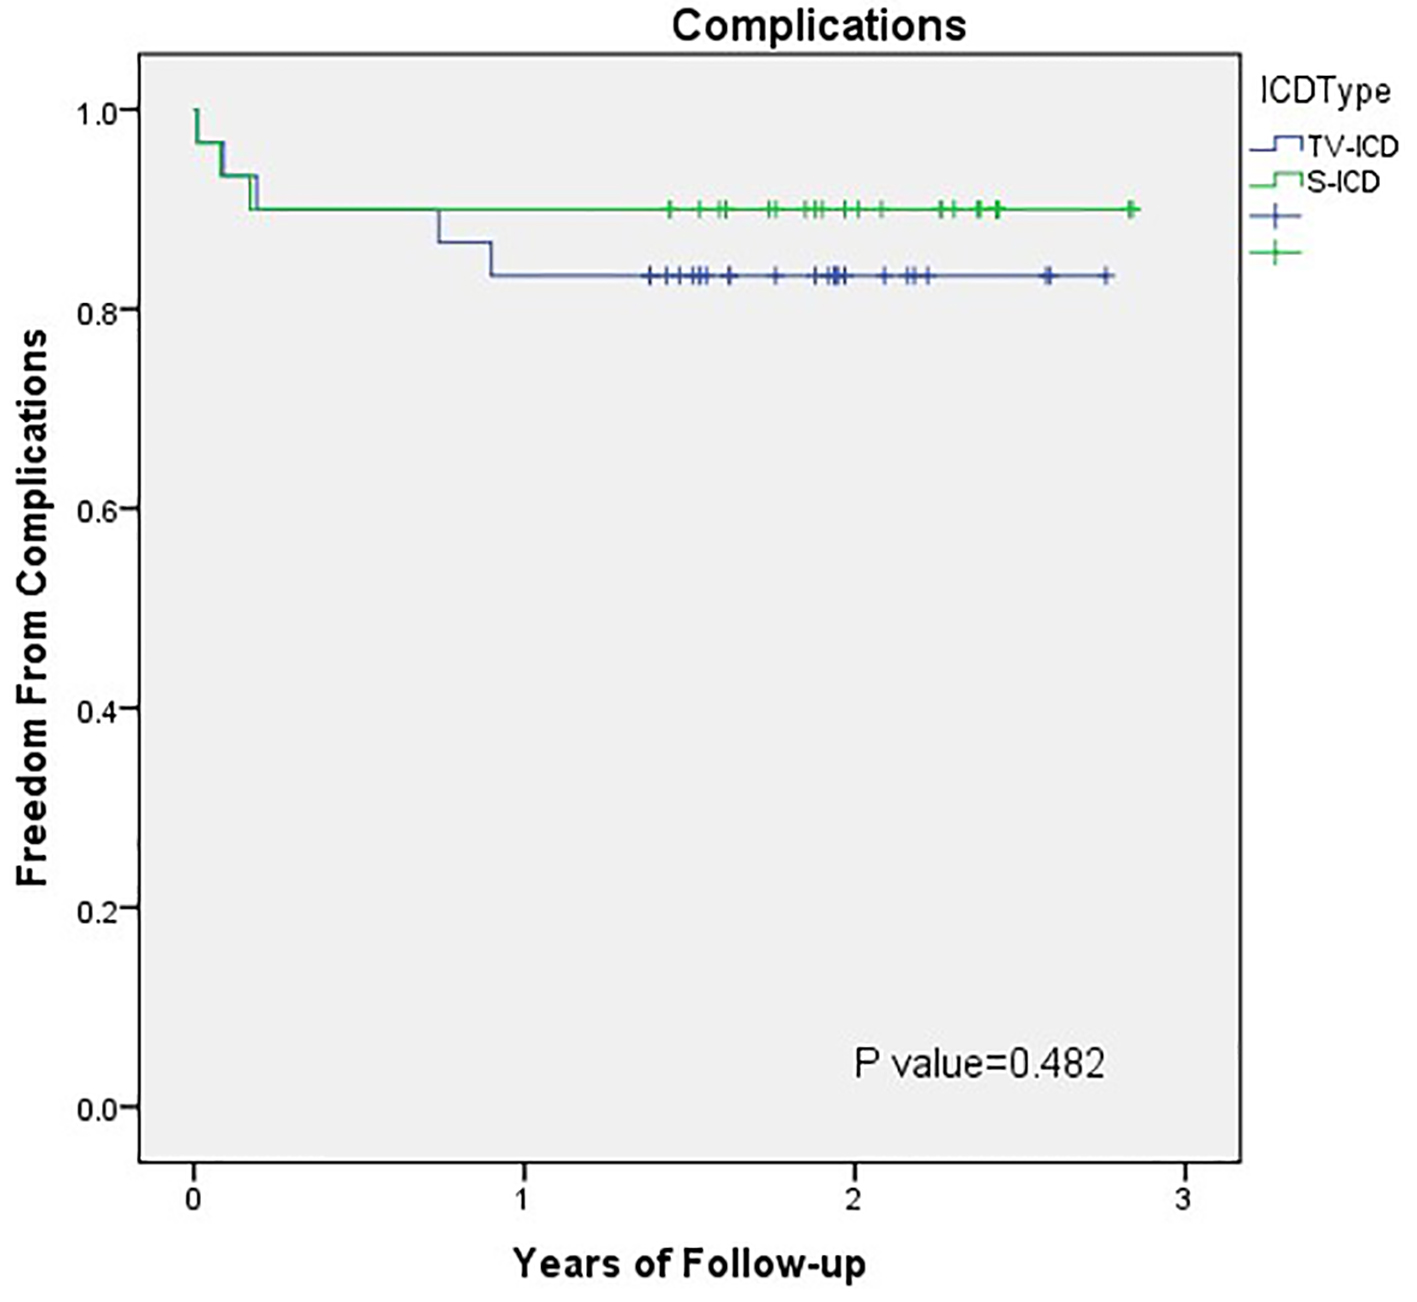
Figure 1. Outcomes comparison of S-ICD and TV-ICD: survival. Kaplan-Meier plot of survival in the S-ICD and TV-ICD patients. S-ICD: subcutaneous implantable cardioverter defibrillators; TV-ICD: transvenous implantable cardioverter defibrillators.
| Cardiology Research, ISSN 1923-2829 print, 1923-2837 online, Open Access |
| Article copyright, the authors; Journal compilation copyright, Cardiol Res and Elmer Press Inc |
| Journal website https://www.cardiologyres.org |
Original Article
Volume 8, Number 6, December 2017, pages 319-326
Subcutaneous Implantable Cardioverter Defibrillators Implantation Without Defibrillation Threshold Testing: A Single Center Experience
Figures
Table
| Patient characteristics | S-ICD, N (%) | TV-ICD, N (%) | P value |
|---|---|---|---|
| CABG: coronary artery bypass surgery; eGFR: estimated glomerular filtration rate; LVEF: left ventricular ejection fraction; N: number; NYHA: New York Heart Association; S-ICD: subcutaneous implantable cardioverter defibrillators; TV-ICD: transvenous implantable cardioverter defibrillators. | |||
| Mean age (years) | 41.03 | 50.33 | 0.009 |
| Male (%) | 23 (76.7%) | 24 (80%) | 0.754 |
| Mean LVEF (%) | 30.50 | 28.17 | 0.405 |
| Primary prevention | 25 (83%) | 26 (86.7%) | 0.718 |
| Diagnosis | |||
| Ischemic heart disease | 11 (36.7%) | 14 (46.7%) | 0.432 |
| Non-ischemic cardiomyopathy | 10 (33.3%) | 14 (46.7%) | 0.292 |
| Genetic (inherited) arrhythmia disease | 4 (13.3%) | 2 (6.7%) | 0.389 |
| Congenital heart disease | 5 (16.7%) | 0 (0%) | 0.020 |
| Diabetes | 6 (20%) | 16 (53.3%) | 0.007 |
| Hypertension | 7(23.3%) | 16 (53.3%) | 0.017 |
| Myocardial infarction | 10 (33.3%) | 10 (33.3%) | 1.000 |
| CABG | 5 (16.7%) | 6 (20%) | 0.739 |
| Atrial fibrillation | 3 (10%) | 7 (23.3%) | 0.166 |
| Renal function | |||
| Good (eGFR > 60 mL/min) | 26 (86.7%) | 20 (66.7%) | 0.067 |
| Moderate (eGFR 30 - 60 mL/min) | 3 (10%) | 8 (26.7%) | 0.095 |
| Poor (eGFR < 30 mL/min) | 1 (3.3%) | 2 (6.7%) | 0.554 |
| NYHA functional class | |||
| I | 16 (53.3%) | 4 (13.3%) | 0.001 |
| II | 10 (33.3%) | 20 (66.7%) | 0.010 |
| III | 4 (13.3%) | 5 (16.7%) | 0.718 |
| IV | 0 (0.0%) | 1 (3.3%) | 0.313 |